
|
|||||
|
 | |
| |
| |
| |
| |
| |
|
Gene: MED25 |
Gene summary for MED25 |
| Gene information | Species | Human | Gene symbol | MED25 | Gene ID | 81857 |
| Gene name | mediator complex subunit 25 | |
| Gene Alias | ACID1 | |
| Cytomap | 19q13.33 | |
| Gene Type | protein-coding | GO ID | GO:0000122 | UniProtAcc | Q71SY5 |
Top |
Malignant transformation analysis |
| Identification of the aberrant gene expression in precancerous and cancerous lesions by comparing the gene expression of stem-like cells in diseased tissues with normal stem cells |
| Entrez ID | Symbol | Replicates | Species | Organ | Tissue | Adj P-value | Log2FC | Malignancy |
| 81857 | MED25 | LZE4T | Human | Esophagus | ESCC | 5.14e-05 | 1.51e-01 | 0.0811 |
| 81857 | MED25 | LZE7T | Human | Esophagus | ESCC | 1.79e-09 | 4.35e-01 | 0.0667 |
| 81857 | MED25 | LZE8T | Human | Esophagus | ESCC | 2.10e-05 | 2.25e-01 | 0.067 |
| 81857 | MED25 | LZE20T | Human | Esophagus | ESCC | 3.00e-04 | 1.26e-01 | 0.0662 |
| 81857 | MED25 | LZE22D1 | Human | Esophagus | HGIN | 5.16e-04 | 1.67e-01 | 0.0595 |
| 81857 | MED25 | LZE22T | Human | Esophagus | ESCC | 7.38e-03 | 2.91e-01 | 0.068 |
| 81857 | MED25 | LZE24T | Human | Esophagus | ESCC | 7.11e-10 | 3.85e-01 | 0.0596 |
| 81857 | MED25 | LZE6T | Human | Esophagus | ESCC | 1.37e-03 | 1.64e-01 | 0.0845 |
| 81857 | MED25 | P1T-E | Human | Esophagus | ESCC | 3.44e-08 | 4.24e-01 | 0.0875 |
| 81857 | MED25 | P2T-E | Human | Esophagus | ESCC | 2.83e-16 | 3.53e-01 | 0.1177 |
| 81857 | MED25 | P4T-E | Human | Esophagus | ESCC | 5.37e-10 | 1.89e-01 | 0.1323 |
| 81857 | MED25 | P5T-E | Human | Esophagus | ESCC | 1.57e-06 | 1.60e-01 | 0.1327 |
| 81857 | MED25 | P8T-E | Human | Esophagus | ESCC | 7.09e-45 | 8.83e-01 | 0.0889 |
| 81857 | MED25 | P9T-E | Human | Esophagus | ESCC | 1.60e-11 | 1.69e-01 | 0.1131 |
| 81857 | MED25 | P10T-E | Human | Esophagus | ESCC | 2.32e-13 | 2.39e-01 | 0.116 |
| 81857 | MED25 | P11T-E | Human | Esophagus | ESCC | 8.07e-12 | 5.37e-01 | 0.1426 |
| 81857 | MED25 | P12T-E | Human | Esophagus | ESCC | 1.63e-14 | 3.47e-01 | 0.1122 |
| 81857 | MED25 | P15T-E | Human | Esophagus | ESCC | 2.80e-25 | 4.73e-01 | 0.1149 |
| 81857 | MED25 | P16T-E | Human | Esophagus | ESCC | 7.59e-07 | 1.28e-01 | 0.1153 |
| 81857 | MED25 | P17T-E | Human | Esophagus | ESCC | 2.57e-07 | 3.85e-01 | 0.1278 |
| Page: 1 2 3 4 5 |
| Tissue | Expression Dynamics | Abbreviation |
| Esophagus | 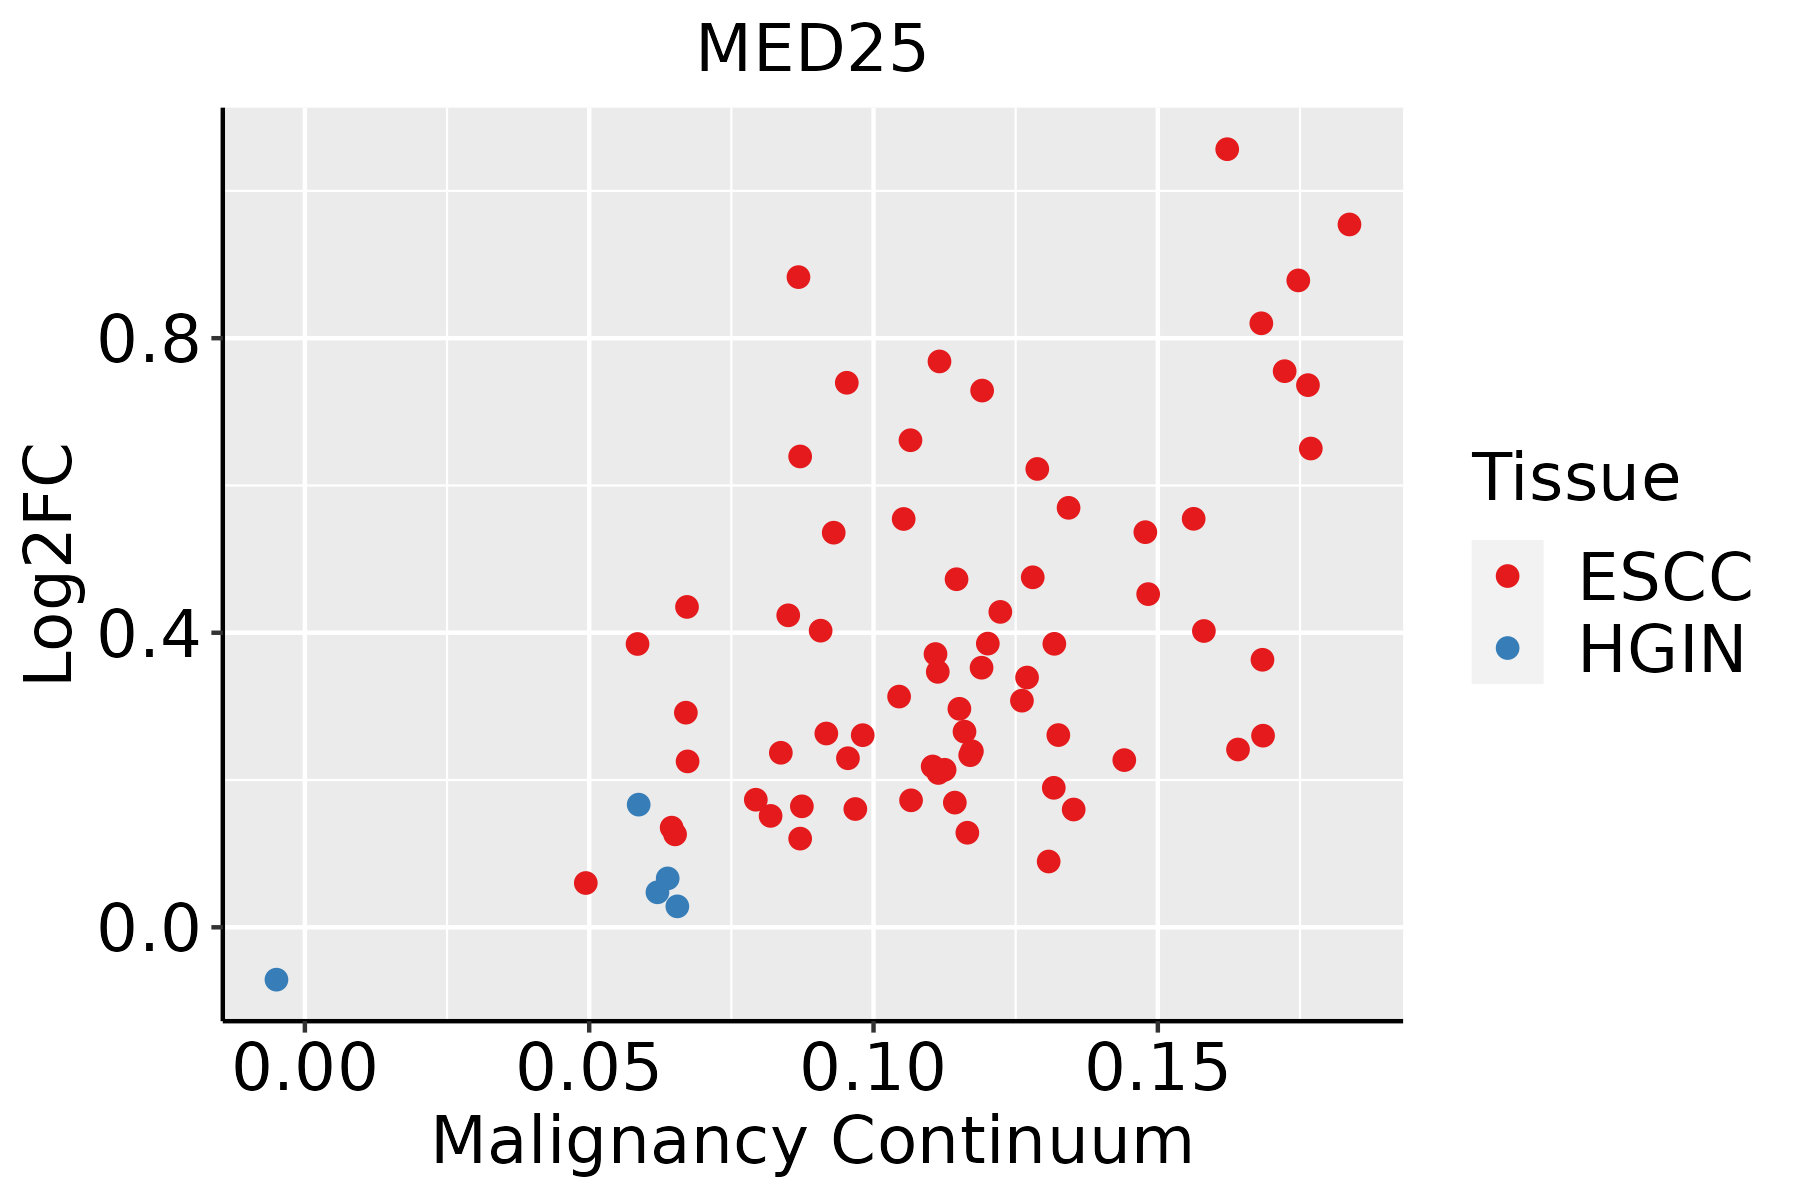 | ESCC: Esophageal squamous cell carcinoma |
| HGIN: High-grade intraepithelial neoplasias | ||
| LGIN: Low-grade intraepithelial neoplasias | ||
| Liver |  | HCC: Hepatocellular carcinoma |
| NAFLD: Non-alcoholic fatty liver disease | ||
| Oral Cavity | 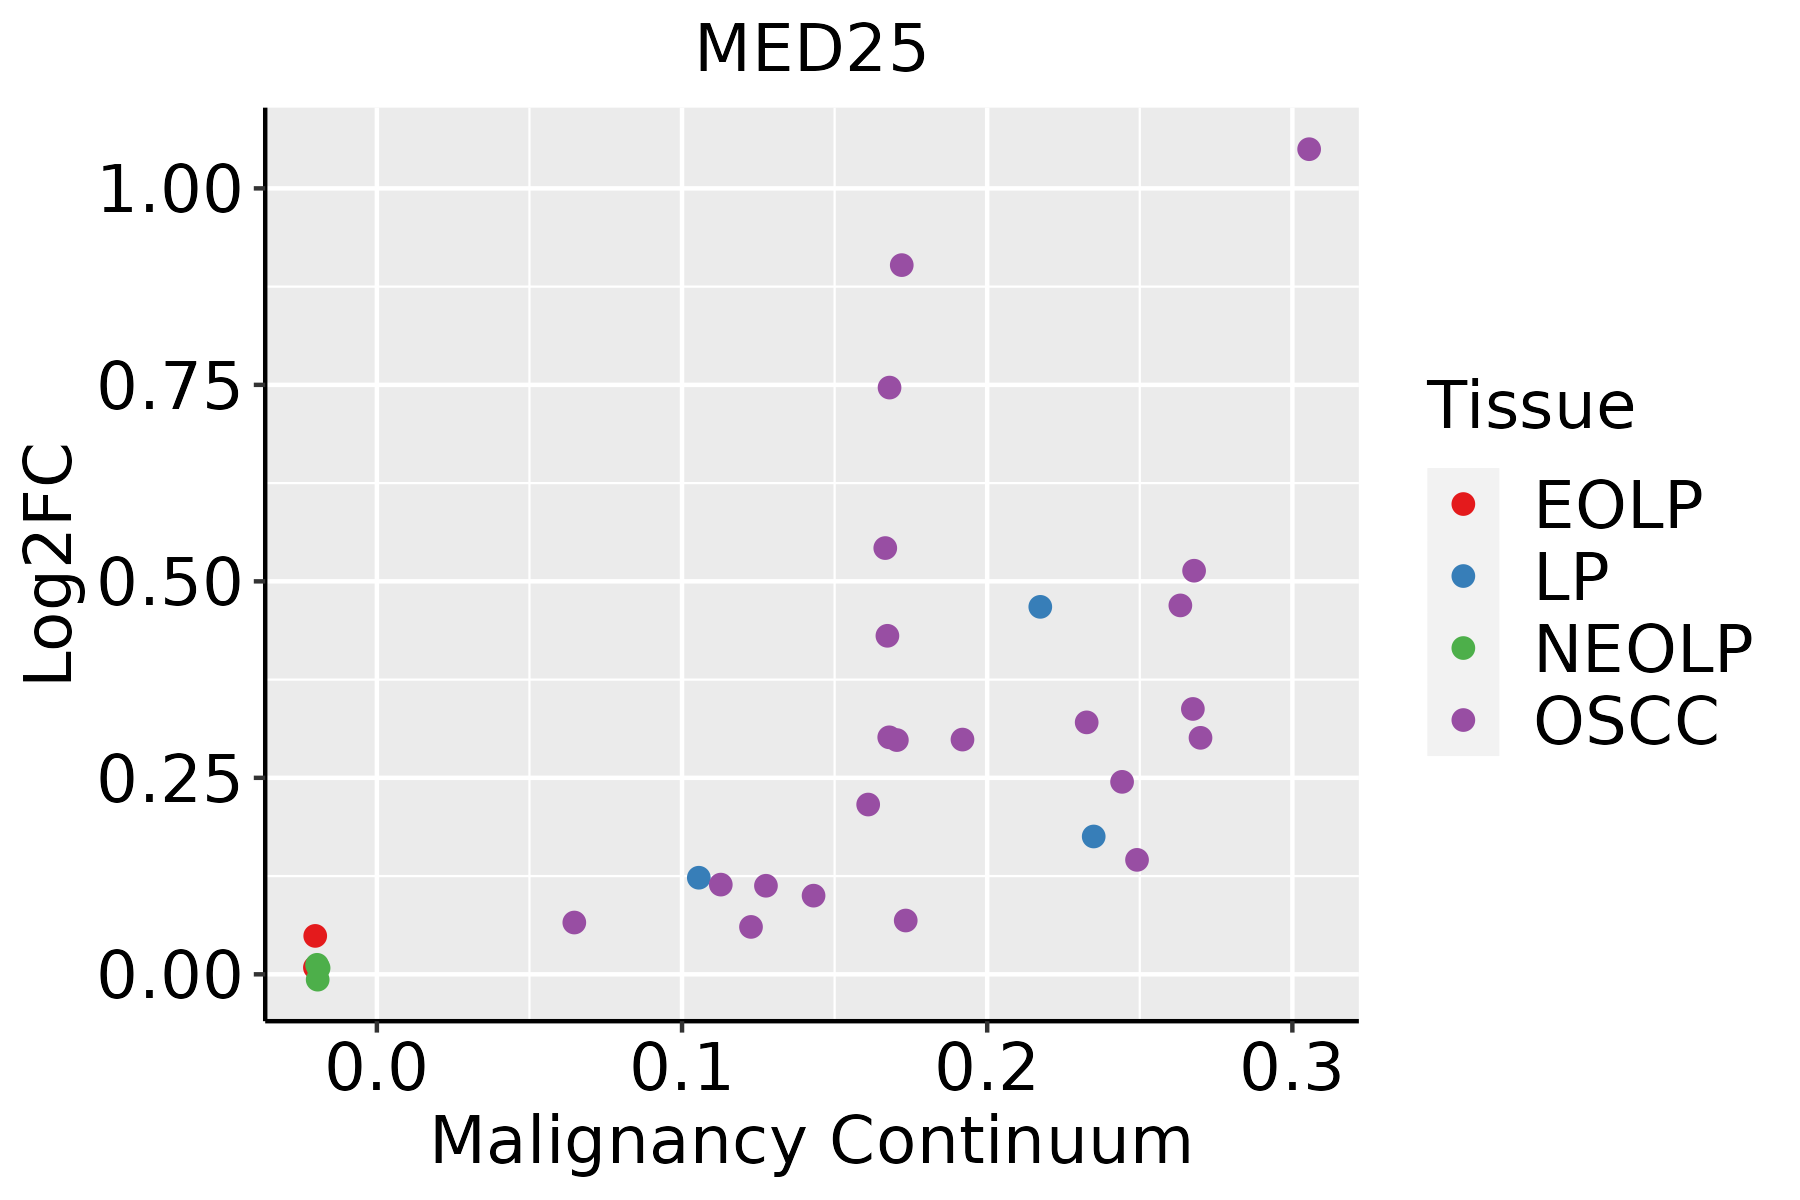 | EOLP: Erosive Oral lichen planus |
| LP: leukoplakia | ||
| NEOLP: Non-erosive oral lichen planus | ||
| OSCC: Oral squamous cell carcinoma | ||
| Thyroid |  | ATC: Anaplastic thyroid cancer |
| HT: Hashimoto's thyroiditis | ||
| PTC: Papillary thyroid cancer |
| ∗log2FC in expression of this searched gene in stem-like cells from each diseased tissue sample relative to stem-like cells in normal samples in each tissue plotted against the malignancy continuum. Samples are colored based on if they are from different disease stage. |
Top |
Malignant transformation related pathway analysis |
| Find out the enriched GO biological processes and KEGG pathways involved in transition from healthy to precancer to cancer |
| Tissue | Disease Stage | Enriched GO biological Processes |
| Colorectum | AD |  |
| Colorectum | SER |  |
| Colorectum | MSS |  |
| Colorectum | MSI-H |  |
| Colorectum | FAP |  |
| ∗Top 15 enriched GO BP terms are showed in the bar plot of each disease state in each tissue. Each row represents a significant GO biological process which is colored according to the -log10(p.adjust). |
| Page: 1 2 3 4 5 6 7 8 9 |
| GO ID | Tissue | Disease Stage | Description | Gene Ratio | Bg Ratio | pvalue | p.adjust | Count |
| GO:003133425 | Esophagus | HGIN | positive regulation of protein-containing complex assembly | 61/2587 | 237/18723 | 7.10e-07 | 3.00e-05 | 61 |
| GO:004325427 | Esophagus | HGIN | regulation of protein-containing complex assembly | 94/2587 | 428/18723 | 2.39e-06 | 8.55e-05 | 94 |
| GO:005109825 | Esophagus | HGIN | regulation of binding | 78/2587 | 363/18723 | 3.73e-05 | 9.30e-04 | 78 |
| GO:005109925 | Esophagus | HGIN | positive regulation of binding | 42/2587 | 173/18723 | 1.51e-04 | 2.97e-03 | 42 |
| GO:00481458 | Esophagus | HGIN | regulation of fibroblast proliferation | 23/2587 | 80/18723 | 3.71e-04 | 5.77e-03 | 23 |
| GO:00481447 | Esophagus | HGIN | fibroblast proliferation | 23/2587 | 81/18723 | 4.52e-04 | 6.62e-03 | 23 |
| GO:00481472 | Esophagus | HGIN | negative regulation of fibroblast proliferation | 10/2587 | 30/18723 | 5.36e-03 | 4.40e-02 | 10 |
| GO:0051098111 | Esophagus | ESCC | regulation of binding | 251/8552 | 363/18723 | 6.73e-20 | 8.46e-18 | 251 |
| GO:0043254111 | Esophagus | ESCC | regulation of protein-containing complex assembly | 278/8552 | 428/18723 | 3.81e-16 | 2.77e-14 | 278 |
| GO:0031334111 | Esophagus | ESCC | positive regulation of protein-containing complex assembly | 166/8552 | 237/18723 | 2.06e-14 | 1.07e-12 | 166 |
| GO:0051099111 | Esophagus | ESCC | positive regulation of binding | 122/8552 | 173/18723 | 2.79e-11 | 9.45e-10 | 122 |
| GO:004814414 | Esophagus | ESCC | fibroblast proliferation | 57/8552 | 81/18723 | 5.83e-06 | 6.03e-05 | 57 |
| GO:004814514 | Esophagus | ESCC | regulation of fibroblast proliferation | 56/8552 | 80/18723 | 9.08e-06 | 8.71e-05 | 56 |
| GO:00481471 | Esophagus | ESCC | negative regulation of fibroblast proliferation | 22/8552 | 30/18723 | 1.98e-03 | 8.90e-03 | 22 |
| GO:0035563 | Esophagus | ESCC | positive regulation of chromatin binding | 11/8552 | 14/18723 | 1.30e-02 | 4.27e-02 | 11 |
| GO:004325412 | Liver | Cirrhotic | regulation of protein-containing complex assembly | 169/4634 | 428/18723 | 7.40e-12 | 4.99e-10 | 169 |
| GO:005109812 | Liver | Cirrhotic | regulation of binding | 148/4634 | 363/18723 | 9.14e-12 | 5.97e-10 | 148 |
| GO:00313347 | Liver | Cirrhotic | positive regulation of protein-containing complex assembly | 95/4634 | 237/18723 | 1.21e-07 | 3.39e-06 | 95 |
| GO:005109912 | Liver | Cirrhotic | positive regulation of binding | 74/4634 | 173/18723 | 1.44e-07 | 3.87e-06 | 74 |
| GO:0048145 | Liver | Cirrhotic | regulation of fibroblast proliferation | 33/4634 | 80/18723 | 8.46e-04 | 6.12e-03 | 33 |
| Page: 1 2 3 |
| Pathway ID | Tissue | Disease Stage | Description | Gene Ratio | Bg Ratio | pvalue | p.adjust | qvalue | Count |
| Page: 1 |
Top |
Cell-cell communication analysis |
| Identification of potential cell-cell interactions between two cell types and their ligand-receptor pairs for different disease states |
| Ligand | Receptor | LRpair | Pathway | Tissue | Disease Stage |
| Page: 1 |
Top |
Single-cell gene regulatory network inference analysis |
| Find out the significant the regulons (TFs) and the target genes of each regulon across cell types for different disease states |
| TF | Cell Type | Tissue | Disease Stage | Target Gene | RSS | Regulon Activity |
| ∗The dot plots of a searched regulon are shown for all cell subpopulations in each disease state of each tissue based on the regulon specific score inferred using pySCENIC and by calculating the average expression. |
| Page: 1 |
Top |
Somatic mutation of malignant transformation related genes |
| Annotation of somatic variants for genes involved in malignant transformation |
| Hugo Symbol | Variant Class | Variant Classification | dbSNP RS | HGVSc | HGVSp | HGVSp Short | SWISSPROT | BIOTYPE | SIFT | PolyPhen | Tumor Sample Barcode | Tissue | Histology | Sex | Age | Stage | Therapy Types | Drugs | Outcome |
| MED25 | SNV | Missense_Mutation | rs775622130 | c.751N>A | p.Ala251Thr | p.A251T | Q71SY5 | protein_coding | tolerated(0.38) | benign(0.041) | TCGA-D8-A1XF-01 | Breast | breast invasive carcinoma | Female | <65 | I/II | Chemotherapy | adriamycin+cyclophosphamide | SD |
| MED25 | SNV | Missense_Mutation | c.1271C>T | p.Thr424Met | p.T424M | Q71SY5 | protein_coding | deleterious(0) | benign(0.375) | TCGA-D8-A1Y1-01 | Breast | breast invasive carcinoma | Female | >=65 | III/IV | Hormone Therapy | tamoxiphen | PD | |
| MED25 | SNV | Missense_Mutation | c.213N>G | p.Phe71Leu | p.F71L | Q71SY5 | protein_coding | deleterious(0) | probably_damaging(0.989) | TCGA-E2-A14Z-01 | Breast | breast invasive carcinoma | Female | <65 | I/II | Hormone Therapy | arimidex | PD | |
| MED25 | SNV | Missense_Mutation | novel | c.82N>G | p.Leu28Val | p.L28V | Q71SY5 | protein_coding | tolerated(0.07) | probably_damaging(0.992) | TCGA-PE-A5DE-01 | Breast | breast invasive carcinoma | Female | <65 | I/II | Chemotherapy | taxotere | CR |
| MED25 | SNV | Missense_Mutation | c.1864N>T | p.Pro622Ser | p.P622S | Q71SY5 | protein_coding | tolerated_low_confidence(0.07) | benign(0.026) | TCGA-IR-A3LK-01 | Cervix | cervical & endocervical cancer | Female | >=65 | I/II | Chemotherapy | cisplatin | PD | |
| MED25 | SNV | Missense_Mutation | c.1677N>T | p.Met559Ile | p.M559I | Q71SY5 | protein_coding | tolerated(0.13) | benign(0) | TCGA-JW-A5VI-01 | Cervix | cervical & endocervical cancer | Female | <65 | I/II | Chemotherapy | topotecan | PD | |
| MED25 | SNV | Missense_Mutation | rs371817340 | c.748N>A | p.Ala250Thr | p.A250T | Q71SY5 | protein_coding | tolerated(0.48) | benign(0.034) | TCGA-A6-2686-01 | Colorectum | colon adenocarcinoma | Female | >=65 | I/II | Unknown | Unknown | SD |
| MED25 | SNV | Missense_Mutation | c.1528N>A | p.Val510Met | p.V510M | Q71SY5 | protein_coding | deleterious(0.03) | probably_damaging(0.984) | TCGA-A6-6781-01 | Colorectum | colon adenocarcinoma | Male | <65 | III/IV | Chemotherapy | oxaliplatin | SD | |
| MED25 | SNV | Missense_Mutation | c.1224N>C | p.Trp408Cys | p.W408C | Q71SY5 | protein_coding | deleterious(0) | probably_damaging(0.999) | TCGA-AA-3710-01 | Colorectum | colon adenocarcinoma | Female | >=65 | I/II | Unknown | Unknown | SD | |
| MED25 | SNV | Missense_Mutation | rs781140315 | c.418C>T | p.Arg140Trp | p.R140W | Q71SY5 | protein_coding | deleterious(0) | probably_damaging(0.913) | TCGA-AA-3947-01 | Colorectum | colon adenocarcinoma | Female | <65 | I/II | Unknown | Unknown | SD |
| Page: 1 2 3 4 5 6 7 |
Top |
Related drugs of malignant transformation related genes |
| Identification of chemicals and drugs interact with genes involved in malignant transfromation |
| (DGIdb 4.0) |
| Entrez ID | Symbol | Category | Interaction Types | Drug Claim Name | Drug Name | PMIDs |
| Page: 1 |

Copyright 2023-Present -The University of Texas Health Science Center at Houston |