
|
|||||
|
 | |
| |
| |
| |
| |
| |
|
Gene: MED21 |
Gene summary for MED21 |
| Gene information | Species | Human | Gene symbol | MED21 | Gene ID | 9412 |
| Gene name | mediator complex subunit 21 | |
| Gene Alias | SRB7 | |
| Cytomap | 12p11.23 | |
| Gene Type | protein-coding | GO ID | GO:0001701 | UniProtAcc | A0A024RAW0 |
Top |
Malignant transformation analysis |
| Identification of the aberrant gene expression in precancerous and cancerous lesions by comparing the gene expression of stem-like cells in diseased tissues with normal stem cells |
| Entrez ID | Symbol | Replicates | Species | Organ | Tissue | Adj P-value | Log2FC | Malignancy |
| 9412 | MED21 | LZE4T | Human | Esophagus | ESCC | 1.80e-08 | 1.25e-01 | 0.0811 |
| 9412 | MED21 | LZE8T | Human | Esophagus | ESCC | 7.07e-10 | 5.48e-01 | 0.067 |
| 9412 | MED21 | LZE20T | Human | Esophagus | ESCC | 1.48e-07 | 2.35e-01 | 0.0662 |
| 9412 | MED21 | LZE22D1 | Human | Esophagus | HGIN | 1.87e-02 | -3.60e-02 | 0.0595 |
| 9412 | MED21 | LZE24T | Human | Esophagus | ESCC | 1.74e-12 | 3.79e-01 | 0.0596 |
| 9412 | MED21 | LZE21T | Human | Esophagus | ESCC | 2.39e-03 | 3.84e-01 | 0.0655 |
| 9412 | MED21 | LZE6T | Human | Esophagus | ESCC | 1.97e-05 | 3.60e-01 | 0.0845 |
| 9412 | MED21 | P1T-E | Human | Esophagus | ESCC | 1.81e-03 | 1.43e-01 | 0.0875 |
| 9412 | MED21 | P2T-E | Human | Esophagus | ESCC | 1.55e-37 | 6.95e-01 | 0.1177 |
| 9412 | MED21 | P4T-E | Human | Esophagus | ESCC | 4.15e-47 | 1.46e+00 | 0.1323 |
| 9412 | MED21 | P5T-E | Human | Esophagus | ESCC | 1.38e-23 | 3.92e-01 | 0.1327 |
| 9412 | MED21 | P8T-E | Human | Esophagus | ESCC | 3.75e-31 | 5.57e-01 | 0.0889 |
| 9412 | MED21 | P9T-E | Human | Esophagus | ESCC | 6.25e-19 | 1.91e-01 | 0.1131 |
| 9412 | MED21 | P10T-E | Human | Esophagus | ESCC | 2.08e-26 | 4.76e-01 | 0.116 |
| 9412 | MED21 | P12T-E | Human | Esophagus | ESCC | 1.02e-44 | 9.04e-01 | 0.1122 |
| 9412 | MED21 | P15T-E | Human | Esophagus | ESCC | 1.06e-15 | 4.89e-01 | 0.1149 |
| 9412 | MED21 | P16T-E | Human | Esophagus | ESCC | 1.60e-81 | 1.75e+00 | 0.1153 |
| 9412 | MED21 | P17T-E | Human | Esophagus | ESCC | 1.24e-08 | 5.57e-01 | 0.1278 |
| 9412 | MED21 | P19T-E | Human | Esophagus | ESCC | 1.06e-05 | 9.10e-01 | 0.1662 |
| 9412 | MED21 | P20T-E | Human | Esophagus | ESCC | 2.19e-21 | 4.38e-01 | 0.1124 |
| Page: 1 2 3 4 5 |
| Tissue | Expression Dynamics | Abbreviation |
| Esophagus |  | ESCC: Esophageal squamous cell carcinoma |
| HGIN: High-grade intraepithelial neoplasias | ||
| LGIN: Low-grade intraepithelial neoplasias | ||
| Oral Cavity | 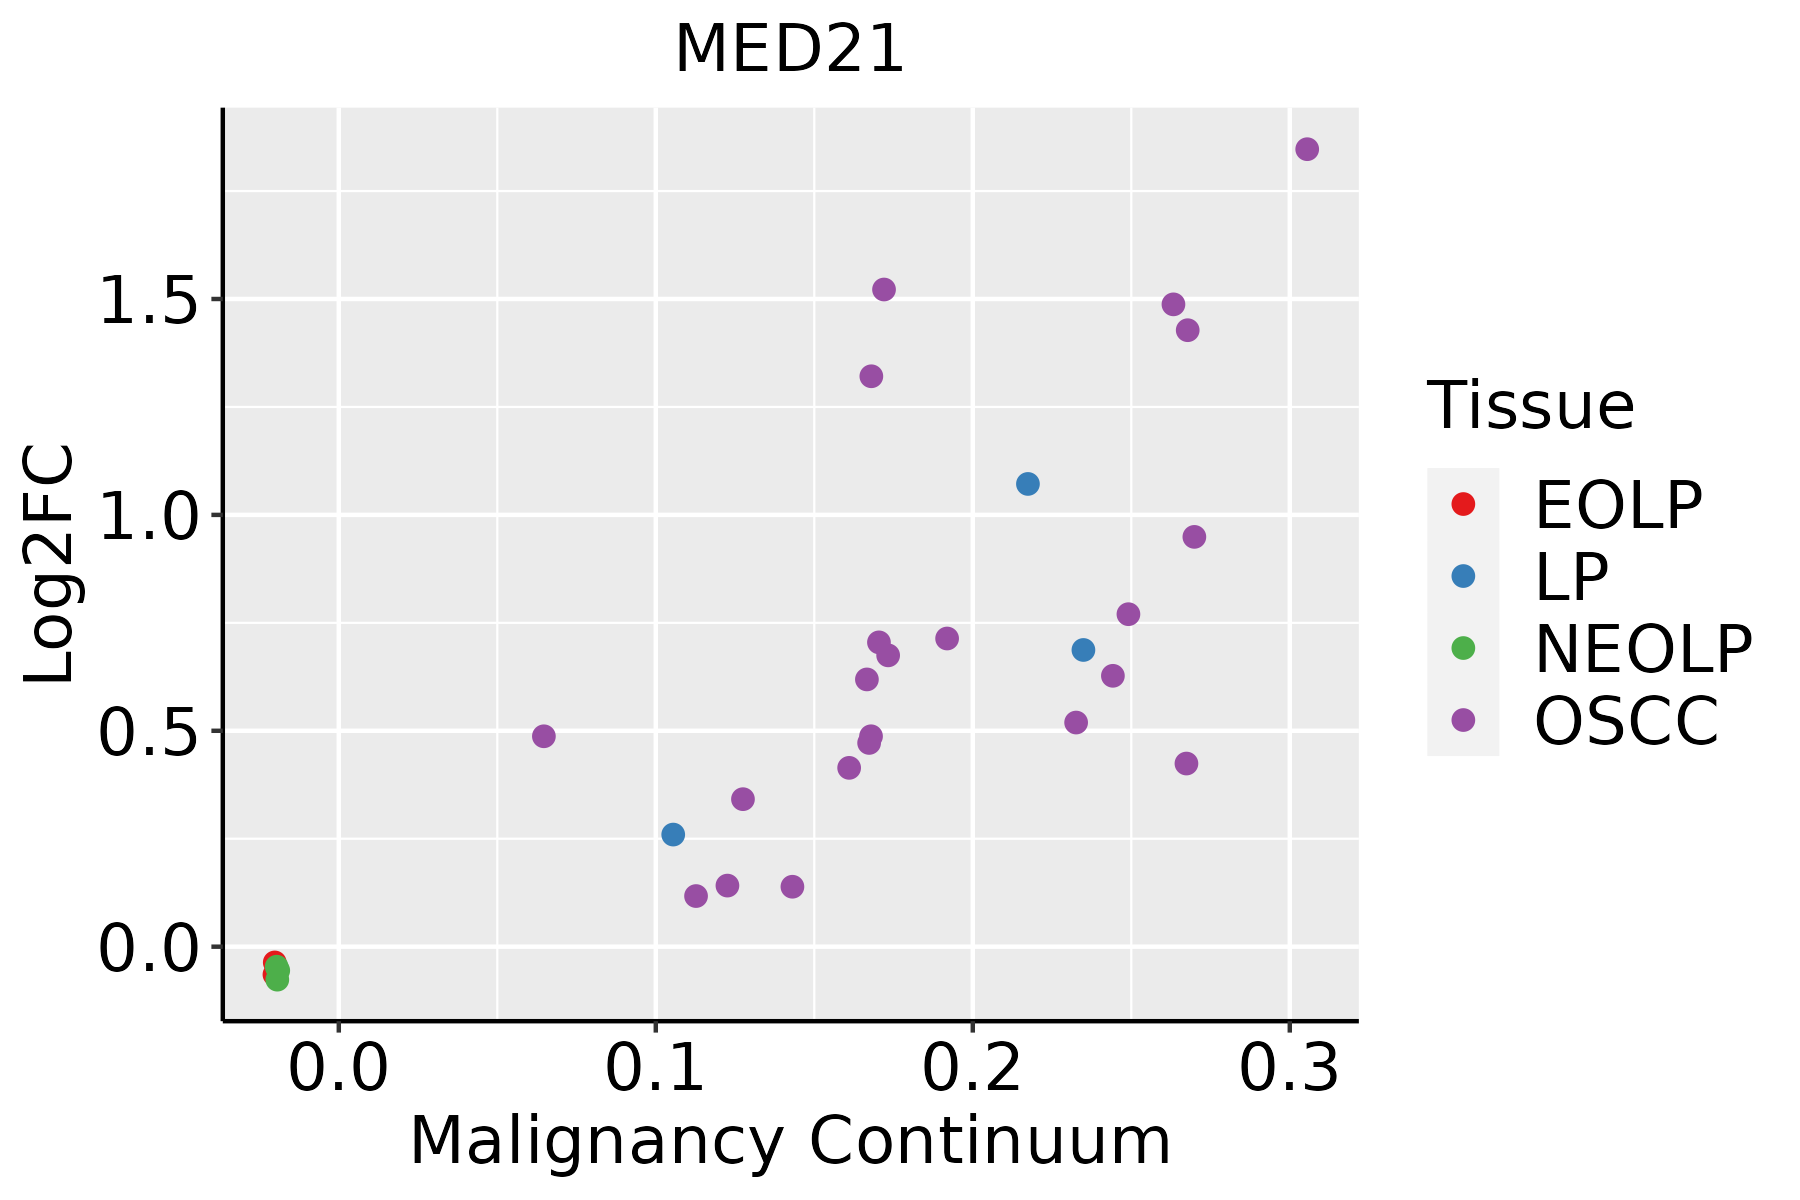 | EOLP: Erosive Oral lichen planus |
| LP: leukoplakia | ||
| NEOLP: Non-erosive oral lichen planus | ||
| OSCC: Oral squamous cell carcinoma | ||
| Skin | 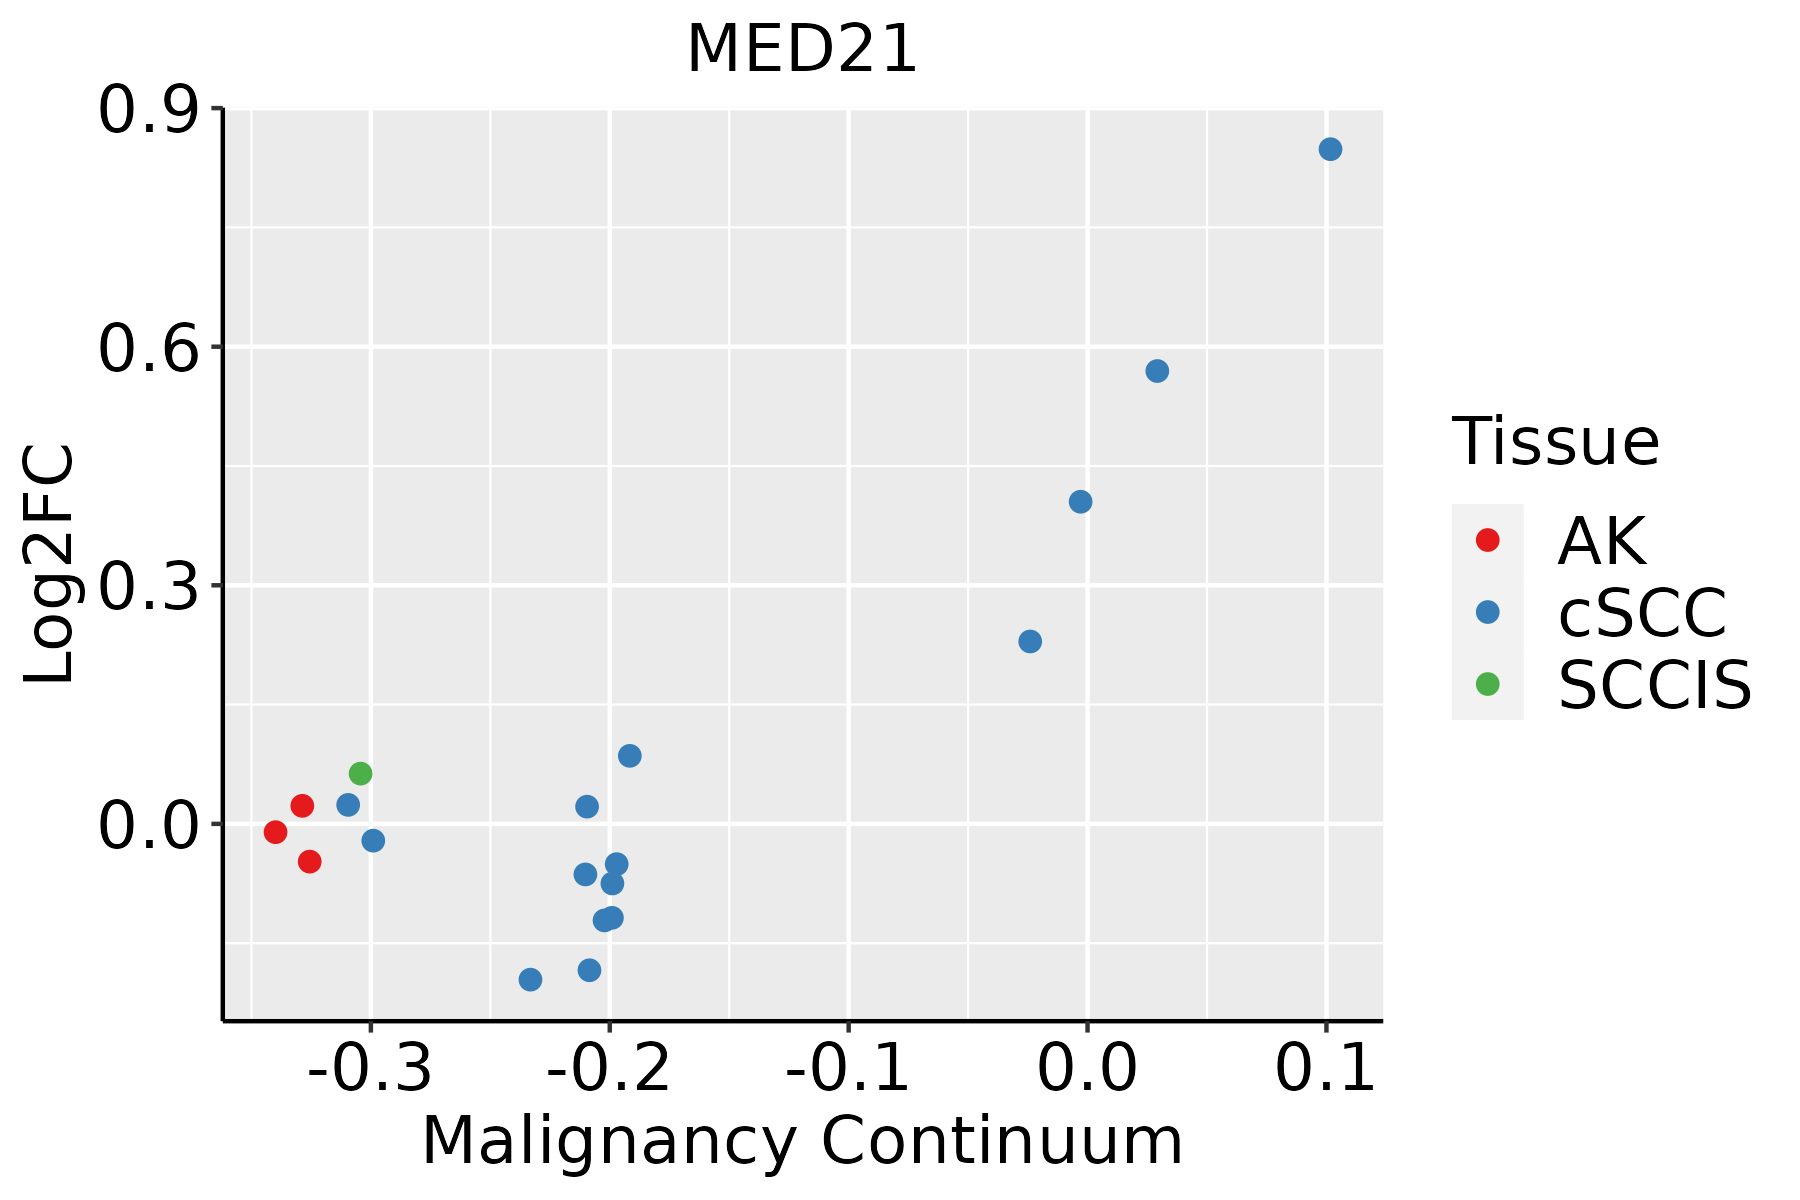 | AK: Actinic keratosis |
| cSCC: Cutaneous squamous cell carcinoma | ||
| SCCIS:squamous cell carcinoma in situ |
| ∗log2FC in expression of this searched gene in stem-like cells from each diseased tissue sample relative to stem-like cells in normal samples in each tissue plotted against the malignancy continuum. Samples are colored based on if they are from different disease stage. |
Top |
Malignant transformation related pathway analysis |
| Find out the enriched GO biological processes and KEGG pathways involved in transition from healthy to precancer to cancer |
| Tissue | Disease Stage | Enriched GO biological Processes |
| Colorectum | AD |  |
| Colorectum | SER |  |
| Colorectum | MSS |  |
| Colorectum | MSI-H |  |
| Colorectum | FAP |  |
| ∗Top 15 enriched GO BP terms are showed in the bar plot of each disease state in each tissue. Each row represents a significant GO biological process which is colored according to the -log10(p.adjust). |
| Page: 1 2 3 4 5 6 7 8 9 |
| GO ID | Tissue | Disease Stage | Description | Gene Ratio | Bg Ratio | pvalue | p.adjust | Count |
| GO:00198277 | Esophagus | HGIN | stem cell population maintenance | 39/2587 | 131/18723 | 1.63e-06 | 6.14e-05 | 39 |
| GO:00987278 | Esophagus | HGIN | maintenance of cell number | 39/2587 | 134/18723 | 3.02e-06 | 1.03e-04 | 39 |
| GO:000170118 | Esophagus | HGIN | in utero embryonic development | 77/2587 | 367/18723 | 9.56e-05 | 2.05e-03 | 77 |
| GO:00018244 | Esophagus | HGIN | blastocyst development | 28/2587 | 106/18723 | 4.30e-04 | 6.47e-03 | 28 |
| GO:000170119 | Esophagus | ESCC | in utero embryonic development | 243/8552 | 367/18723 | 1.00e-15 | 6.86e-14 | 243 |
| GO:009872714 | Esophagus | ESCC | maintenance of cell number | 90/8552 | 134/18723 | 3.94e-07 | 5.43e-06 | 90 |
| GO:001982714 | Esophagus | ESCC | stem cell population maintenance | 88/8552 | 131/18723 | 5.23e-07 | 6.97e-06 | 88 |
| GO:000182412 | Esophagus | ESCC | blastocyst development | 73/8552 | 106/18723 | 1.13e-06 | 1.40e-05 | 73 |
| GO:000170116 | Oral cavity | OSCC | in utero embryonic development | 207/7305 | 367/18723 | 7.92e-12 | 2.95e-10 | 207 |
| GO:00987277 | Oral cavity | OSCC | maintenance of cell number | 81/7305 | 134/18723 | 3.96e-07 | 5.90e-06 | 81 |
| GO:00198276 | Oral cavity | OSCC | stem cell population maintenance | 79/7305 | 131/18723 | 6.28e-07 | 8.96e-06 | 79 |
| GO:00018243 | Oral cavity | OSCC | blastocyst development | 66/7305 | 106/18723 | 1.04e-06 | 1.40e-05 | 66 |
| GO:000170124 | Skin | cSCC | in utero embryonic development | 150/4864 | 367/18723 | 2.47e-10 | 1.04e-08 | 150 |
| GO:000182413 | Skin | cSCC | blastocyst development | 53/4864 | 106/18723 | 9.74e-08 | 2.32e-06 | 53 |
| GO:001982715 | Skin | cSCC | stem cell population maintenance | 58/4864 | 131/18723 | 4.20e-06 | 6.24e-05 | 58 |
| GO:009872715 | Skin | cSCC | maintenance of cell number | 58/4864 | 134/18723 | 9.83e-06 | 1.29e-04 | 58 |
| Page: 1 |
| Pathway ID | Tissue | Disease Stage | Description | Gene Ratio | Bg Ratio | pvalue | p.adjust | qvalue | Count |
| Page: 1 |
Top |
Cell-cell communication analysis |
| Identification of potential cell-cell interactions between two cell types and their ligand-receptor pairs for different disease states |
| Ligand | Receptor | LRpair | Pathway | Tissue | Disease Stage |
| Page: 1 |
Top |
Single-cell gene regulatory network inference analysis |
| Find out the significant the regulons (TFs) and the target genes of each regulon across cell types for different disease states |
| TF | Cell Type | Tissue | Disease Stage | Target Gene | RSS | Regulon Activity |
| ∗The dot plots of a searched regulon are shown for all cell subpopulations in each disease state of each tissue based on the regulon specific score inferred using pySCENIC and by calculating the average expression. |
| Page: 1 |
Top |
Somatic mutation of malignant transformation related genes |
| Annotation of somatic variants for genes involved in malignant transformation |
| Hugo Symbol | Variant Class | Variant Classification | dbSNP RS | HGVSc | HGVSp | HGVSp Short | SWISSPROT | BIOTYPE | SIFT | PolyPhen | Tumor Sample Barcode | Tissue | Histology | Sex | Age | Stage | Therapy Types | Drugs | Outcome |
| MED21 | SNV | Missense_Mutation | c.329N>A | p.Arg110Gln | p.R110Q | Q13503 | protein_coding | tolerated(0.2) | benign(0.13) | TCGA-BH-A0HF-01 | Breast | breast invasive carcinoma | Female | >=65 | I/II | Hormone Therapy | arimidex | SD | |
| MED21 | SNV | Missense_Mutation | novel | c.181C>A | p.Leu61Met | p.L61M | Q13503 | protein_coding | tolerated(0.09) | benign(0.094) | TCGA-AG-3726-01 | Colorectum | rectum adenocarcinoma | Female | <65 | I/II | Unknown | Unknown | SD |
| MED21 | SNV | Missense_Mutation | novel | c.291N>A | p.Asn97Lys | p.N97K | Q13503 | protein_coding | deleterious(0.01) | probably_damaging(0.998) | TCGA-AP-A051-01 | Endometrium | uterine corpus endometrioid carcinoma | Female | >=65 | I/II | Unknown | Unknown | SD |
| MED21 | SNV | Missense_Mutation | c.202G>T | p.Asp68Tyr | p.D68Y | Q13503 | protein_coding | deleterious(0) | possibly_damaging(0.843) | TCGA-AP-A056-01 | Endometrium | uterine corpus endometrioid carcinoma | Female | <65 | I/II | Unknown | Unknown | SD | |
| MED21 | SNV | Missense_Mutation | novel | c.95N>T | p.Pro32Leu | p.P32L | Q13503 | protein_coding | deleterious(0) | benign(0.071) | TCGA-B5-A3FA-01 | Endometrium | uterine corpus endometrioid carcinoma | Female | >=65 | I/II | Unknown | Unknown | SD |
| MED21 | SNV | Missense_Mutation | c.417N>T | p.Gln139His | p.Q139H | Q13503 | protein_coding | deleterious_low_confidence(0.02) | benign(0) | TCGA-50-5930-01 | Lung | lung adenocarcinoma | Male | <65 | III/IV | Chemotherapy | taxotere | PD | |
| MED21 | SNV | Missense_Mutation | novel | c.292C>A | p.His98Asn | p.H98N | Q13503 | protein_coding | tolerated(0.13) | benign(0.028) | TCGA-95-7567-01 | Lung | lung adenocarcinoma | Male | <65 | I/II | Chemotherapy | cisplatin | SD |
| MED21 | SNV | Missense_Mutation | novel | c.31G>T | p.Ala11Ser | p.A11S | Q13503 | protein_coding | tolerated(0.16) | benign(0.238) | TCGA-56-8625-01 | Lung | lung squamous cell carcinoma | Female | >=65 | III/IV | Chemotherapy | cisplatin | PD |
| MED21 | SNV | Missense_Mutation | novel | c.413G>T | p.Ser138Ile | p.S138I | Q13503 | protein_coding | deleterious(0) | benign(0.025) | TCGA-56-A5DS-01 | Lung | lung squamous cell carcinoma | Female | >=65 | I/II | Unknown | Unknown | SD |
| MED21 | SNV | Missense_Mutation | c.117N>T | p.Gln39His | p.Q39H | Q13503 | protein_coding | tolerated(0.08) | possibly_damaging(0.69) | TCGA-BR-6452-01 | Stomach | stomach adenocarcinoma | Female | >=65 | I/II | Unknown | Unknown | SD |
| Page: 1 2 |
Top |
Related drugs of malignant transformation related genes |
| Identification of chemicals and drugs interact with genes involved in malignant transfromation |
| (DGIdb 4.0) |
| Entrez ID | Symbol | Category | Interaction Types | Drug Claim Name | Drug Name | PMIDs |
| Page: 1 |

Copyright 2023-Present -The University of Texas Health Science Center at Houston |