
|
|||||
|
 | |
| |
| |
| |
| |
| |
|
Gene: MED19 |
Gene summary for MED19 |
| Gene information | Species | Human | Gene symbol | MED19 | Gene ID | 219541 |
| Gene name | mediator complex subunit 19 | |
| Gene Alias | DT2P1G7 | |
| Cytomap | 11q12.1 | |
| Gene Type | protein-coding | GO ID | GO:0006139 | UniProtAcc | A0JLT2 |
Top |
Malignant transformation analysis |
| Identification of the aberrant gene expression in precancerous and cancerous lesions by comparing the gene expression of stem-like cells in diseased tissues with normal stem cells |
| Entrez ID | Symbol | Replicates | Species | Organ | Tissue | Adj P-value | Log2FC | Malignancy |
| 219541 | MED19 | LZE2T | Human | Esophagus | ESCC | 1.28e-02 | 3.74e-01 | 0.082 |
| 219541 | MED19 | LZE4T | Human | Esophagus | ESCC | 2.11e-16 | 3.82e-01 | 0.0811 |
| 219541 | MED19 | LZE5T | Human | Esophagus | ESCC | 3.33e-05 | 1.67e-01 | 0.0514 |
| 219541 | MED19 | LZE7T | Human | Esophagus | ESCC | 6.04e-13 | 4.78e-01 | 0.0667 |
| 219541 | MED19 | LZE8T | Human | Esophagus | ESCC | 1.43e-11 | 1.45e-01 | 0.067 |
| 219541 | MED19 | LZE20T | Human | Esophagus | ESCC | 8.84e-08 | 1.51e-01 | 0.0662 |
| 219541 | MED19 | LZE24T | Human | Esophagus | ESCC | 7.70e-22 | 5.96e-01 | 0.0596 |
| 219541 | MED19 | LZE6T | Human | Esophagus | ESCC | 9.32e-05 | 3.10e-01 | 0.0845 |
| 219541 | MED19 | P1T-E | Human | Esophagus | ESCC | 1.49e-10 | 6.22e-01 | 0.0875 |
| 219541 | MED19 | P2T-E | Human | Esophagus | ESCC | 2.91e-34 | 6.62e-01 | 0.1177 |
| 219541 | MED19 | P4T-E | Human | Esophagus | ESCC | 2.28e-62 | 1.35e+00 | 0.1323 |
| 219541 | MED19 | P5T-E | Human | Esophagus | ESCC | 2.17e-27 | 4.21e-01 | 0.1327 |
| 219541 | MED19 | P8T-E | Human | Esophagus | ESCC | 1.86e-41 | 7.89e-01 | 0.0889 |
| 219541 | MED19 | P9T-E | Human | Esophagus | ESCC | 2.10e-25 | 5.15e-01 | 0.1131 |
| 219541 | MED19 | P10T-E | Human | Esophagus | ESCC | 6.67e-25 | 5.66e-01 | 0.116 |
| 219541 | MED19 | P11T-E | Human | Esophagus | ESCC | 2.95e-22 | 8.85e-01 | 0.1426 |
| 219541 | MED19 | P12T-E | Human | Esophagus | ESCC | 1.32e-56 | 1.07e+00 | 0.1122 |
| 219541 | MED19 | P15T-E | Human | Esophagus | ESCC | 4.13e-22 | 3.40e-01 | 0.1149 |
| 219541 | MED19 | P16T-E | Human | Esophagus | ESCC | 1.73e-23 | 4.31e-01 | 0.1153 |
| 219541 | MED19 | P17T-E | Human | Esophagus | ESCC | 2.02e-13 | 6.40e-01 | 0.1278 |
| Page: 1 2 3 4 5 6 |
| Tissue | Expression Dynamics | Abbreviation |
| Esophagus | 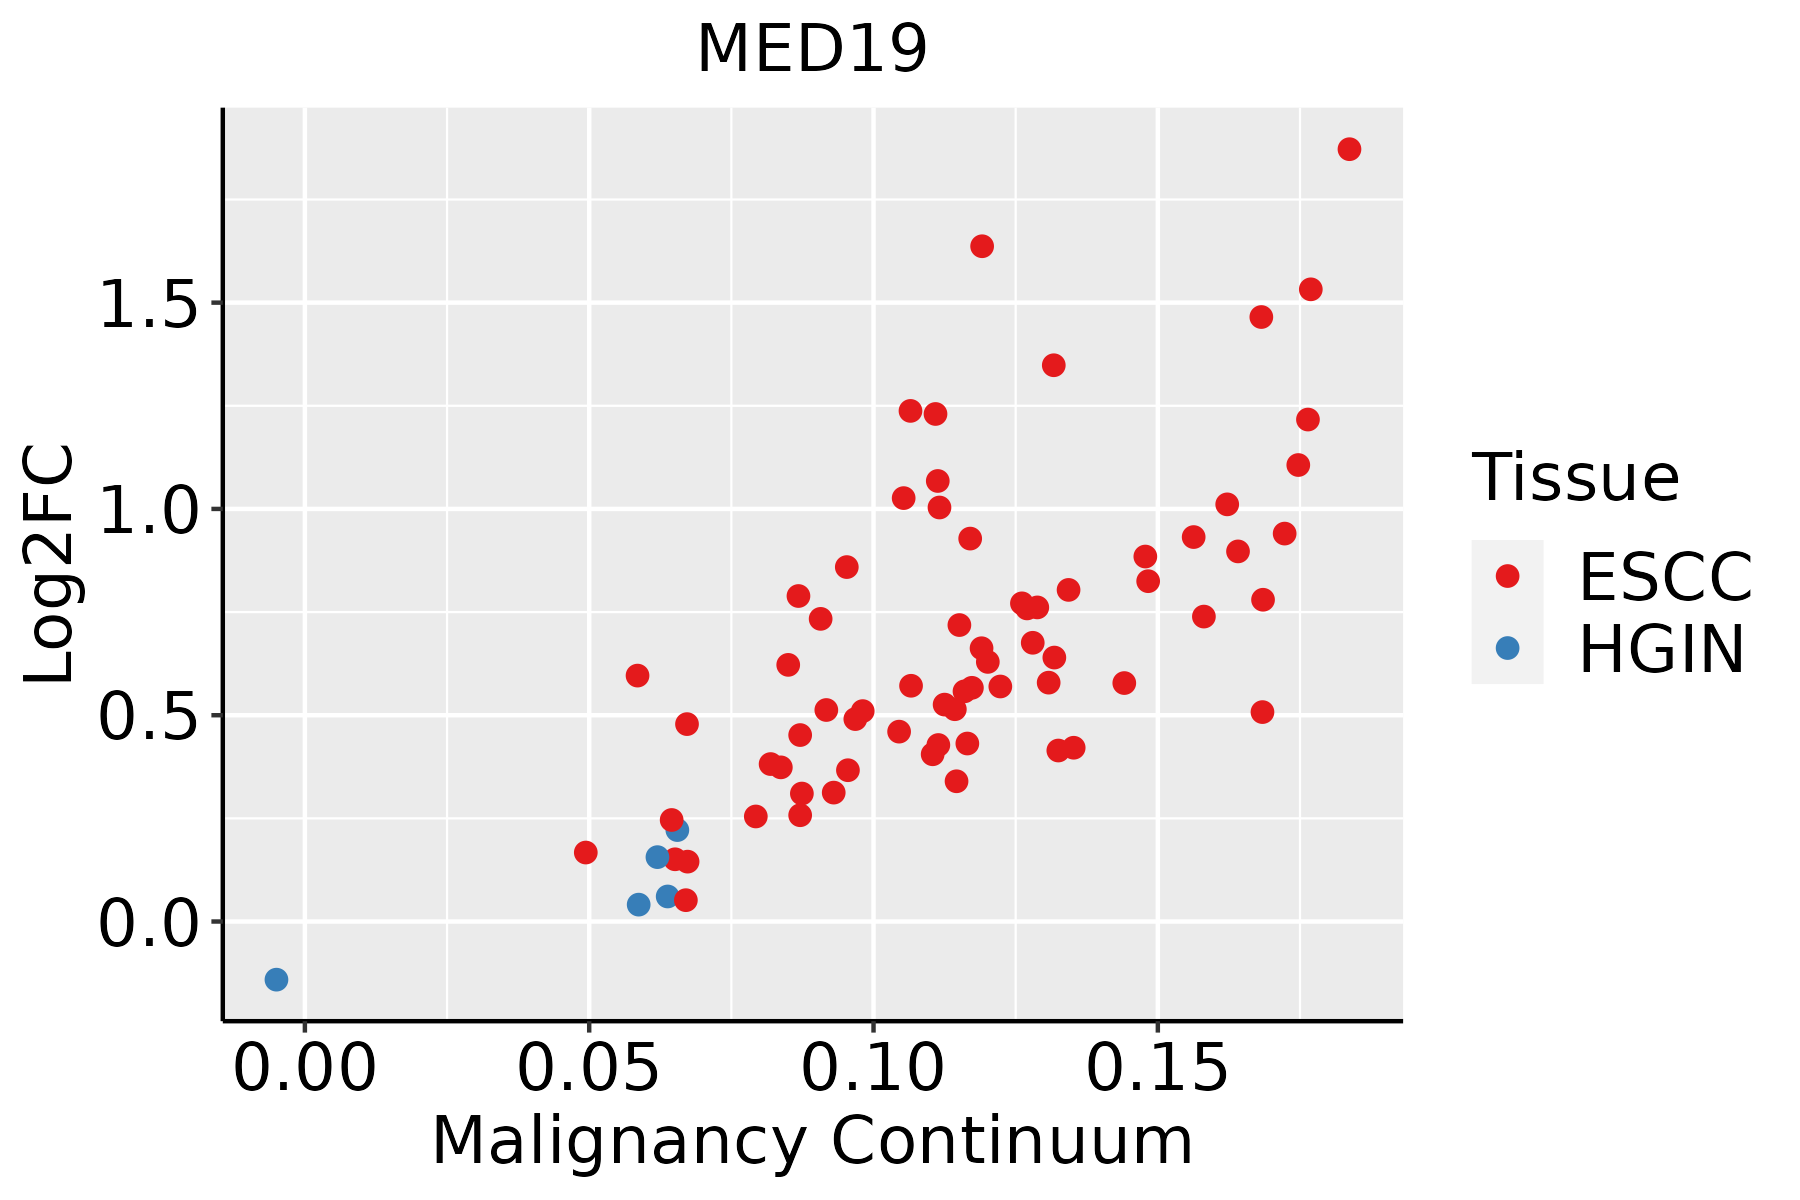 | ESCC: Esophageal squamous cell carcinoma |
| HGIN: High-grade intraepithelial neoplasias | ||
| LGIN: Low-grade intraepithelial neoplasias | ||
| Liver | 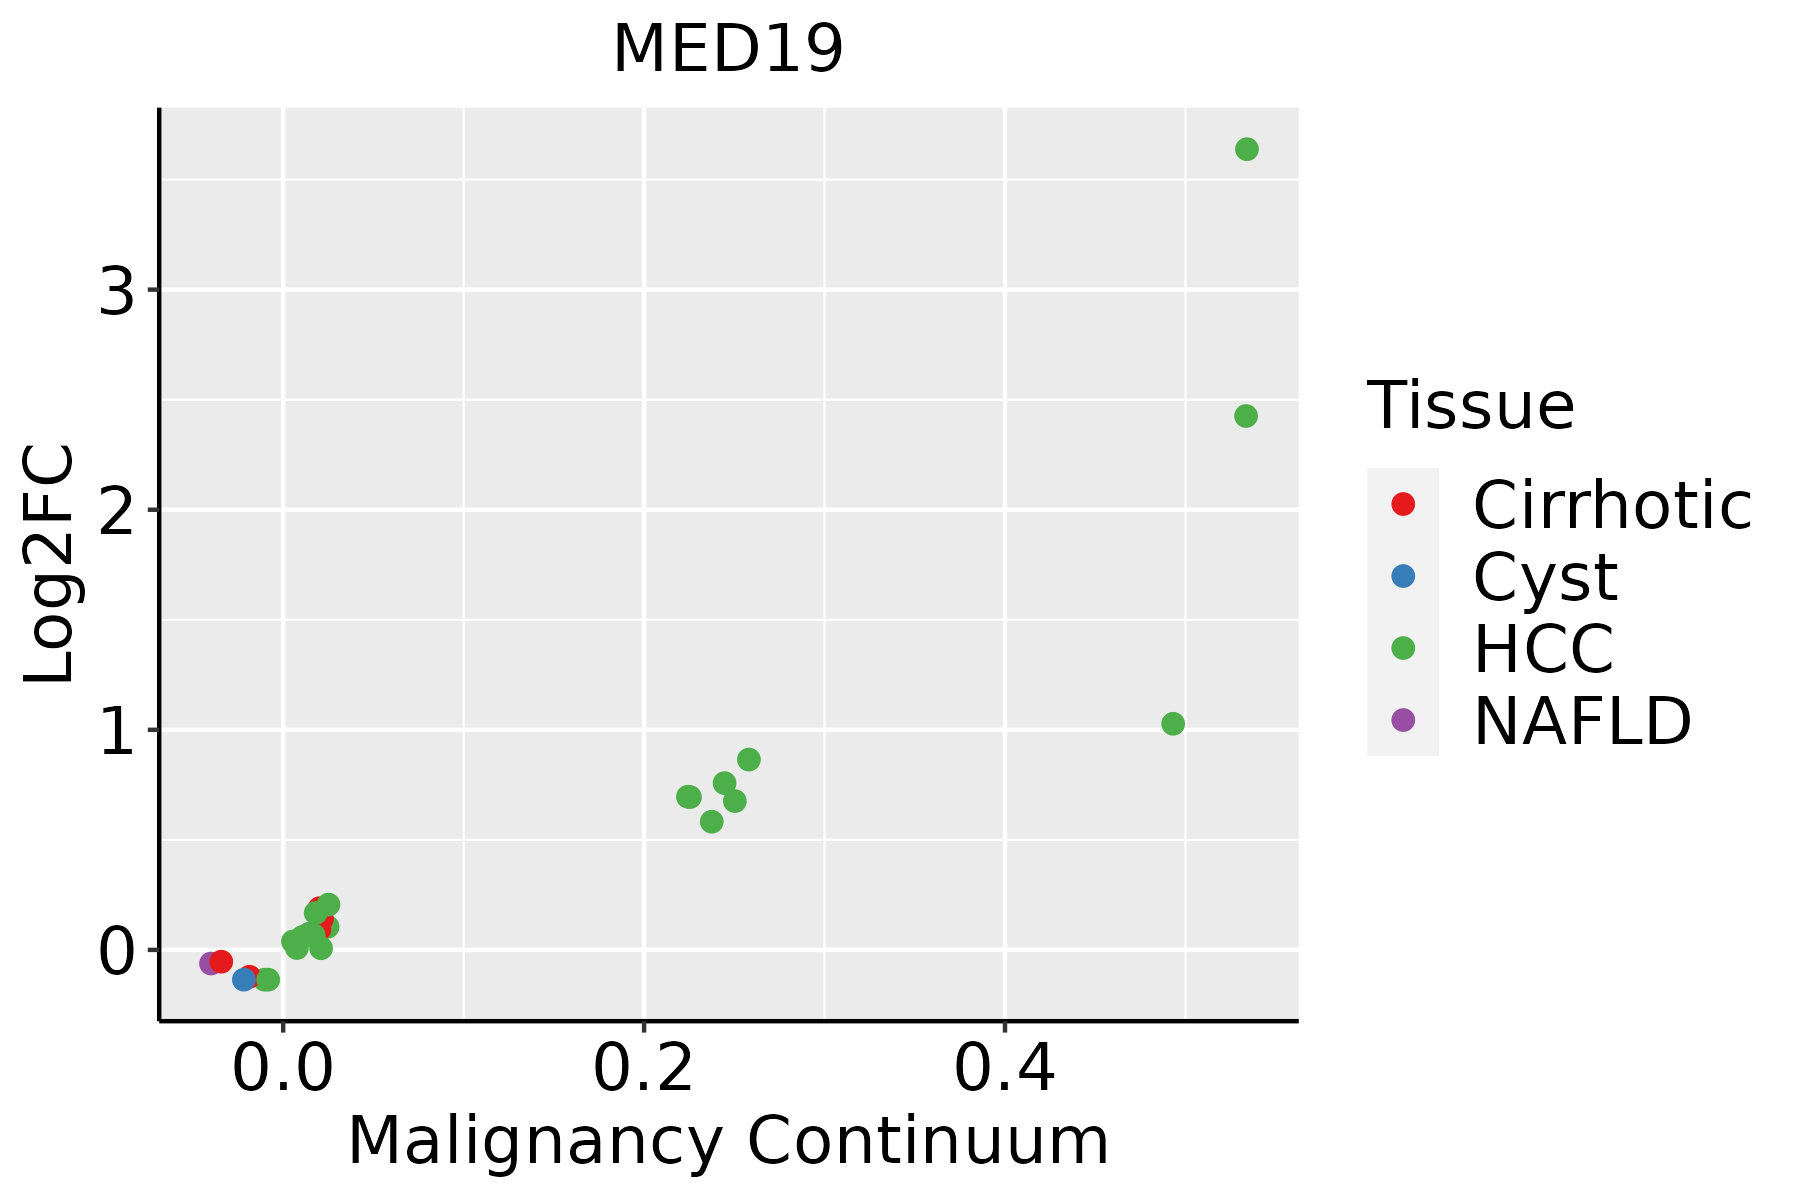 | HCC: Hepatocellular carcinoma |
| NAFLD: Non-alcoholic fatty liver disease | ||
| Oral Cavity | 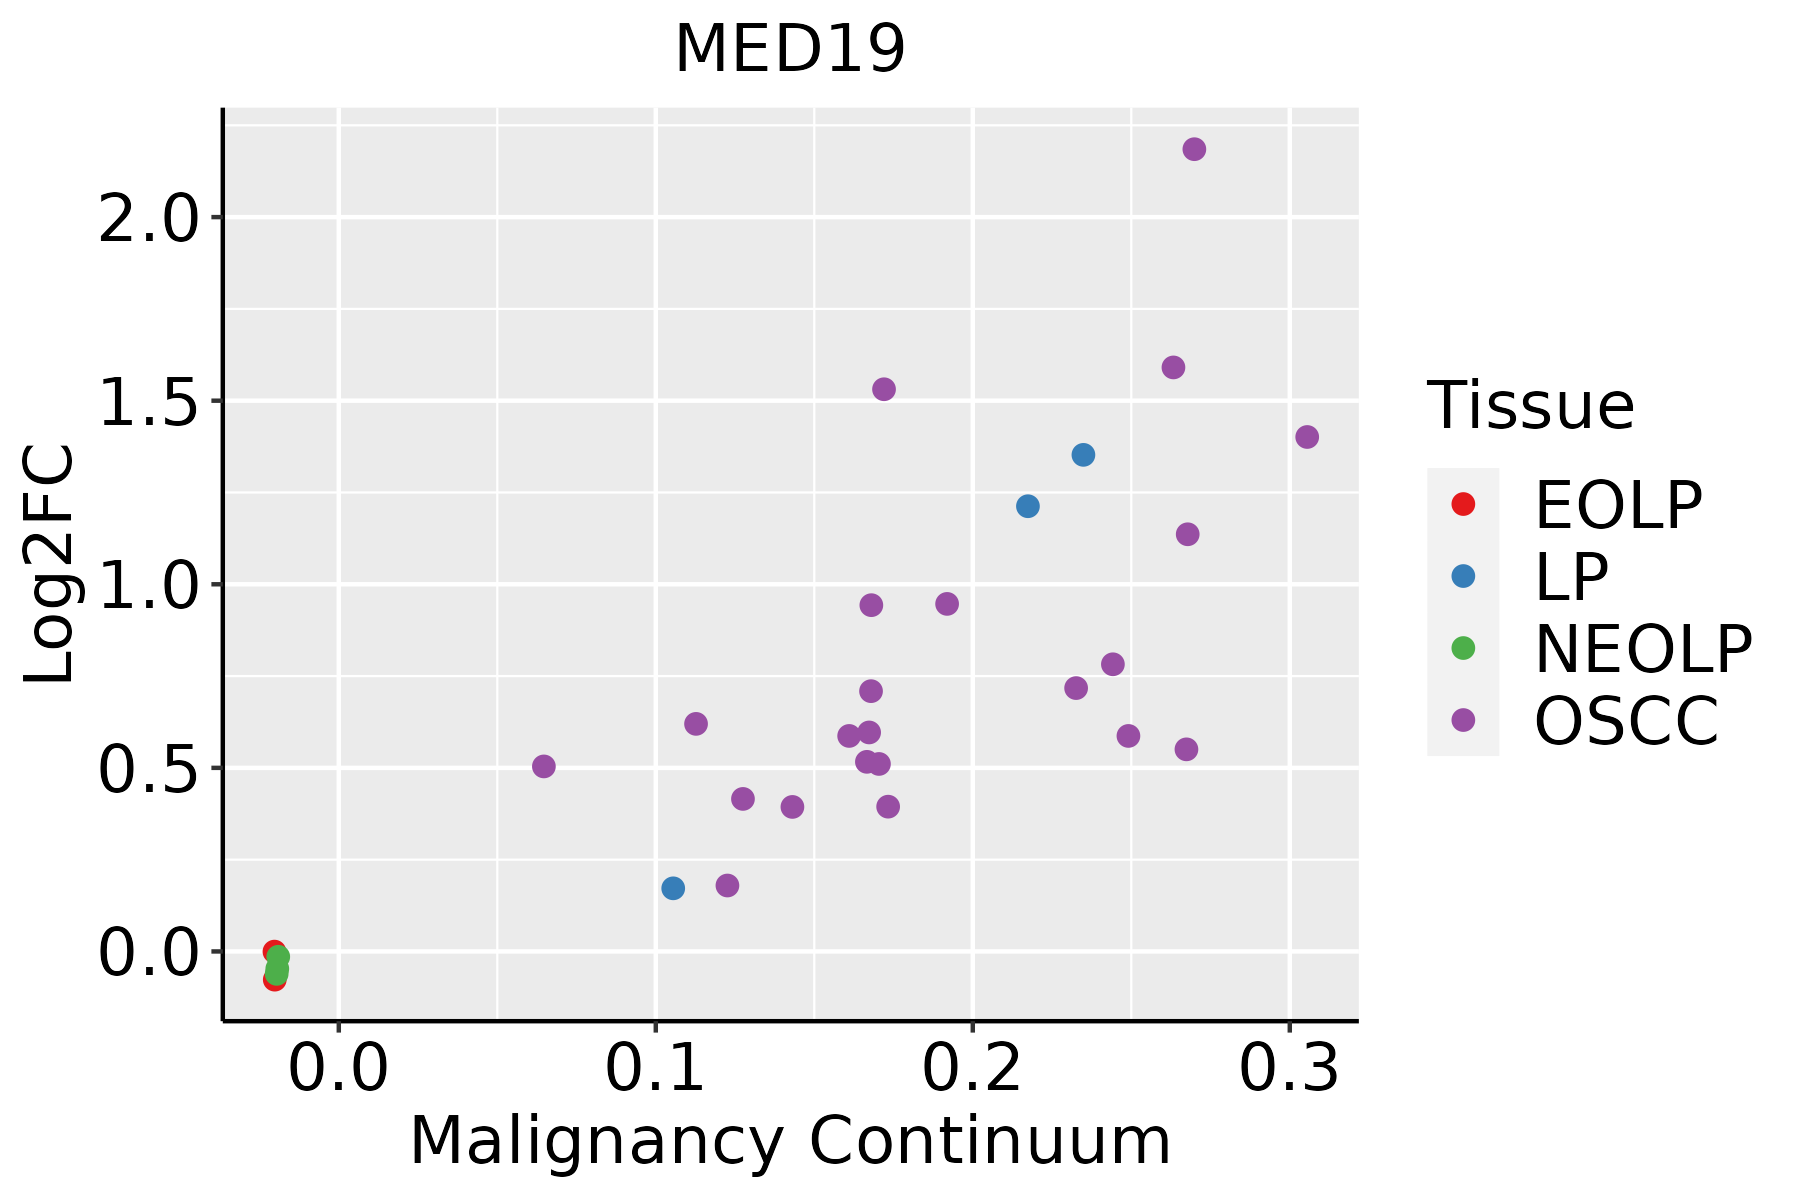 | EOLP: Erosive Oral lichen planus |
| LP: leukoplakia | ||
| NEOLP: Non-erosive oral lichen planus | ||
| OSCC: Oral squamous cell carcinoma | ||
| Skin | 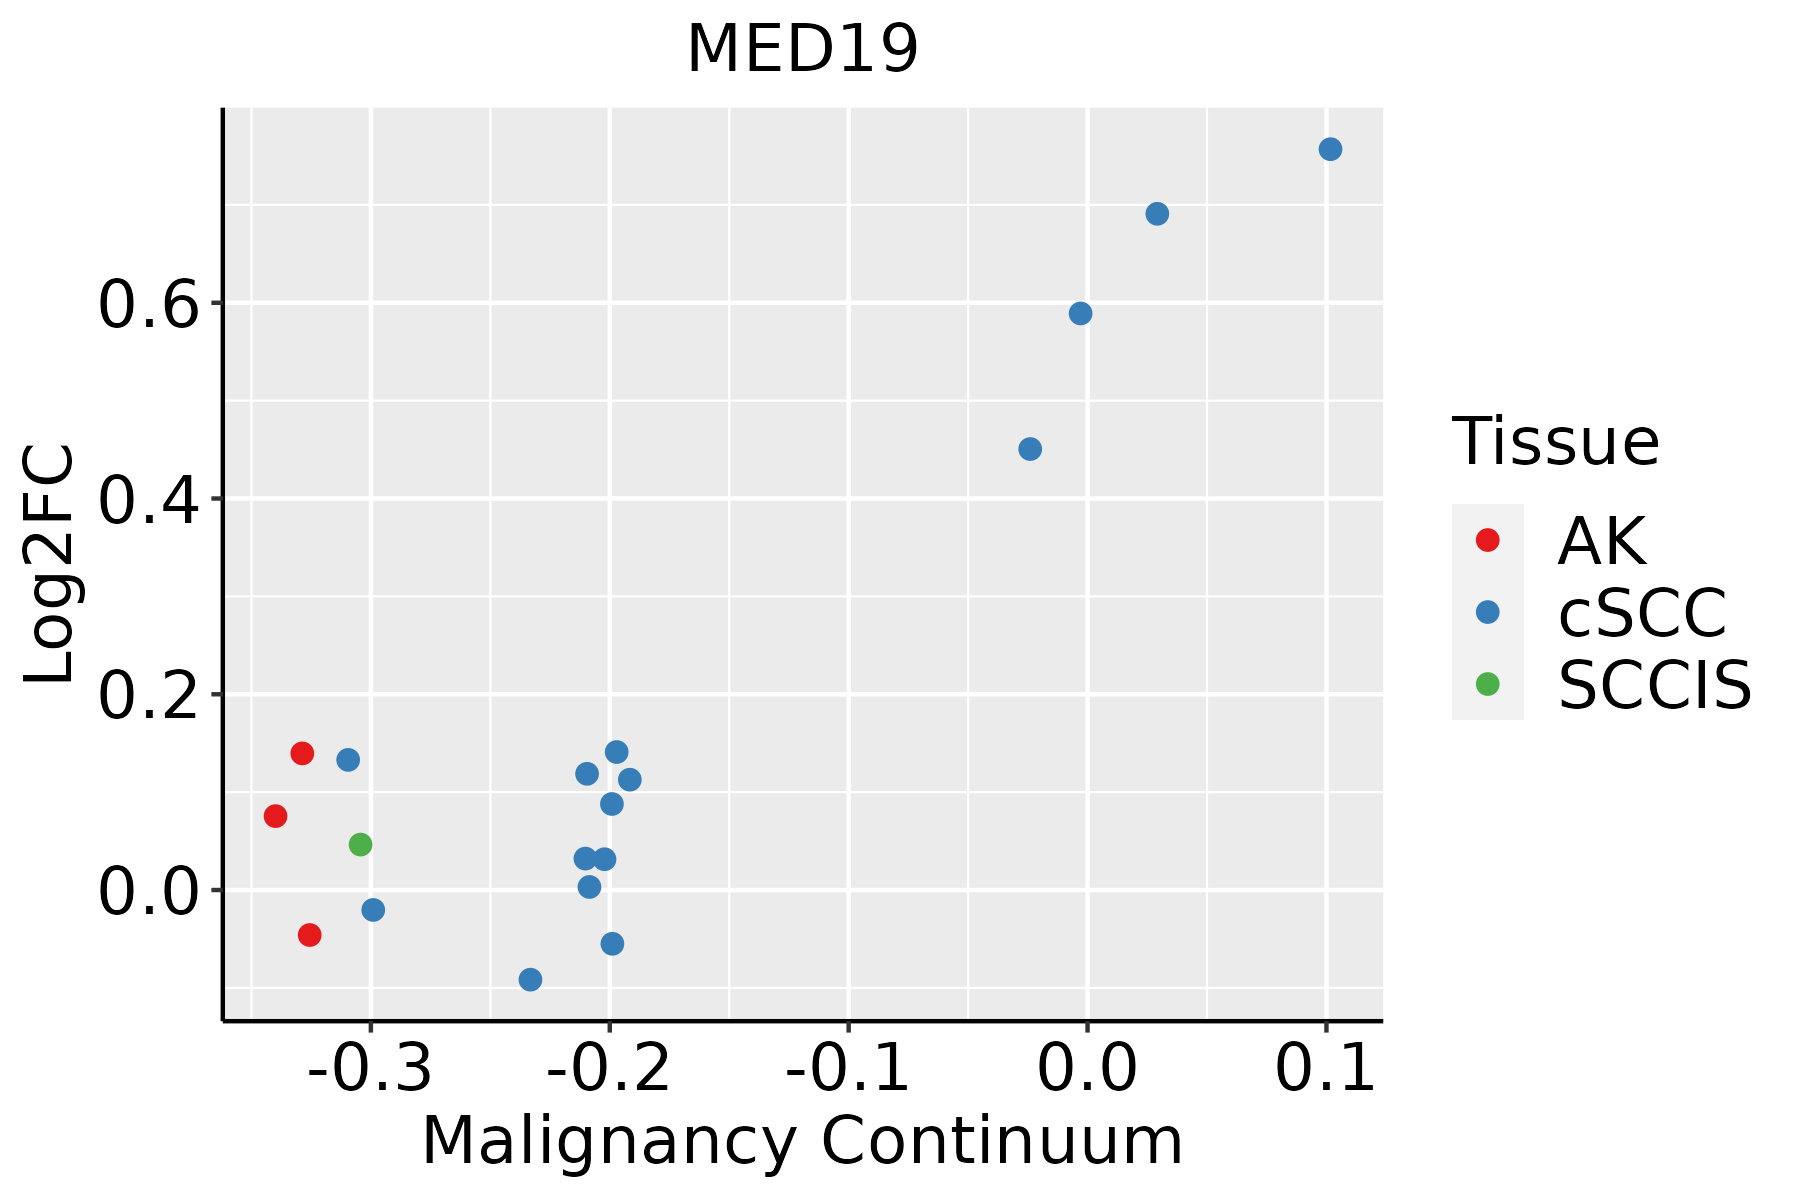 | AK: Actinic keratosis |
| cSCC: Cutaneous squamous cell carcinoma | ||
| SCCIS:squamous cell carcinoma in situ | ||
| Thyroid | 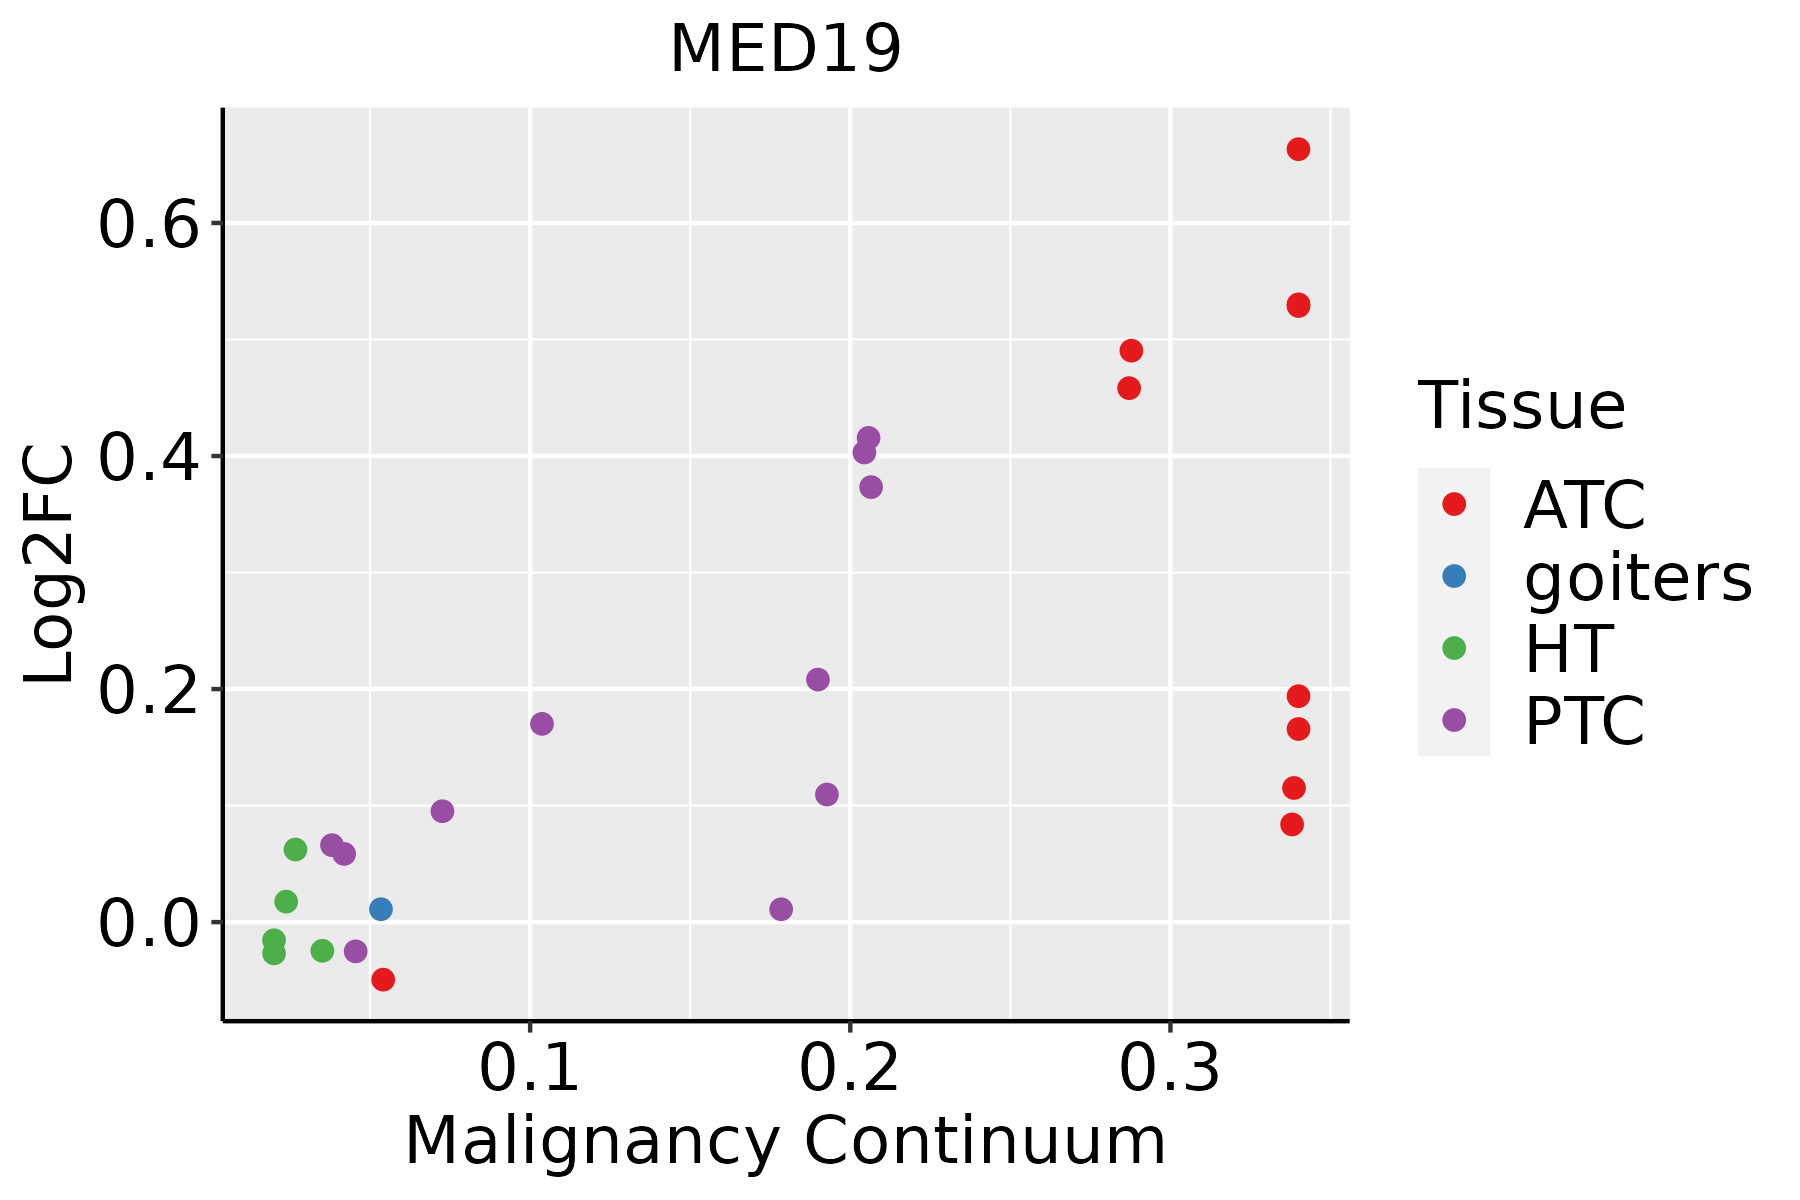 | ATC: Anaplastic thyroid cancer |
| HT: Hashimoto's thyroiditis | ||
| PTC: Papillary thyroid cancer |
| ∗log2FC in expression of this searched gene in stem-like cells from each diseased tissue sample relative to stem-like cells in normal samples in each tissue plotted against the malignancy continuum. Samples are colored based on if they are from different disease stage. |
Top |
Malignant transformation related pathway analysis |
| Find out the enriched GO biological processes and KEGG pathways involved in transition from healthy to precancer to cancer |
| Tissue | Disease Stage | Enriched GO biological Processes |
| Colorectum | AD |  |
| Colorectum | SER |  |
| Colorectum | MSS |  |
| Colorectum | MSI-H |  |
| Colorectum | FAP |  |
| ∗Top 15 enriched GO BP terms are showed in the bar plot of each disease state in each tissue. Each row represents a significant GO biological process which is colored according to the -log10(p.adjust). |
| Page: 1 2 3 4 5 6 7 8 9 |
| GO ID | Tissue | Disease Stage | Description | Gene Ratio | Bg Ratio | pvalue | p.adjust | Count |
| Page: 1 |
| Pathway ID | Tissue | Disease Stage | Description | Gene Ratio | Bg Ratio | pvalue | p.adjust | qvalue | Count |
| Page: 1 |
Top |
Cell-cell communication analysis |
| Identification of potential cell-cell interactions between two cell types and their ligand-receptor pairs for different disease states |
| Ligand | Receptor | LRpair | Pathway | Tissue | Disease Stage |
| Page: 1 |
Top |
Single-cell gene regulatory network inference analysis |
| Find out the significant the regulons (TFs) and the target genes of each regulon across cell types for different disease states |
| TF | Cell Type | Tissue | Disease Stage | Target Gene | RSS | Regulon Activity |
| ∗The dot plots of a searched regulon are shown for all cell subpopulations in each disease state of each tissue based on the regulon specific score inferred using pySCENIC and by calculating the average expression. |
| Page: 1 |
Top |
Somatic mutation of malignant transformation related genes |
| Annotation of somatic variants for genes involved in malignant transformation |
| Hugo Symbol | Variant Class | Variant Classification | dbSNP RS | HGVSc | HGVSp | HGVSp Short | SWISSPROT | BIOTYPE | SIFT | PolyPhen | Tumor Sample Barcode | Tissue | Histology | Sex | Age | Stage | Therapy Types | Drugs | Outcome |
| MED19 | insertion | Frame_Shift_Ins | novel | c.503dupG | p.Phe169LeufsTer25 | p.F169Lfs*25 | protein_coding | TCGA-E9-A227-01 | Breast | breast invasive carcinoma | Female | <65 | I/II | Chemotherapy | taxotere | CR | |||
| MED19 | SNV | Missense_Mutation | novel | c.346A>G | p.Lys116Glu | p.K116E | protein_coding | deleterious(0.04) | probably_damaging(0.999) | TCGA-EA-A410-01 | Cervix | cervical & endocervical cancer | Female | <65 | I/II | Unknown | Unknown | SD | |
| MED19 | SNV | Missense_Mutation | novel | c.599N>T | p.Arg200Leu | p.R200L | protein_coding | deleterious(0.03) | probably_damaging(0.983) | TCGA-AG-A014-01 | Colorectum | rectum adenocarcinoma | Male | >=65 | I/II | Unknown | Unknown | SD | |
| MED19 | SNV | Missense_Mutation | c.530N>A | p.Pro177Gln | p.P177Q | protein_coding | deleterious(0.01) | probably_damaging(0.911) | TCGA-AP-A056-01 | Endometrium | uterine corpus endometrioid carcinoma | Female | <65 | I/II | Unknown | Unknown | SD | ||
| MED19 | SNV | Missense_Mutation | novel | c.682N>T | p.Arg228Trp | p.R228W | protein_coding | deleterious(0) | probably_damaging(0.975) | TCGA-AP-A059-01 | Endometrium | uterine corpus endometrioid carcinoma | Female | >=65 | I/II | Unknown | Unknown | SD | |
| MED19 | SNV | Missense_Mutation | novel | c.541N>T | p.Arg181Cys | p.R181C | protein_coding | deleterious(0) | probably_damaging(0.961) | TCGA-AP-A1DV-01 | Endometrium | uterine corpus endometrioid carcinoma | Female | <65 | I/II | Unknown | Unknown | SD | |
| MED19 | SNV | Missense_Mutation | c.529N>T | p.Pro177Ser | p.P177S | protein_coding | deleterious(0.02) | benign(0.3) | TCGA-AP-A1E0-01 | Endometrium | uterine corpus endometrioid carcinoma | Female | <65 | III/IV | Chemotherapy | paclitaxel | SD | ||
| MED19 | SNV | Missense_Mutation | novel | c.339N>A | p.Phe113Leu | p.F113L | protein_coding | deleterious(0.04) | possibly_damaging(0.833) | TCGA-AX-A2HC-01 | Endometrium | uterine corpus endometrioid carcinoma | Female | <65 | III/IV | Chemotherapy | paclitaxel | PD | |
| MED19 | SNV | Missense_Mutation | novel | c.726N>G | p.His242Gln | p.H242Q | protein_coding | deleterious_low_confidence(0) | probably_damaging(0.991) | TCGA-EO-A22R-01 | Endometrium | uterine corpus endometrioid carcinoma | Female | <65 | I/II | Unknown | Unknown | SD | |
| MED19 | SNV | Missense_Mutation | rs773968041 | c.434N>A | p.Arg145His | p.R145H | protein_coding | deleterious(0) | possibly_damaging(0.479) | TCGA-EY-A1G8-01 | Endometrium | uterine corpus endometrioid carcinoma | Female | >=65 | I/II | Unknown | Unknown | SD |
| Page: 1 2 |
Top |
Related drugs of malignant transformation related genes |
| Identification of chemicals and drugs interact with genes involved in malignant transfromation |
| (DGIdb 4.0) |
| Entrez ID | Symbol | Category | Interaction Types | Drug Claim Name | Drug Name | PMIDs |
| 219541 | MED19 | TRANSCRIPTION FACTOR BINDING, TRANSCRIPTION FACTOR | ethanol | ALCOHOL | 32451486 |
| Page: 1 |

Copyright 2023-Present -The University of Texas Health Science Center at Houston |