
|
|||||
|
 | |
| |
| |
| |
| |
| |
|
Gene: MED17 |
Gene summary for MED17 |
| Gene information | Species | Human | Gene symbol | MED17 | Gene ID | 9440 |
| Gene name | mediator complex subunit 17 | |
| Gene Alias | CRSP6 | |
| Cytomap | 11q21 | |
| Gene Type | protein-coding | GO ID | GO:0006139 | UniProtAcc | Q9NVC6 |
Top |
Malignant transformation analysis |
| Identification of the aberrant gene expression in precancerous and cancerous lesions by comparing the gene expression of stem-like cells in diseased tissues with normal stem cells |
| Entrez ID | Symbol | Replicates | Species | Organ | Tissue | Adj P-value | Log2FC | Malignancy |
| 9440 | MED17 | HTA11_3410_2000001011 | Human | Colorectum | AD | 4.20e-02 | 1.14e-01 | 0.0155 |
| 9440 | MED17 | HTA11_2487_2000001011 | Human | Colorectum | SER | 3.61e-02 | 1.49e-01 | -0.1808 |
| 9440 | MED17 | HTA11_1938_2000001011 | Human | Colorectum | AD | 6.93e-06 | 2.39e-01 | -0.0811 |
| 9440 | MED17 | HTA11_78_2000001011 | Human | Colorectum | AD | 4.09e-04 | 1.94e-01 | -0.1088 |
| 9440 | MED17 | HTA11_347_2000001011 | Human | Colorectum | AD | 2.73e-15 | 3.40e-01 | -0.1954 |
| 9440 | MED17 | HTA11_2112_2000001011 | Human | Colorectum | SER | 1.12e-03 | 4.20e-01 | -0.2196 |
| 9440 | MED17 | HTA11_696_2000001011 | Human | Colorectum | AD | 4.25e-05 | 1.54e-01 | -0.1464 |
| 9440 | MED17 | HTA11_866_2000001011 | Human | Colorectum | AD | 9.11e-04 | 1.48e-01 | -0.1001 |
| 9440 | MED17 | HTA11_1391_2000001011 | Human | Colorectum | AD | 4.26e-12 | 3.33e-01 | -0.059 |
| 9440 | MED17 | HTA11_546_2000001011 | Human | Colorectum | AD | 4.48e-05 | 2.41e-01 | -0.0842 |
| 9440 | MED17 | HTA11_7862_2000001011 | Human | Colorectum | AD | 3.00e-02 | 2.12e-01 | -0.0179 |
| 9440 | MED17 | HTA11_866_3004761011 | Human | Colorectum | AD | 5.32e-06 | 1.84e-01 | 0.096 |
| 9440 | MED17 | HTA11_7696_3000711011 | Human | Colorectum | AD | 5.85e-06 | 1.73e-01 | 0.0674 |
| 9440 | MED17 | HTA11_6818_2000001021 | Human | Colorectum | AD | 7.70e-07 | 2.73e-01 | 0.0588 |
| 9440 | MED17 | HTA11_99999970781_79442 | Human | Colorectum | MSS | 2.03e-09 | 2.50e-01 | 0.294 |
| 9440 | MED17 | HTA11_99999965062_69753 | Human | Colorectum | MSI-H | 1.88e-06 | 7.18e-01 | 0.3487 |
| 9440 | MED17 | HTA11_99999965104_69814 | Human | Colorectum | MSS | 4.44e-08 | 2.84e-01 | 0.281 |
| 9440 | MED17 | HTA11_99999971662_82457 | Human | Colorectum | MSS | 1.39e-13 | 2.86e-01 | 0.3859 |
| 9440 | MED17 | LZE4T | Human | Esophagus | ESCC | 6.40e-04 | 7.27e-03 | 0.0811 |
| 9440 | MED17 | LZE7T | Human | Esophagus | ESCC | 2.45e-09 | 1.76e-01 | 0.0667 |
| Page: 1 2 3 4 5 |
| Tissue | Expression Dynamics | Abbreviation |
| Colorectum (GSE201348) |  | FAP: Familial adenomatous polyposis |
| CRC: Colorectal cancer | ||
| Colorectum (HTA11) |  | AD: Adenomas |
| SER: Sessile serrated lesions | ||
| MSI-H: Microsatellite-high colorectal cancer | ||
| MSS: Microsatellite stable colorectal cancer | ||
| Esophagus | 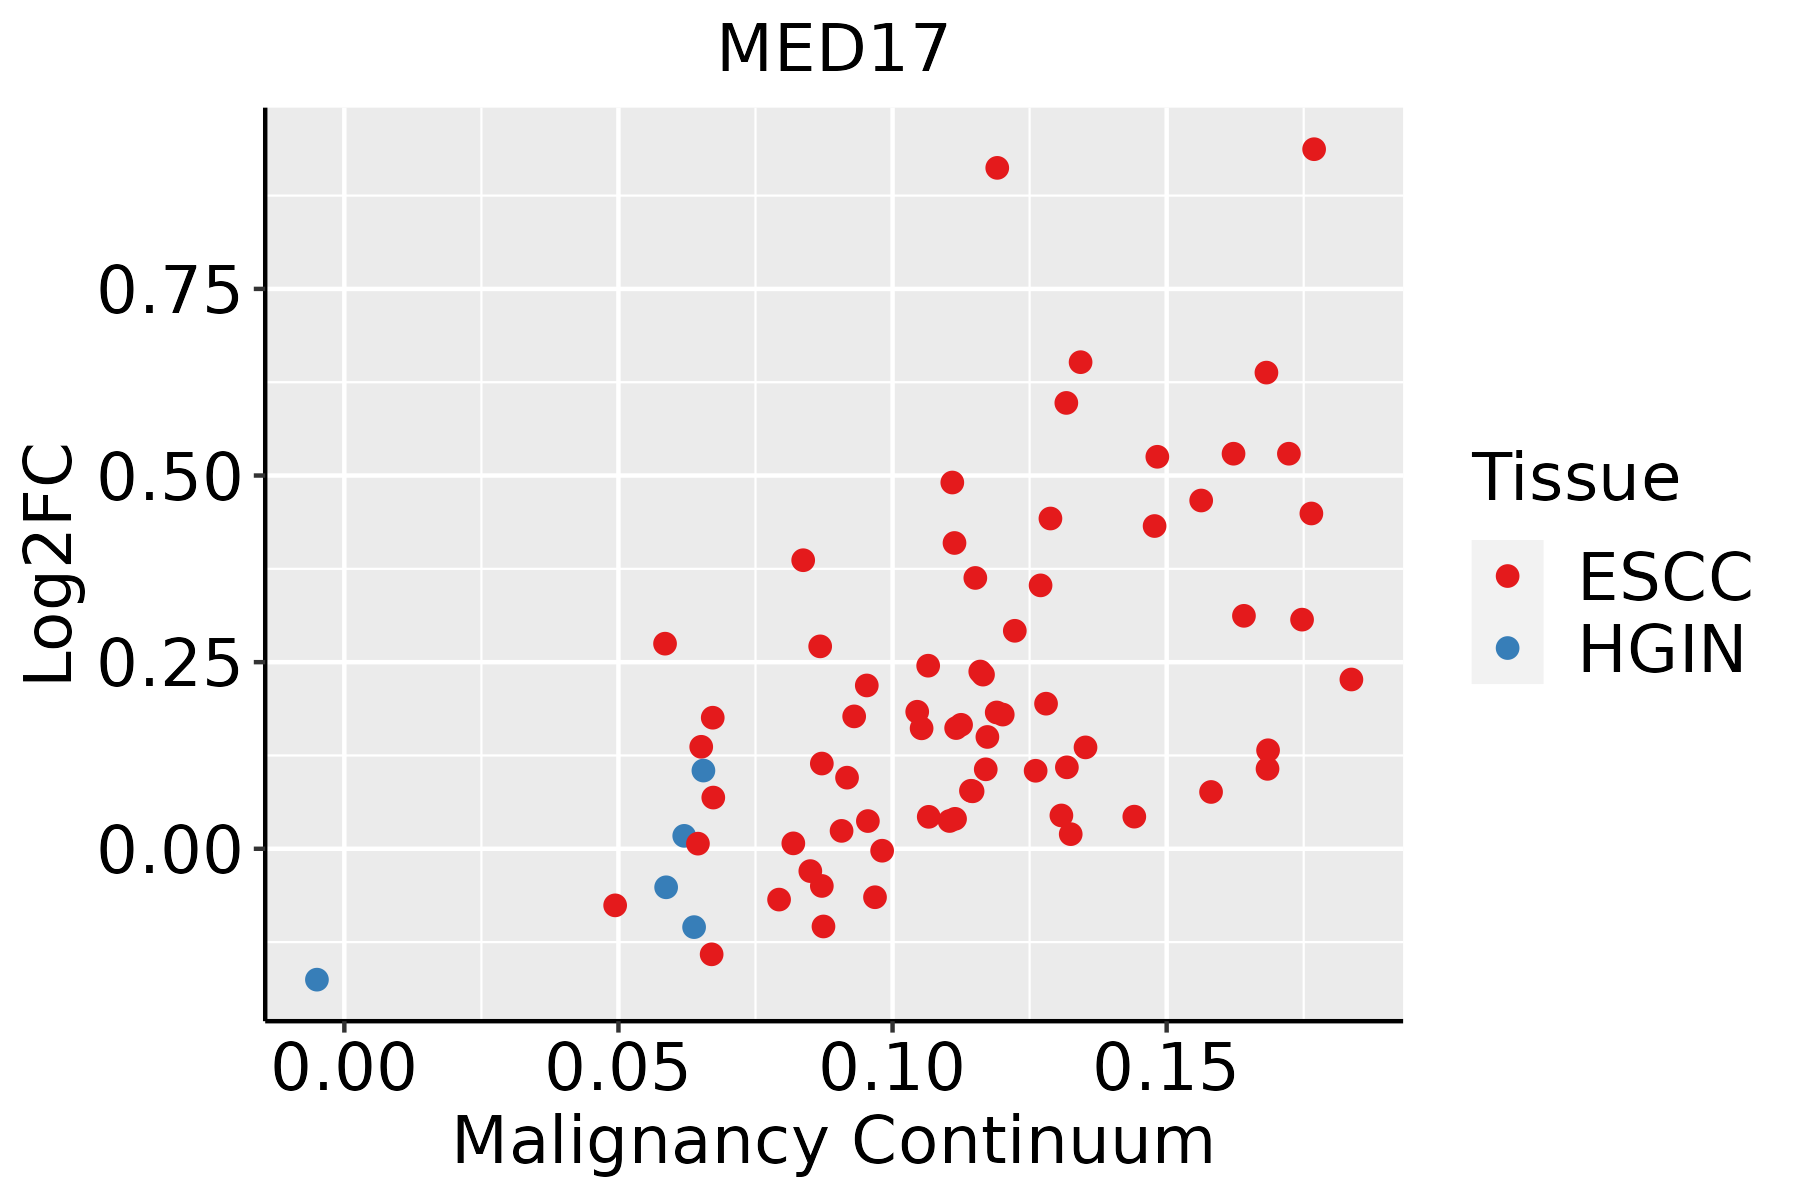 | ESCC: Esophageal squamous cell carcinoma |
| HGIN: High-grade intraepithelial neoplasias | ||
| LGIN: Low-grade intraepithelial neoplasias | ||
| Oral Cavity |  | EOLP: Erosive Oral lichen planus |
| LP: leukoplakia | ||
| NEOLP: Non-erosive oral lichen planus | ||
| OSCC: Oral squamous cell carcinoma | ||
| Skin | 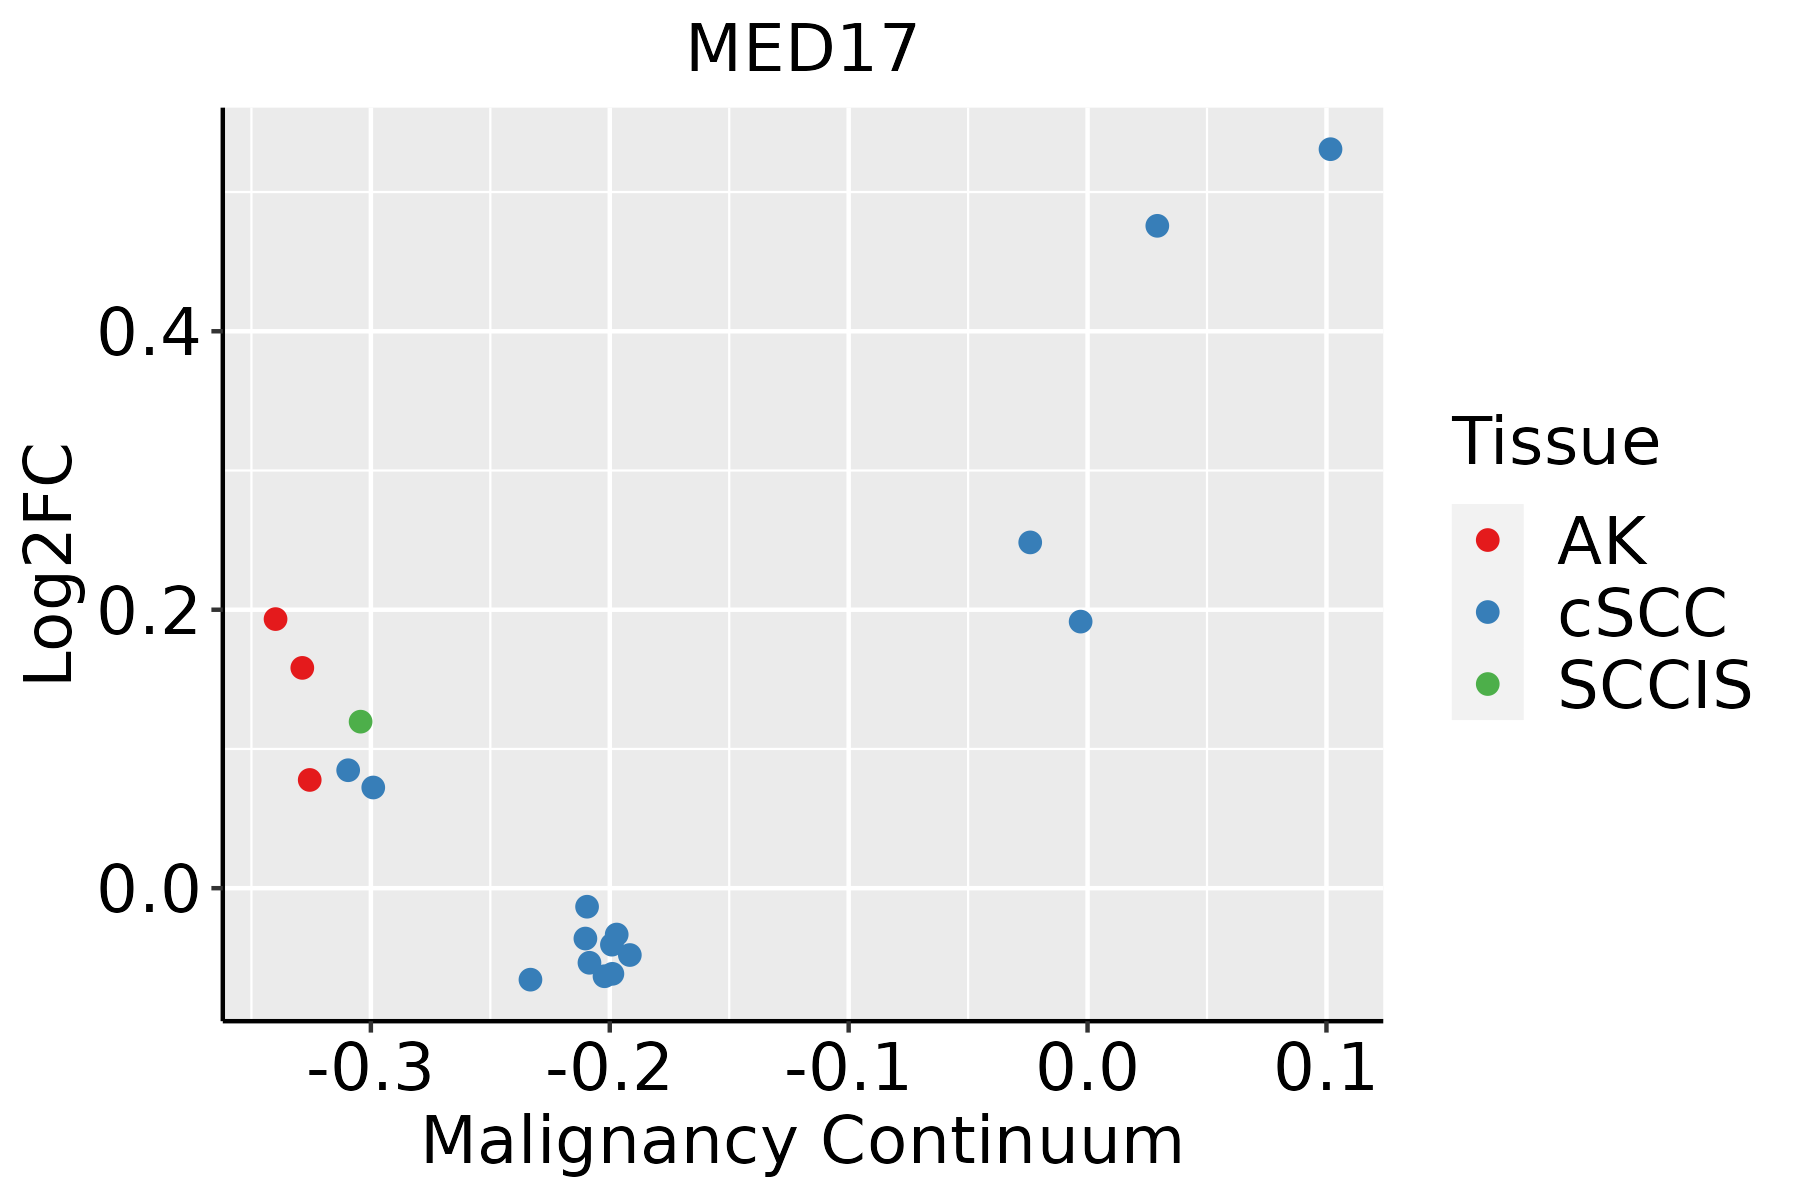 | AK: Actinic keratosis |
| cSCC: Cutaneous squamous cell carcinoma | ||
| SCCIS:squamous cell carcinoma in situ |
| ∗log2FC in expression of this searched gene in stem-like cells from each diseased tissue sample relative to stem-like cells in normal samples in each tissue plotted against the malignancy continuum. Samples are colored based on if they are from different disease stage. |
Top |
Malignant transformation related pathway analysis |
| Find out the enriched GO biological processes and KEGG pathways involved in transition from healthy to precancer to cancer |
| Tissue | Disease Stage | Enriched GO biological Processes |
| Colorectum | AD |  |
| Colorectum | SER |  |
| Colorectum | MSS |  |
| Colorectum | MSI-H |  |
| Colorectum | FAP |  |
| ∗Top 15 enriched GO BP terms are showed in the bar plot of each disease state in each tissue. Each row represents a significant GO biological process which is colored according to the -log10(p.adjust). |
| Page: 1 2 3 4 5 6 7 8 9 |
| GO ID | Tissue | Disease Stage | Description | Gene Ratio | Bg Ratio | pvalue | p.adjust | Count |
| GO:00063673 | Esophagus | ESCC | transcription initiation from RNA polymerase II promoter | 56/8552 | 77/18723 | 1.30e-06 | 1.59e-05 | 56 |
| GO:000635211 | Esophagus | ESCC | DNA-templated transcription, initiation | 86/8552 | 130/18723 | 1.88e-06 | 2.19e-05 | 86 |
| GO:00602603 | Esophagus | ESCC | regulation of transcription initiation from RNA polymerase II promoter | 25/8552 | 33/18723 | 4.30e-04 | 2.43e-03 | 25 |
| GO:200014212 | Esophagus | ESCC | regulation of DNA-templated transcription, initiation | 29/8552 | 40/18723 | 5.32e-04 | 2.93e-03 | 29 |
| GO:20001443 | Esophagus | ESCC | positive regulation of DNA-templated transcription, initiation | 21/8552 | 31/18723 | 1.10e-02 | 3.70e-02 | 21 |
| GO:00063522 | Oral cavity | OSCC | DNA-templated transcription, initiation | 74/7305 | 130/18723 | 2.56e-05 | 2.39e-04 | 74 |
| GO:00063672 | Oral cavity | OSCC | transcription initiation from RNA polymerase II promoter | 46/7305 | 77/18723 | 1.82e-04 | 1.24e-03 | 46 |
| GO:20001423 | Oral cavity | OSCC | regulation of DNA-templated transcription, initiation | 26/7305 | 40/18723 | 7.79e-04 | 4.23e-03 | 26 |
| GO:20001442 | Oral cavity | OSCC | positive regulation of DNA-templated transcription, initiation | 21/7305 | 31/18723 | 1.13e-03 | 5.75e-03 | 21 |
| GO:00602602 | Oral cavity | OSCC | regulation of transcription initiation from RNA polymerase II promoter | 21/7305 | 33/18723 | 3.63e-03 | 1.51e-02 | 21 |
| GO:00602611 | Oral cavity | OSCC | positive regulation of transcription initiation from RNA polymerase II promoter | 16/7305 | 25/18723 | 1.00e-02 | 3.49e-02 | 16 |
| GO:000636711 | Oral cavity | LP | transcription initiation from RNA polymerase II promoter | 31/4623 | 77/18723 | 1.83e-03 | 1.38e-02 | 31 |
| GO:20001441 | Oral cavity | LP | positive regulation of DNA-templated transcription, initiation | 15/4623 | 31/18723 | 3.59e-03 | 2.39e-02 | 15 |
| GO:200014211 | Oral cavity | LP | regulation of DNA-templated transcription, initiation | 18/4623 | 40/18723 | 4.00e-03 | 2.59e-02 | 18 |
| GO:00063521 | Oral cavity | LP | DNA-templated transcription, initiation | 45/4623 | 130/18723 | 7.03e-03 | 3.96e-02 | 45 |
| GO:006026011 | Oral cavity | LP | regulation of transcription initiation from RNA polymerase II promoter | 15/4623 | 33/18723 | 7.43e-03 | 4.13e-02 | 15 |
| GO:20001422 | Oral cavity | EOLP | regulation of DNA-templated transcription, initiation | 11/2218 | 40/18723 | 5.53e-03 | 2.86e-02 | 11 |
| GO:000635212 | Skin | cSCC | DNA-templated transcription, initiation | 57/4864 | 130/18723 | 7.28e-06 | 1.01e-04 | 57 |
| GO:00063674 | Skin | cSCC | transcription initiation from RNA polymerase II promoter | 37/4864 | 77/18723 | 2.53e-05 | 2.87e-04 | 37 |
| GO:20001425 | Skin | cSCC | regulation of DNA-templated transcription, initiation | 18/4864 | 40/18723 | 7.10e-03 | 3.40e-02 | 18 |
| Page: 1 |
| Pathway ID | Tissue | Disease Stage | Description | Gene Ratio | Bg Ratio | pvalue | p.adjust | qvalue | Count |
| hsa04919 | Colorectum | AD | Thyroid hormone signaling pathway | 51/2092 | 121/8465 | 1.71e-05 | 1.73e-04 | 1.10e-04 | 51 |
| hsa049191 | Colorectum | AD | Thyroid hormone signaling pathway | 51/2092 | 121/8465 | 1.71e-05 | 1.73e-04 | 1.10e-04 | 51 |
| hsa049192 | Colorectum | SER | Thyroid hormone signaling pathway | 40/1580 | 121/8465 | 1.02e-04 | 1.06e-03 | 7.67e-04 | 40 |
| hsa049193 | Colorectum | SER | Thyroid hormone signaling pathway | 40/1580 | 121/8465 | 1.02e-04 | 1.06e-03 | 7.67e-04 | 40 |
| hsa049194 | Colorectum | MSS | Thyroid hormone signaling pathway | 46/1875 | 121/8465 | 5.04e-05 | 4.97e-04 | 3.05e-04 | 46 |
| hsa049195 | Colorectum | MSS | Thyroid hormone signaling pathway | 46/1875 | 121/8465 | 5.04e-05 | 4.97e-04 | 3.05e-04 | 46 |
| hsa049196 | Colorectum | MSI-H | Thyroid hormone signaling pathway | 21/797 | 121/8465 | 4.18e-03 | 4.10e-02 | 3.44e-02 | 21 |
| hsa049197 | Colorectum | MSI-H | Thyroid hormone signaling pathway | 21/797 | 121/8465 | 4.18e-03 | 4.10e-02 | 3.44e-02 | 21 |
| hsa0491928 | Esophagus | ESCC | Thyroid hormone signaling pathway | 78/4205 | 121/8465 | 6.79e-04 | 2.23e-03 | 1.14e-03 | 78 |
| hsa04919113 | Esophagus | ESCC | Thyroid hormone signaling pathway | 78/4205 | 121/8465 | 6.79e-04 | 2.23e-03 | 1.14e-03 | 78 |
| hsa0491926 | Oral cavity | OSCC | Thyroid hormone signaling pathway | 73/3704 | 121/8465 | 1.63e-04 | 5.52e-04 | 2.81e-04 | 73 |
| hsa04919112 | Oral cavity | OSCC | Thyroid hormone signaling pathway | 73/3704 | 121/8465 | 1.63e-04 | 5.52e-04 | 2.81e-04 | 73 |
| hsa0491927 | Oral cavity | EOLP | Thyroid hormone signaling pathway | 32/1218 | 121/8465 | 3.38e-04 | 1.42e-03 | 8.35e-04 | 32 |
| hsa0491935 | Oral cavity | EOLP | Thyroid hormone signaling pathway | 32/1218 | 121/8465 | 3.38e-04 | 1.42e-03 | 8.35e-04 | 32 |
| Page: 1 |
Top |
Cell-cell communication analysis |
| Identification of potential cell-cell interactions between two cell types and their ligand-receptor pairs for different disease states |
| Ligand | Receptor | LRpair | Pathway | Tissue | Disease Stage |
| Page: 1 |
Top |
Single-cell gene regulatory network inference analysis |
| Find out the significant the regulons (TFs) and the target genes of each regulon across cell types for different disease states |
| TF | Cell Type | Tissue | Disease Stage | Target Gene | RSS | Regulon Activity |
| ∗The dot plots of a searched regulon are shown for all cell subpopulations in each disease state of each tissue based on the regulon specific score inferred using pySCENIC and by calculating the average expression. |
| Page: 1 |
Top |
Somatic mutation of malignant transformation related genes |
| Annotation of somatic variants for genes involved in malignant transformation |
| Hugo Symbol | Variant Class | Variant Classification | dbSNP RS | HGVSc | HGVSp | HGVSp Short | SWISSPROT | BIOTYPE | SIFT | PolyPhen | Tumor Sample Barcode | Tissue | Histology | Sex | Age | Stage | Therapy Types | Drugs | Outcome |
| MED17 | SNV | Missense_Mutation | novel | c.191N>C | p.Glu64Ala | p.E64A | Q9NVC6 | protein_coding | tolerated(0.09) | benign(0.052) | TCGA-2W-A8YY-01 | Cervix | cervical & endocervical cancer | Female | <65 | I/II | Chemotherapy | cisplatin | CR |
| MED17 | SNV | Missense_Mutation | rs150314692 | c.566N>A | p.Arg189Gln | p.R189Q | Q9NVC6 | protein_coding | tolerated(0.07) | possibly_damaging(0.617) | TCGA-BI-A0VS-01 | Cervix | cervical & endocervical cancer | Female | <65 | I/II | Unknown | Unknown | SD |
| MED17 | SNV | Missense_Mutation | novel | c.457C>G | p.Leu153Val | p.L153V | Q9NVC6 | protein_coding | deleterious(0) | probably_damaging(0.934) | TCGA-C5-A1M7-01 | Cervix | cervical & endocervical cancer | Female | <65 | I/II | Unknown | Unknown | SD |
| MED17 | SNV | Missense_Mutation | c.1070N>G | p.Phe357Cys | p.F357C | Q9NVC6 | protein_coding | tolerated(0.07) | benign(0.132) | TCGA-FU-A3HZ-01 | Cervix | cervical & endocervical cancer | Female | <65 | I/II | Chemotherapy | cisplatin | CR | |
| MED17 | SNV | Missense_Mutation | c.46N>A | p.Glu16Lys | p.E16K | Q9NVC6 | protein_coding | deleterious(0) | probably_damaging(0.999) | TCGA-Q1-A73O-01 | Cervix | cervical & endocervical cancer | Female | <65 | I/II | Chemotherapy | cisplatin | CR | |
| MED17 | SNV | Missense_Mutation | c.1550A>G | p.Gln517Arg | p.Q517R | Q9NVC6 | protein_coding | deleterious(0) | benign(0.444) | TCGA-AA-3710-01 | Colorectum | colon adenocarcinoma | Female | >=65 | I/II | Unknown | Unknown | SD | |
| MED17 | SNV | Missense_Mutation | novel | c.714A>T | p.Glu238Asp | p.E238D | Q9NVC6 | protein_coding | tolerated(0.47) | benign(0.001) | TCGA-AA-3842-01 | Colorectum | colon adenocarcinoma | Male | <65 | III/IV | Chemotherapy | folinic | PD |
| MED17 | SNV | Missense_Mutation | rs745485844 | c.1342A>G | p.Ile448Val | p.I448V | Q9NVC6 | protein_coding | deleterious(0.03) | possibly_damaging(0.813) | TCGA-AA-3947-01 | Colorectum | colon adenocarcinoma | Female | <65 | I/II | Unknown | Unknown | SD |
| MED17 | SNV | Missense_Mutation | c.610C>T | p.Leu204Phe | p.L204F | Q9NVC6 | protein_coding | deleterious(0.01) | probably_damaging(0.99) | TCGA-CA-6718-01 | Colorectum | colon adenocarcinoma | Male | <65 | I/II | Unknown | Unknown | PD | |
| MED17 | SNV | Missense_Mutation | novel | c.1925T>G | p.Leu642Arg | p.L642R | Q9NVC6 | protein_coding | deleterious(0) | probably_damaging(0.986) | TCGA-2E-A9G8-01 | Endometrium | uterine corpus endometrioid carcinoma | Female | <65 | III/IV | Chemotherapy | taxol | CR |
| Page: 1 2 3 4 5 6 7 |
Top |
Related drugs of malignant transformation related genes |
| Identification of chemicals and drugs interact with genes involved in malignant transfromation |
| (DGIdb 4.0) |
| Entrez ID | Symbol | Category | Interaction Types | Drug Claim Name | Drug Name | PMIDs |
| Page: 1 |

Copyright 2023-Present -The University of Texas Health Science Center at Houston |