
|
|||||
|
 | |
| |
| |
| |
| |
| |
|
Gene: MED16 |
Gene summary for MED16 |
| Gene information | Species | Human | Gene symbol | MED16 | Gene ID | 10025 |
| Gene name | mediator complex subunit 16 | |
| Gene Alias | DRIP92 | |
| Cytomap | 19p13.3 | |
| Gene Type | protein-coding | GO ID | GO:0006139 | UniProtAcc | Q9Y2X0 |
Top |
Malignant transformation analysis |
| Identification of the aberrant gene expression in precancerous and cancerous lesions by comparing the gene expression of stem-like cells in diseased tissues with normal stem cells |
| Entrez ID | Symbol | Replicates | Species | Organ | Tissue | Adj P-value | Log2FC | Malignancy |
| 10025 | MED16 | LZE4T | Human | Esophagus | ESCC | 3.13e-08 | 1.36e-01 | 0.0811 |
| 10025 | MED16 | LZE7T | Human | Esophagus | ESCC | 6.04e-04 | 1.10e-01 | 0.0667 |
| 10025 | MED16 | LZE8T | Human | Esophagus | ESCC | 9.57e-04 | 8.91e-02 | 0.067 |
| 10025 | MED16 | LZE20T | Human | Esophagus | ESCC | 2.04e-04 | 1.63e-01 | 0.0662 |
| 10025 | MED16 | LZE24T | Human | Esophagus | ESCC | 1.23e-18 | 3.60e-01 | 0.0596 |
| 10025 | MED16 | LZE22D3 | Human | Esophagus | HGIN | 9.37e-04 | 5.85e-01 | 0.0653 |
| 10025 | MED16 | LZE21T | Human | Esophagus | ESCC | 1.94e-04 | 3.83e-01 | 0.0655 |
| 10025 | MED16 | P1T-E | Human | Esophagus | ESCC | 7.85e-11 | 4.74e-01 | 0.0875 |
| 10025 | MED16 | P2T-E | Human | Esophagus | ESCC | 7.13e-16 | 2.86e-01 | 0.1177 |
| 10025 | MED16 | P4T-E | Human | Esophagus | ESCC | 4.97e-17 | 2.55e-01 | 0.1323 |
| 10025 | MED16 | P5T-E | Human | Esophagus | ESCC | 1.78e-14 | 1.12e-01 | 0.1327 |
| 10025 | MED16 | P8T-E | Human | Esophagus | ESCC | 4.03e-13 | 1.65e-01 | 0.0889 |
| 10025 | MED16 | P9T-E | Human | Esophagus | ESCC | 1.09e-16 | 3.46e-01 | 0.1131 |
| 10025 | MED16 | P10T-E | Human | Esophagus | ESCC | 2.50e-21 | 2.58e-01 | 0.116 |
| 10025 | MED16 | P11T-E | Human | Esophagus | ESCC | 9.95e-13 | 3.86e-01 | 0.1426 |
| 10025 | MED16 | P12T-E | Human | Esophagus | ESCC | 2.66e-28 | 4.61e-01 | 0.1122 |
| 10025 | MED16 | P15T-E | Human | Esophagus | ESCC | 9.90e-22 | 4.14e-01 | 0.1149 |
| 10025 | MED16 | P16T-E | Human | Esophagus | ESCC | 2.22e-18 | 3.08e-01 | 0.1153 |
| 10025 | MED16 | P17T-E | Human | Esophagus | ESCC | 9.65e-20 | 6.81e-01 | 0.1278 |
| 10025 | MED16 | P19T-E | Human | Esophagus | ESCC | 6.96e-12 | 6.55e-01 | 0.1662 |
| Page: 1 2 3 4 5 6 |
| Tissue | Expression Dynamics | Abbreviation |
| Esophagus | 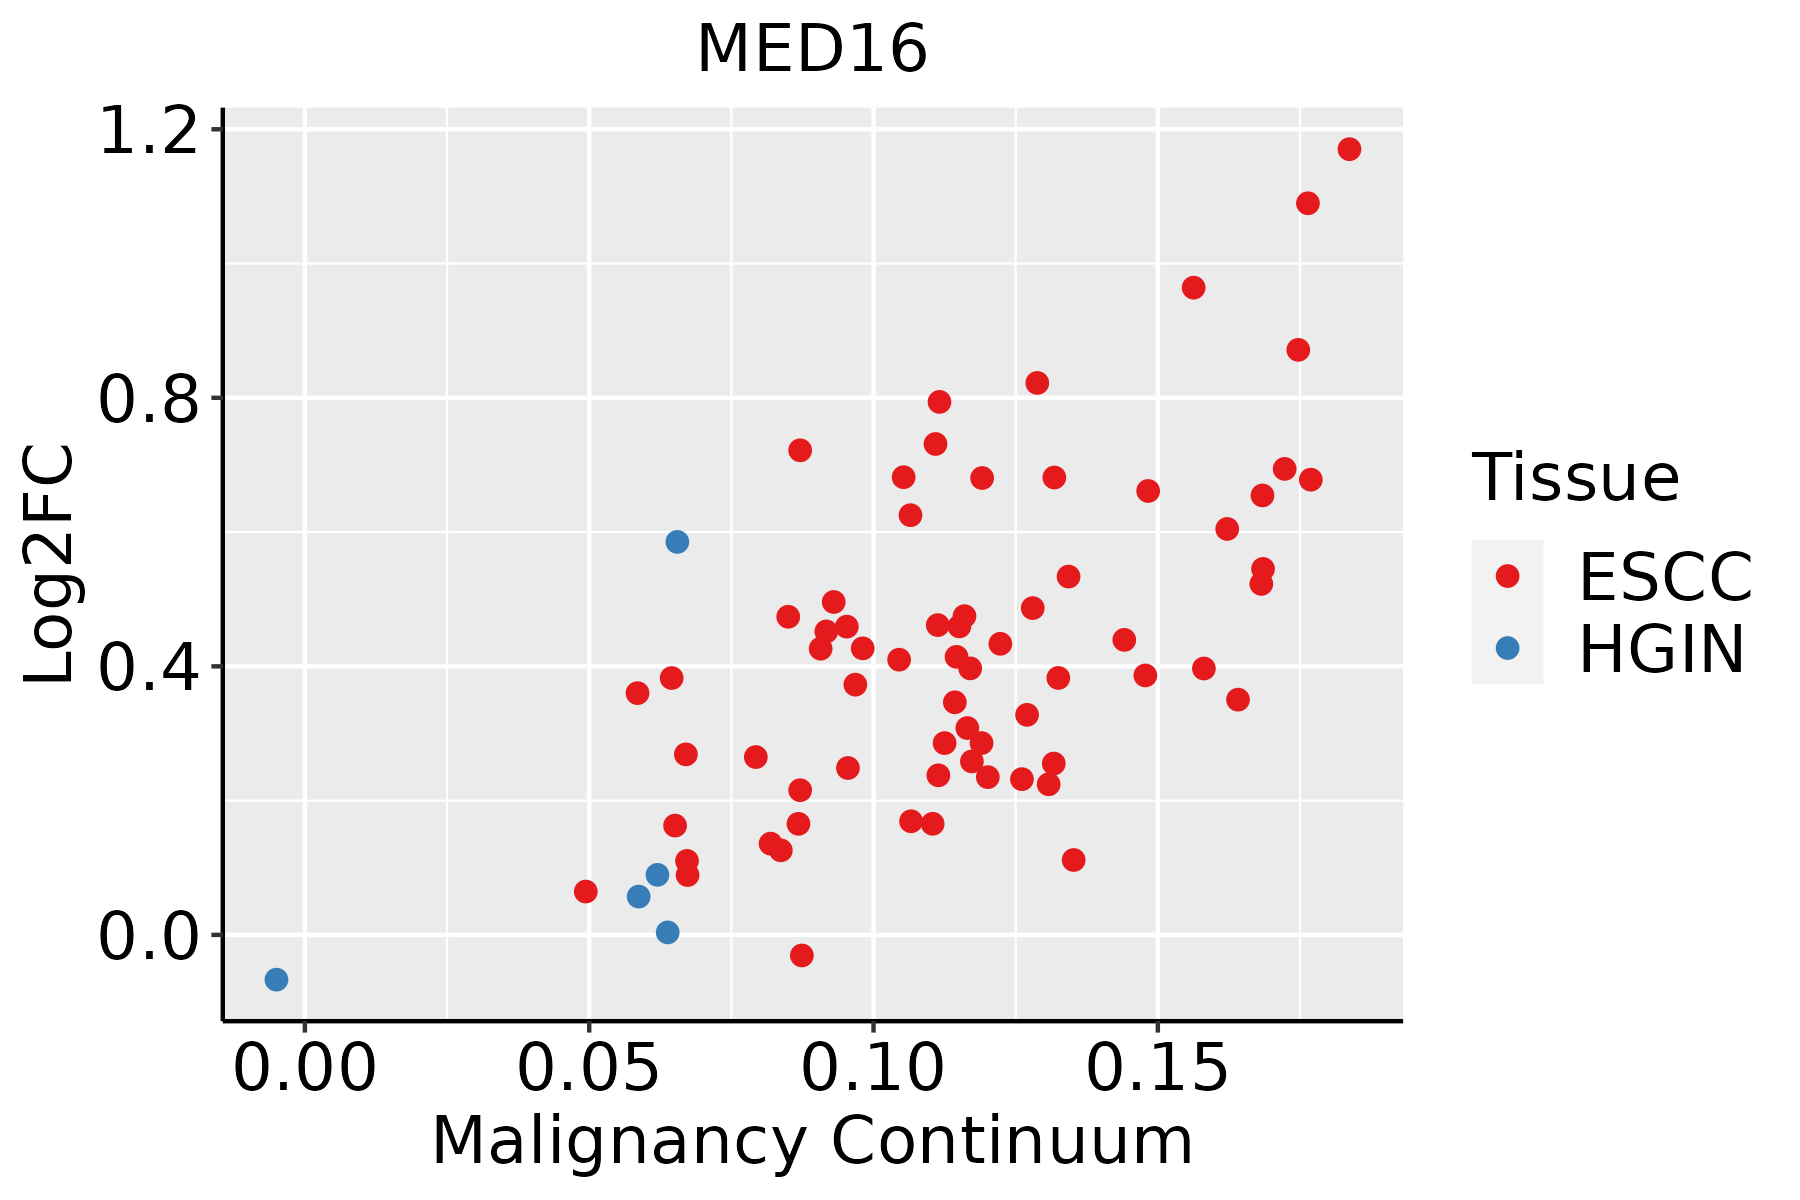 | ESCC: Esophageal squamous cell carcinoma |
| HGIN: High-grade intraepithelial neoplasias | ||
| LGIN: Low-grade intraepithelial neoplasias | ||
| Liver |  | HCC: Hepatocellular carcinoma |
| NAFLD: Non-alcoholic fatty liver disease | ||
| Oral Cavity |  | EOLP: Erosive Oral lichen planus |
| LP: leukoplakia | ||
| NEOLP: Non-erosive oral lichen planus | ||
| OSCC: Oral squamous cell carcinoma | ||
| Thyroid | 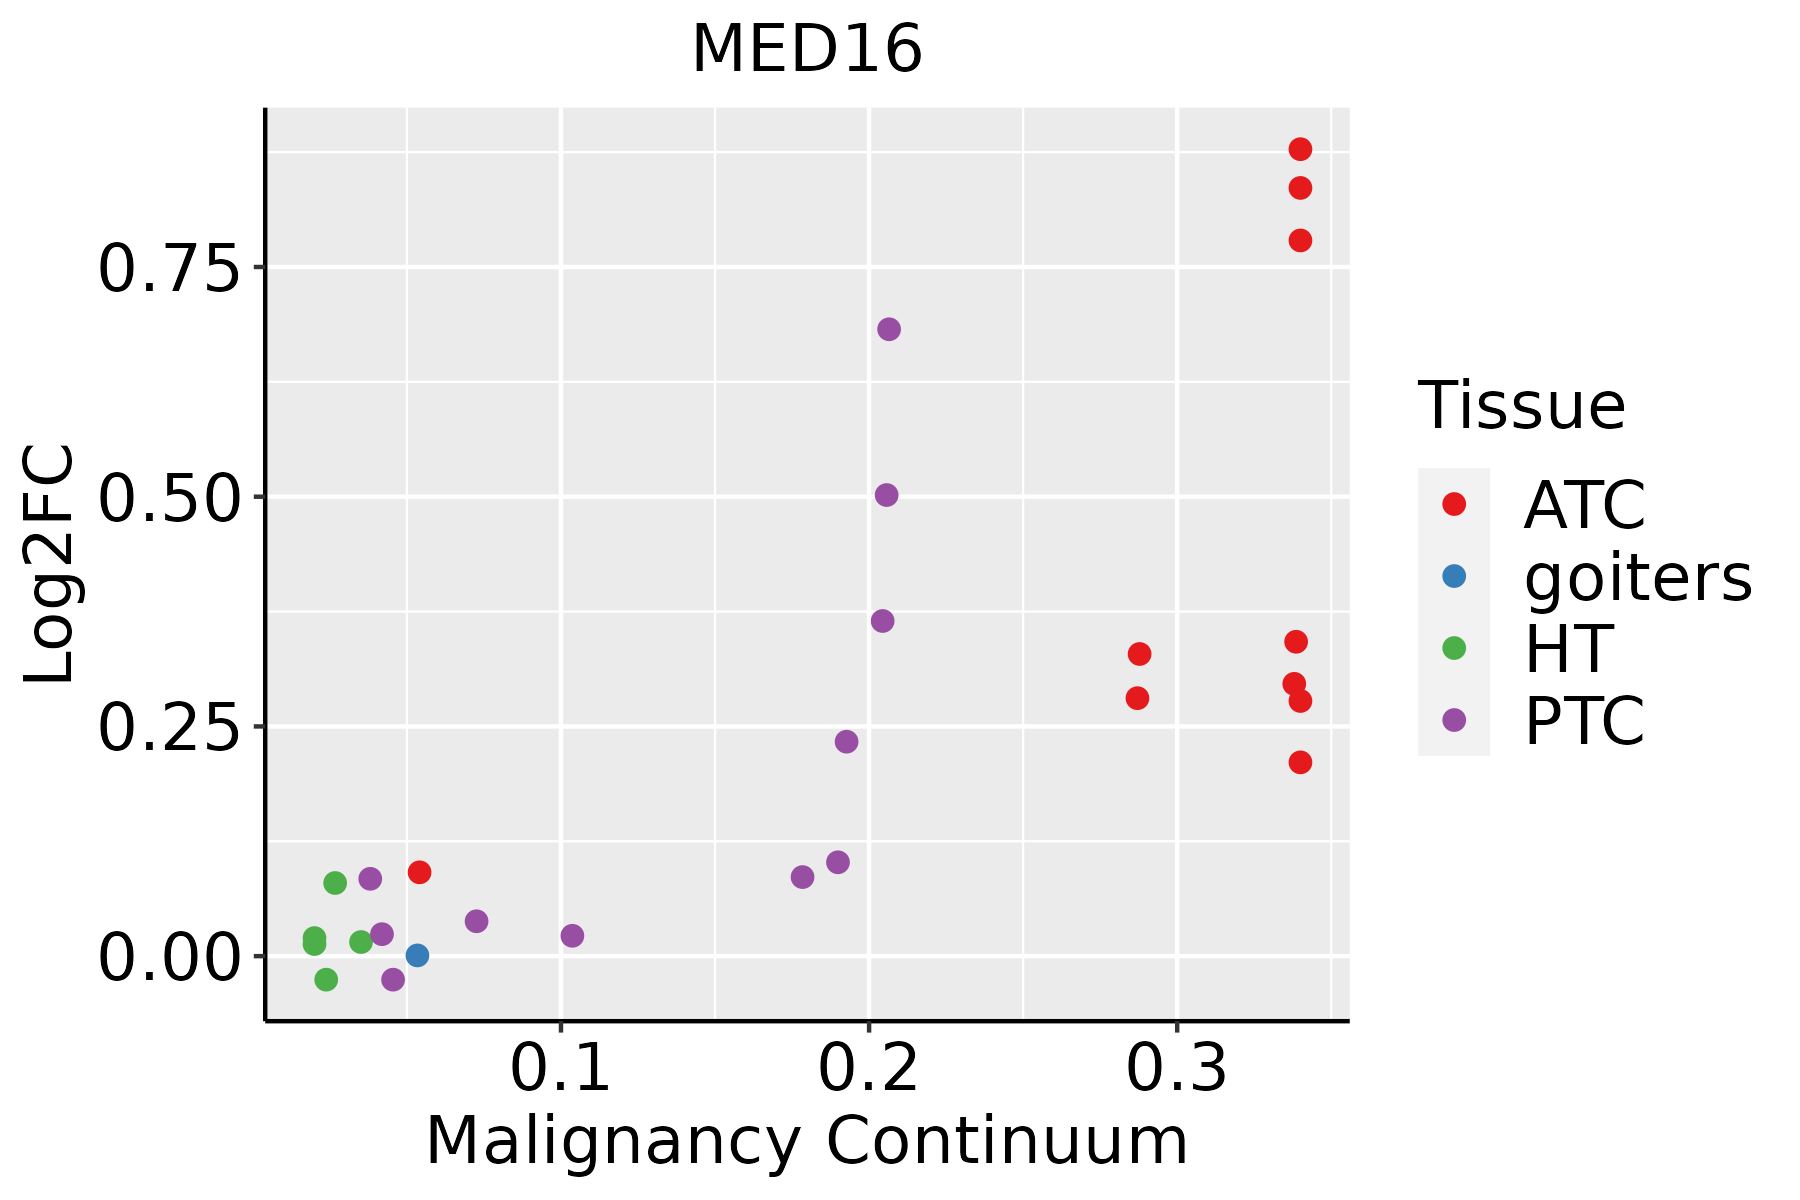 | ATC: Anaplastic thyroid cancer |
| HT: Hashimoto's thyroiditis | ||
| PTC: Papillary thyroid cancer |
| ∗log2FC in expression of this searched gene in stem-like cells from each diseased tissue sample relative to stem-like cells in normal samples in each tissue plotted against the malignancy continuum. Samples are colored based on if they are from different disease stage. |
Top |
Malignant transformation related pathway analysis |
| Find out the enriched GO biological processes and KEGG pathways involved in transition from healthy to precancer to cancer |
| Tissue | Disease Stage | Enriched GO biological Processes |
| Colorectum | AD |  |
| Colorectum | SER |  |
| Colorectum | MSS |  |
| Colorectum | MSI-H |  |
| Colorectum | FAP |  |
| ∗Top 15 enriched GO BP terms are showed in the bar plot of each disease state in each tissue. Each row represents a significant GO biological process which is colored according to the -log10(p.adjust). |
| Page: 1 2 3 4 5 6 7 8 9 |
| GO ID | Tissue | Disease Stage | Description | Gene Ratio | Bg Ratio | pvalue | p.adjust | Count |
| GO:00063523 | Esophagus | HGIN | DNA-templated transcription, initiation | 30/2587 | 130/18723 | 2.86e-03 | 2.79e-02 | 30 |
| GO:20001424 | Esophagus | HGIN | regulation of DNA-templated transcription, initiation | 12/2587 | 40/18723 | 6.22e-03 | 4.95e-02 | 12 |
| GO:00063673 | Esophagus | ESCC | transcription initiation from RNA polymerase II promoter | 56/8552 | 77/18723 | 1.30e-06 | 1.59e-05 | 56 |
| GO:000635211 | Esophagus | ESCC | DNA-templated transcription, initiation | 86/8552 | 130/18723 | 1.88e-06 | 2.19e-05 | 86 |
| GO:00602603 | Esophagus | ESCC | regulation of transcription initiation from RNA polymerase II promoter | 25/8552 | 33/18723 | 4.30e-04 | 2.43e-03 | 25 |
| GO:200014212 | Esophagus | ESCC | regulation of DNA-templated transcription, initiation | 29/8552 | 40/18723 | 5.32e-04 | 2.93e-03 | 29 |
| GO:20001443 | Esophagus | ESCC | positive regulation of DNA-templated transcription, initiation | 21/8552 | 31/18723 | 1.10e-02 | 3.70e-02 | 21 |
| GO:00063671 | Liver | HCC | transcription initiation from RNA polymerase II promoter | 52/7958 | 77/18723 | 7.87e-06 | 9.27e-05 | 52 |
| GO:0006352 | Liver | HCC | DNA-templated transcription, initiation | 78/7958 | 130/18723 | 4.19e-05 | 4.11e-04 | 78 |
| GO:20001421 | Liver | HCC | regulation of DNA-templated transcription, initiation | 28/7958 | 40/18723 | 4.01e-04 | 2.71e-03 | 28 |
| GO:00602601 | Liver | HCC | regulation of transcription initiation from RNA polymerase II promoter | 24/7958 | 33/18723 | 4.24e-04 | 2.85e-03 | 24 |
| GO:2000144 | Liver | HCC | positive regulation of DNA-templated transcription, initiation | 21/7958 | 31/18723 | 4.01e-03 | 1.76e-02 | 21 |
| GO:0060261 | Liver | HCC | positive regulation of transcription initiation from RNA polymerase II promoter | 17/7958 | 25/18723 | 8.94e-03 | 3.45e-02 | 17 |
| GO:00063522 | Oral cavity | OSCC | DNA-templated transcription, initiation | 74/7305 | 130/18723 | 2.56e-05 | 2.39e-04 | 74 |
| GO:00063672 | Oral cavity | OSCC | transcription initiation from RNA polymerase II promoter | 46/7305 | 77/18723 | 1.82e-04 | 1.24e-03 | 46 |
| GO:20001423 | Oral cavity | OSCC | regulation of DNA-templated transcription, initiation | 26/7305 | 40/18723 | 7.79e-04 | 4.23e-03 | 26 |
| GO:20001442 | Oral cavity | OSCC | positive regulation of DNA-templated transcription, initiation | 21/7305 | 31/18723 | 1.13e-03 | 5.75e-03 | 21 |
| GO:00602602 | Oral cavity | OSCC | regulation of transcription initiation from RNA polymerase II promoter | 21/7305 | 33/18723 | 3.63e-03 | 1.51e-02 | 21 |
| GO:00602611 | Oral cavity | OSCC | positive regulation of transcription initiation from RNA polymerase II promoter | 16/7305 | 25/18723 | 1.00e-02 | 3.49e-02 | 16 |
| GO:00063675 | Thyroid | PTC | transcription initiation from RNA polymerase II promoter | 44/5968 | 77/18723 | 4.04e-06 | 5.05e-05 | 44 |
| Page: 1 2 |
| Pathway ID | Tissue | Disease Stage | Description | Gene Ratio | Bg Ratio | pvalue | p.adjust | qvalue | Count |
| hsa0491928 | Esophagus | ESCC | Thyroid hormone signaling pathway | 78/4205 | 121/8465 | 6.79e-04 | 2.23e-03 | 1.14e-03 | 78 |
| hsa04919113 | Esophagus | ESCC | Thyroid hormone signaling pathway | 78/4205 | 121/8465 | 6.79e-04 | 2.23e-03 | 1.14e-03 | 78 |
| hsa0491912 | Liver | HCC | Thyroid hormone signaling pathway | 75/4020 | 121/8465 | 8.76e-04 | 3.38e-03 | 1.88e-03 | 75 |
| hsa0491913 | Liver | HCC | Thyroid hormone signaling pathway | 75/4020 | 121/8465 | 8.76e-04 | 3.38e-03 | 1.88e-03 | 75 |
| hsa0491926 | Oral cavity | OSCC | Thyroid hormone signaling pathway | 73/3704 | 121/8465 | 1.63e-04 | 5.52e-04 | 2.81e-04 | 73 |
| hsa04919112 | Oral cavity | OSCC | Thyroid hormone signaling pathway | 73/3704 | 121/8465 | 1.63e-04 | 5.52e-04 | 2.81e-04 | 73 |
| Page: 1 |
Top |
Cell-cell communication analysis |
| Identification of potential cell-cell interactions between two cell types and their ligand-receptor pairs for different disease states |
| Ligand | Receptor | LRpair | Pathway | Tissue | Disease Stage |
| Page: 1 |
Top |
Single-cell gene regulatory network inference analysis |
| Find out the significant the regulons (TFs) and the target genes of each regulon across cell types for different disease states |
| TF | Cell Type | Tissue | Disease Stage | Target Gene | RSS | Regulon Activity |
| ∗The dot plots of a searched regulon are shown for all cell subpopulations in each disease state of each tissue based on the regulon specific score inferred using pySCENIC and by calculating the average expression. |
| Page: 1 |
Top |
Somatic mutation of malignant transformation related genes |
| Annotation of somatic variants for genes involved in malignant transformation |
| Hugo Symbol | Variant Class | Variant Classification | dbSNP RS | HGVSc | HGVSp | HGVSp Short | SWISSPROT | BIOTYPE | SIFT | PolyPhen | Tumor Sample Barcode | Tissue | Histology | Sex | Age | Stage | Therapy Types | Drugs | Outcome |
| MED16 | SNV | Missense_Mutation | novel | c.1717N>T | p.Asp573Tyr | p.D573Y | Q9Y2X0 | protein_coding | deleterious(0) | probably_damaging(0.999) | TCGA-AC-A5EH-01 | Breast | breast invasive carcinoma | Female | >=65 | I/II | Unknown | Unknown | SD |
| MED16 | SNV | Missense_Mutation | c.915N>G | p.Ile305Met | p.I305M | Q9Y2X0 | protein_coding | tolerated(0.07) | possibly_damaging(0.49) | TCGA-AO-A0J6-01 | Breast | breast invasive carcinoma | Female | <65 | I/II | Chemotherapy | doxorubicin | SD | |
| MED16 | SNV | Missense_Mutation | novel | c.1223N>G | p.Ser408Cys | p.S408C | Q9Y2X0 | protein_coding | deleterious(0.01) | probably_damaging(0.996) | TCGA-BH-A0HP-01 | Breast | breast invasive carcinoma | Female | >=65 | III/IV | Chemotherapy | doxorubicin | SD |
| MED16 | SNV | Missense_Mutation | c.193N>A | p.Leu65Met | p.L65M | Q9Y2X0 | protein_coding | deleterious(0.04) | possibly_damaging(0.526) | TCGA-E2-A1LH-01 | Breast | breast invasive carcinoma | Female | <65 | I/II | Chemotherapy | adriamycin | SD | |
| MED16 | SNV | Missense_Mutation | rs556826884 | c.1018N>T | p.Arg340Trp | p.R340W | Q9Y2X0 | protein_coding | deleterious(0) | probably_damaging(0.998) | TCGA-PE-A5DE-01 | Breast | breast invasive carcinoma | Female | <65 | I/II | Chemotherapy | taxotere | CR |
| MED16 | deletion | Frame_Shift_Del | rs763168493 | c.1720_1721delNN | p.Lys574GlufsTer19 | p.K574Efs*19 | Q9Y2X0 | protein_coding | TCGA-E9-A1R2-01 | Breast | breast invasive carcinoma | Female | <65 | III/IV | Chemotherapy | taxotere | CR | ||
| MED16 | SNV | Missense_Mutation | novel | c.176N>T | p.Thr59Ile | p.T59I | Q9Y2X0 | protein_coding | deleterious(0.04) | possibly_damaging(0.446) | TCGA-2W-A8YY-01 | Cervix | cervical & endocervical cancer | Female | <65 | I/II | Chemotherapy | cisplatin | CR |
| MED16 | SNV | Missense_Mutation | novel | c.1644N>A | p.His548Gln | p.H548Q | Q9Y2X0 | protein_coding | deleterious(0.01) | possibly_damaging(0.494) | TCGA-IR-A3LB-01 | Cervix | cervical & endocervical cancer | Female | <65 | I/II | Chemotherapy | cisplatin | PD |
| MED16 | SNV | Missense_Mutation | c.307N>A | p.Gly103Arg | p.G103R | Q9Y2X0 | protein_coding | deleterious(0.02) | probably_damaging(0.987) | TCGA-A6-6780-01 | Colorectum | colon adenocarcinoma | Male | >=65 | I/II | Unknown | Unknown | SD | |
| MED16 | SNV | Missense_Mutation | c.736N>A | p.Val246Met | p.V246M | Q9Y2X0 | protein_coding | deleterious(0) | probably_damaging(0.93) | TCGA-AU-6004-01 | Colorectum | colon adenocarcinoma | Female | >=65 | I/II | Unknown | Unknown | SD |
| Page: 1 2 3 4 5 6 7 |
Top |
Related drugs of malignant transformation related genes |
| Identification of chemicals and drugs interact with genes involved in malignant transfromation |
| (DGIdb 4.0) |
| Entrez ID | Symbol | Category | Interaction Types | Drug Claim Name | Drug Name | PMIDs |
| Page: 1 |

Copyright 2023-Present -The University of Texas Health Science Center at Houston |