
|
|||||
|
 | |
| |
| |
| |
| |
| |
|
Gene: MED15 |
Gene summary for MED15 |
| Gene information | Species | Human | Gene symbol | MED15 | Gene ID | 51586 |
| Gene name | mediator complex subunit 15 | |
| Gene Alias | ARC105 | |
| Cytomap | 22q11.21 | |
| Gene Type | protein-coding | GO ID | GO:0006139 | UniProtAcc | Q6PKB8 |
Top |
Malignant transformation analysis |
| Identification of the aberrant gene expression in precancerous and cancerous lesions by comparing the gene expression of stem-like cells in diseased tissues with normal stem cells |
| Entrez ID | Symbol | Replicates | Species | Organ | Tissue | Adj P-value | Log2FC | Malignancy |
| 51586 | MED15 | CCI_2 | Human | Cervix | CC | 2.13e-07 | 8.43e-01 | 0.5249 |
| 51586 | MED15 | CCI_3 | Human | Cervix | CC | 1.12e-08 | 6.39e-01 | 0.516 |
| 51586 | MED15 | sample3 | Human | Cervix | CC | 9.44e-03 | 1.93e-01 | 0.1387 |
| 51586 | MED15 | T3 | Human | Cervix | CC | 2.89e-04 | 1.86e-01 | 0.1389 |
| 51586 | MED15 | LZE4T | Human | Esophagus | ESCC | 1.17e-06 | 1.52e-01 | 0.0811 |
| 51586 | MED15 | LZE7T | Human | Esophagus | ESCC | 5.47e-17 | 8.17e-01 | 0.0667 |
| 51586 | MED15 | LZE8T | Human | Esophagus | ESCC | 4.07e-08 | 4.14e-01 | 0.067 |
| 51586 | MED15 | LZE22D1 | Human | Esophagus | HGIN | 5.21e-04 | 1.37e-01 | 0.0595 |
| 51586 | MED15 | LZE22T | Human | Esophagus | ESCC | 1.59e-08 | 3.22e-01 | 0.068 |
| 51586 | MED15 | LZE24T | Human | Esophagus | ESCC | 4.94e-17 | 5.00e-01 | 0.0596 |
| 51586 | MED15 | LZE21T | Human | Esophagus | ESCC | 4.49e-04 | 4.66e-01 | 0.0655 |
| 51586 | MED15 | LZE6T | Human | Esophagus | ESCC | 4.85e-06 | 2.07e-01 | 0.0845 |
| 51586 | MED15 | P1T-E | Human | Esophagus | ESCC | 2.11e-09 | 6.57e-01 | 0.0875 |
| 51586 | MED15 | P2T-E | Human | Esophagus | ESCC | 1.10e-28 | 5.25e-01 | 0.1177 |
| 51586 | MED15 | P4T-E | Human | Esophagus | ESCC | 6.70e-17 | 3.46e-01 | 0.1323 |
| 51586 | MED15 | P5T-E | Human | Esophagus | ESCC | 3.25e-35 | 5.07e-01 | 0.1327 |
| 51586 | MED15 | P8T-E | Human | Esophagus | ESCC | 3.79e-29 | 4.71e-01 | 0.0889 |
| 51586 | MED15 | P9T-E | Human | Esophagus | ESCC | 1.11e-16 | 4.73e-01 | 0.1131 |
| 51586 | MED15 | P10T-E | Human | Esophagus | ESCC | 3.99e-25 | 4.08e-01 | 0.116 |
| 51586 | MED15 | P11T-E | Human | Esophagus | ESCC | 1.50e-19 | 1.02e+00 | 0.1426 |
| Page: 1 2 3 4 5 6 7 |
| Tissue | Expression Dynamics | Abbreviation |
| Cervix | 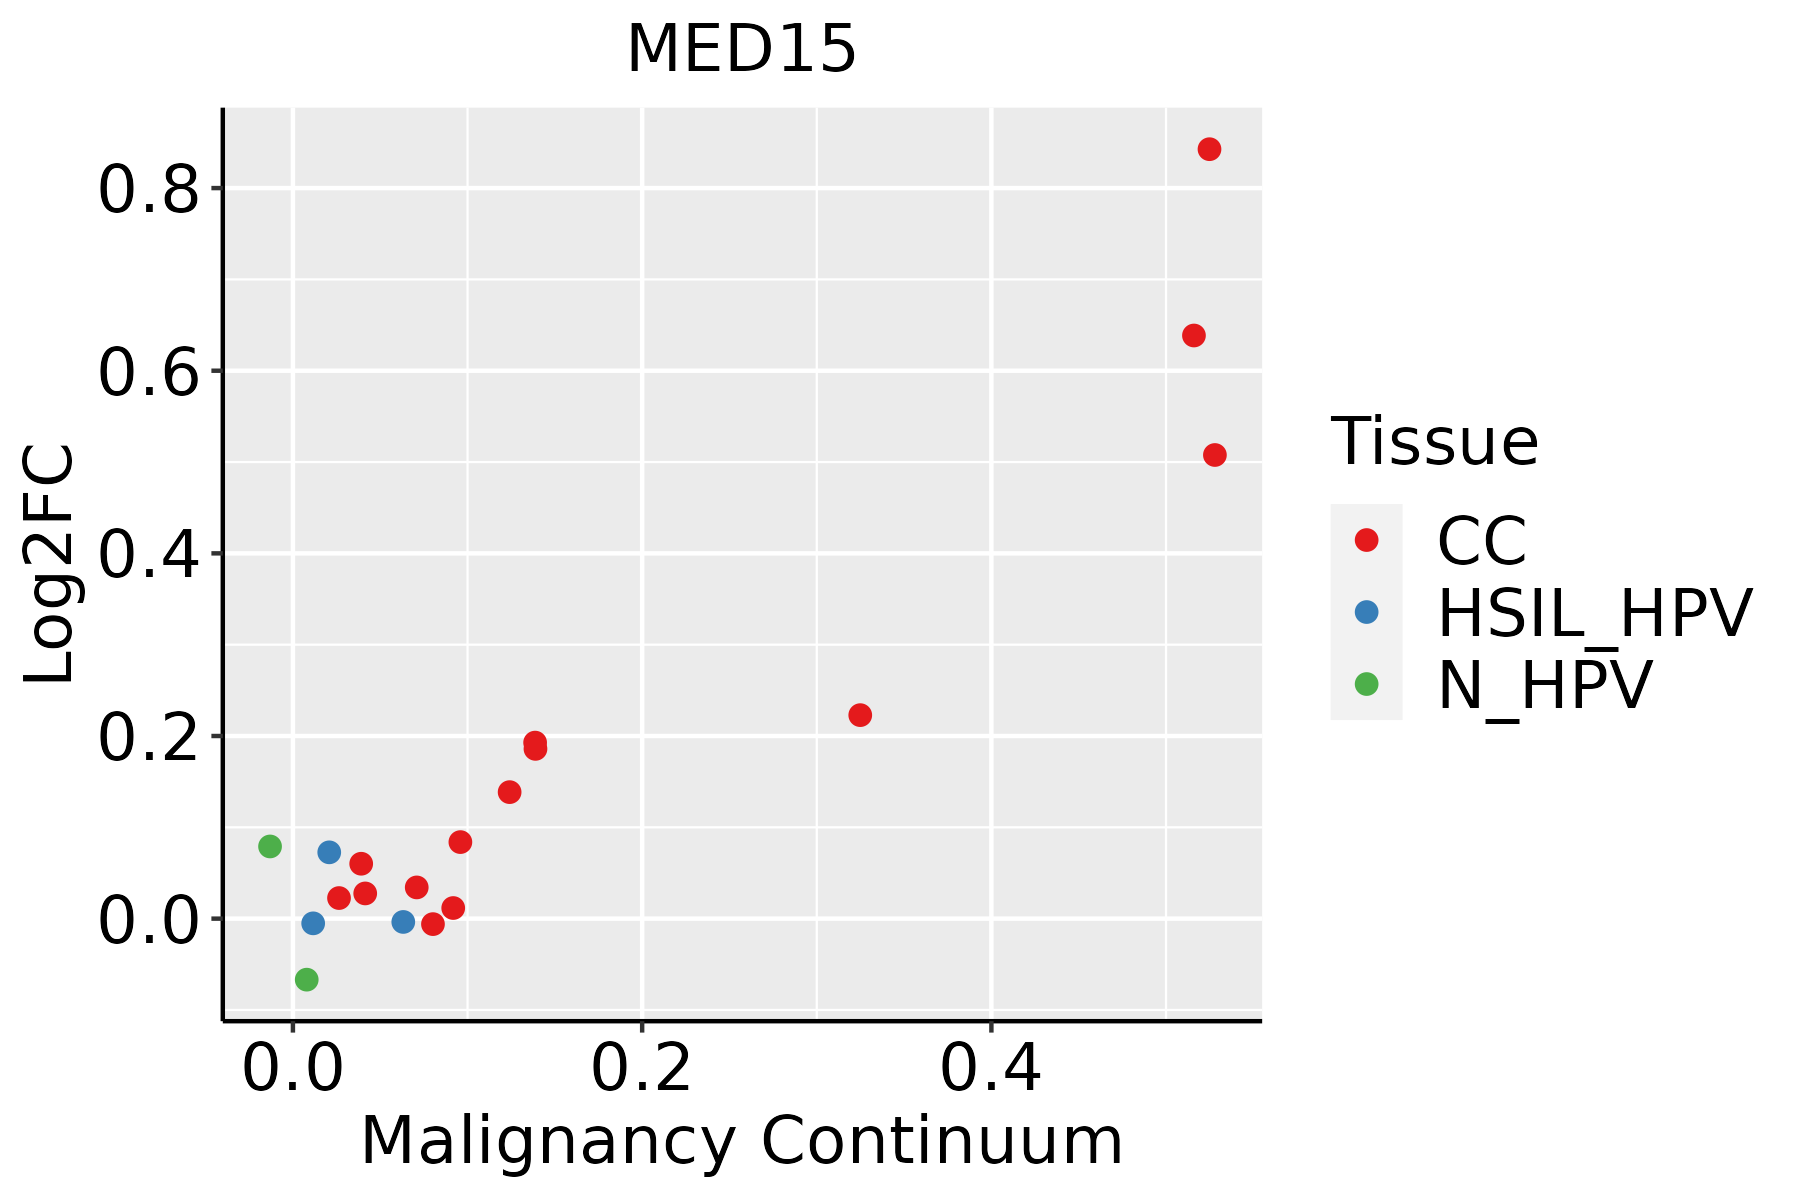 | CC: Cervix cancer |
| HSIL_HPV: HPV-infected high-grade squamous intraepithelial lesions | ||
| N_HPV: HPV-infected normal cervix | ||
| Esophagus |  | ESCC: Esophageal squamous cell carcinoma |
| HGIN: High-grade intraepithelial neoplasias | ||
| LGIN: Low-grade intraepithelial neoplasias | ||
| Liver | 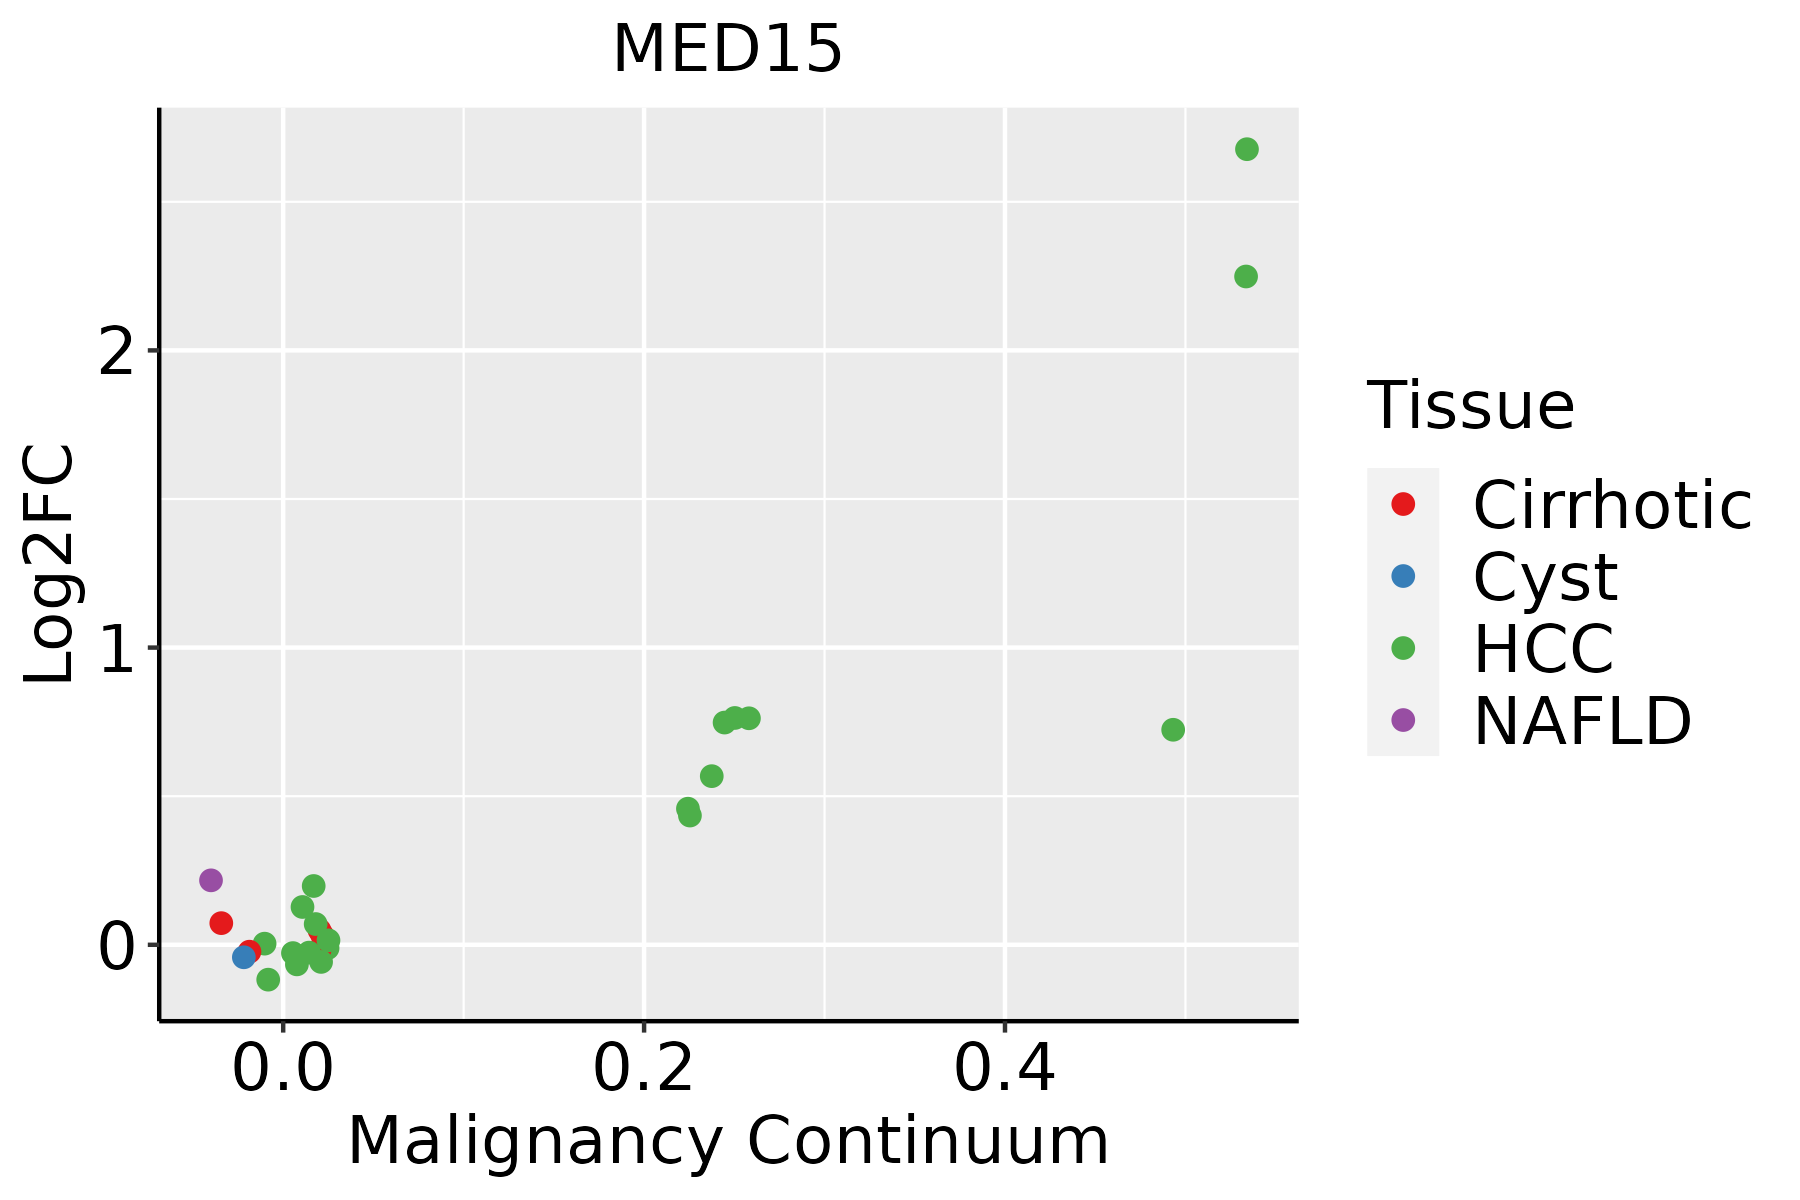 | HCC: Hepatocellular carcinoma |
| NAFLD: Non-alcoholic fatty liver disease | ||
| Oral Cavity |  | EOLP: Erosive Oral lichen planus |
| LP: leukoplakia | ||
| NEOLP: Non-erosive oral lichen planus | ||
| OSCC: Oral squamous cell carcinoma | ||
| Skin |  | AK: Actinic keratosis |
| cSCC: Cutaneous squamous cell carcinoma | ||
| SCCIS:squamous cell carcinoma in situ | ||
| Thyroid | 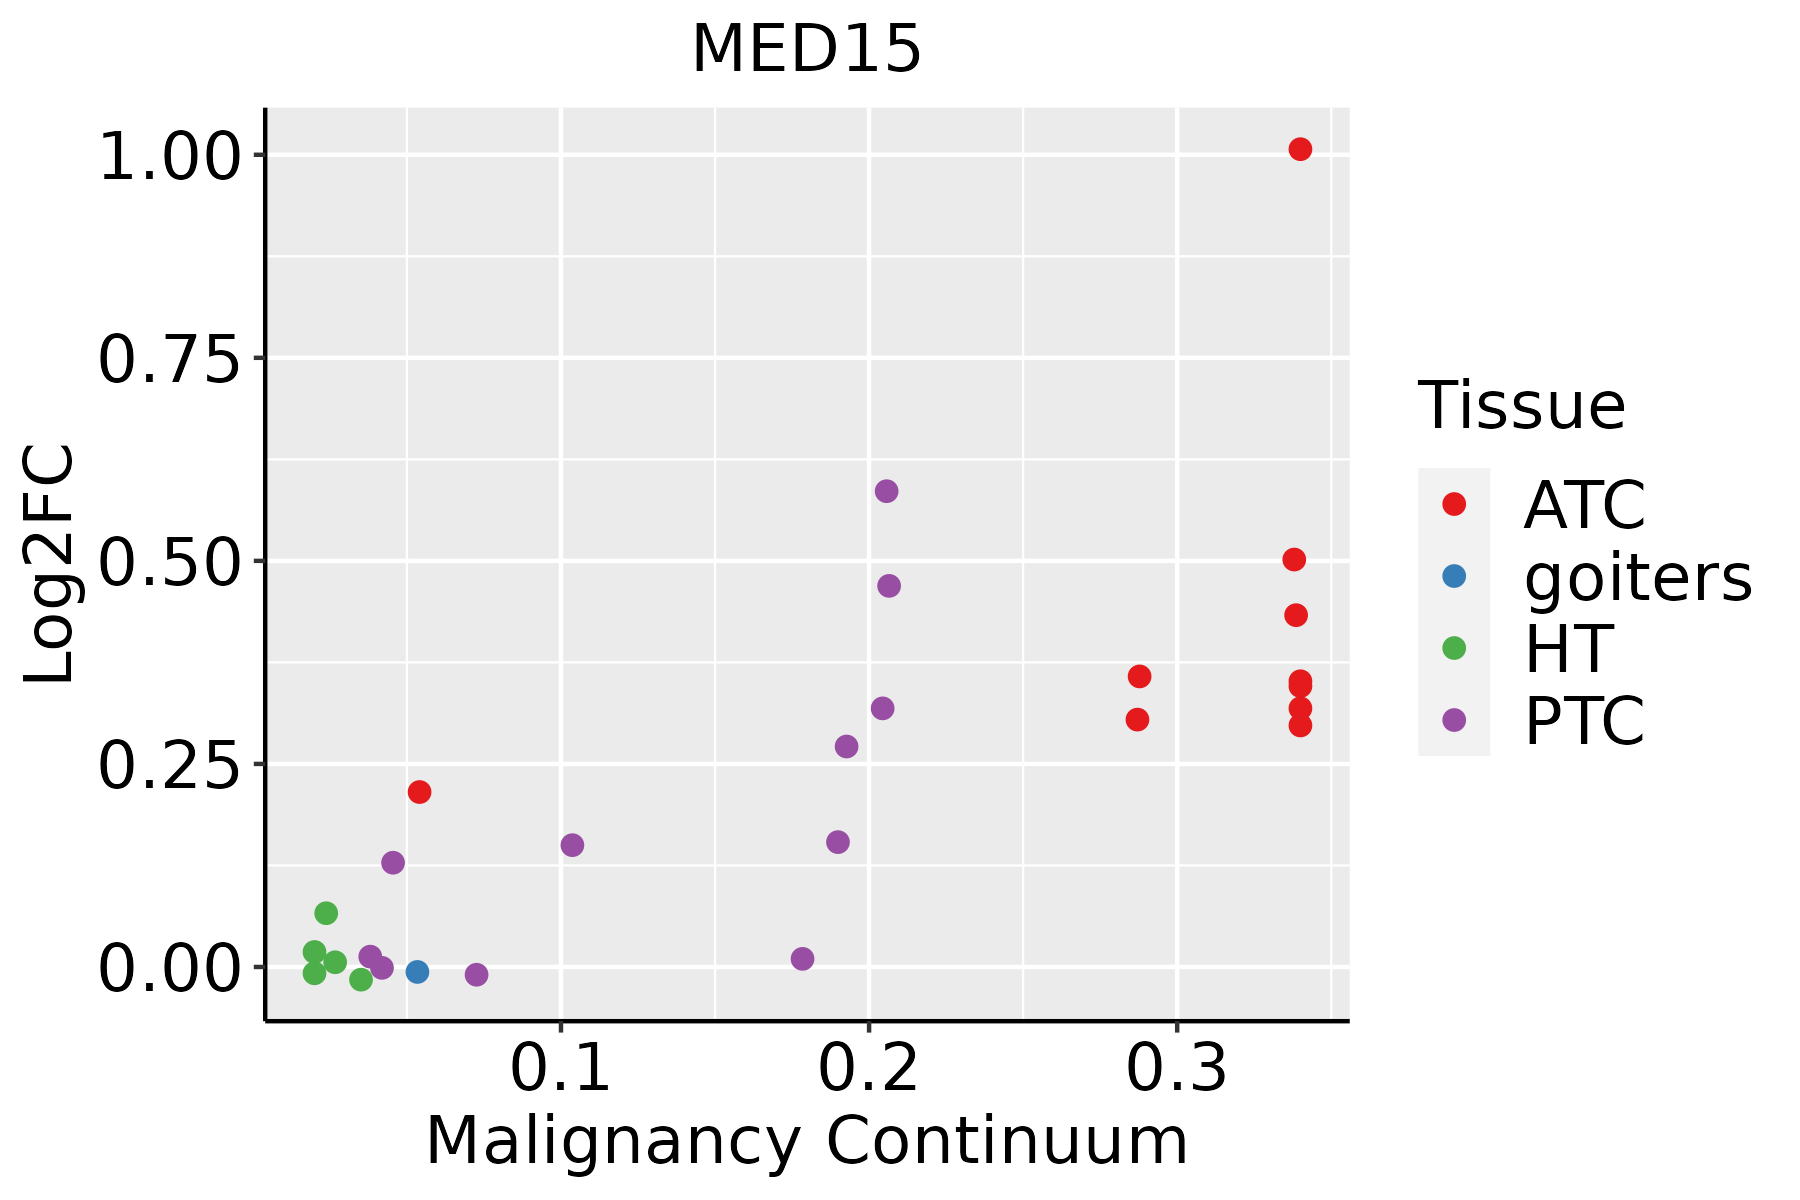 | ATC: Anaplastic thyroid cancer |
| HT: Hashimoto's thyroiditis | ||
| PTC: Papillary thyroid cancer |
| ∗log2FC in expression of this searched gene in stem-like cells from each diseased tissue sample relative to stem-like cells in normal samples in each tissue plotted against the malignancy continuum. Samples are colored based on if they are from different disease stage. |
Top |
Malignant transformation related pathway analysis |
| Find out the enriched GO biological processes and KEGG pathways involved in transition from healthy to precancer to cancer |
| Tissue | Disease Stage | Enriched GO biological Processes |
| Colorectum | AD |  |
| Colorectum | SER |  |
| Colorectum | MSS |  |
| Colorectum | MSI-H |  |
| Colorectum | FAP |  |
| ∗Top 15 enriched GO BP terms are showed in the bar plot of each disease state in each tissue. Each row represents a significant GO biological process which is colored according to the -log10(p.adjust). |
| Page: 1 2 3 4 5 6 7 8 9 |
| GO ID | Tissue | Disease Stage | Description | Gene Ratio | Bg Ratio | pvalue | p.adjust | Count |
| Page: 1 |
| Pathway ID | Tissue | Disease Stage | Description | Gene Ratio | Bg Ratio | pvalue | p.adjust | qvalue | Count |
| Page: 1 |
Top |
Cell-cell communication analysis |
| Identification of potential cell-cell interactions between two cell types and their ligand-receptor pairs for different disease states |
| Ligand | Receptor | LRpair | Pathway | Tissue | Disease Stage |
| Page: 1 |
Top |
Single-cell gene regulatory network inference analysis |
| Find out the significant the regulons (TFs) and the target genes of each regulon across cell types for different disease states |
| TF | Cell Type | Tissue | Disease Stage | Target Gene | RSS | Regulon Activity |
| ∗The dot plots of a searched regulon are shown for all cell subpopulations in each disease state of each tissue based on the regulon specific score inferred using pySCENIC and by calculating the average expression. |
| Page: 1 |
Top |
Somatic mutation of malignant transformation related genes |
| Annotation of somatic variants for genes involved in malignant transformation |
| Hugo Symbol | Variant Class | Variant Classification | dbSNP RS | HGVSc | HGVSp | HGVSp Short | SWISSPROT | BIOTYPE | SIFT | PolyPhen | Tumor Sample Barcode | Tissue | Histology | Sex | Age | Stage | Therapy Types | Drugs | Outcome |
| MED15 | SNV | Missense_Mutation | novel | c.718C>G | p.Arg240Gly | p.R240G | Q96RN5 | protein_coding | tolerated_low_confidence(0.31) | possibly_damaging(0.799) | TCGA-AC-A6IX-01 | Breast | breast invasive carcinoma | Female | <65 | III/IV | Unknown | Unknown | SD |
| MED15 | SNV | Missense_Mutation | rs755070537 | c.1481N>T | p.Thr494Met | p.T494M | Q96RN5 | protein_coding | tolerated(0.17) | possibly_damaging(0.781) | TCGA-AR-A1AV-01 | Breast | breast invasive carcinoma | Male | >=65 | I/II | Chemotherapy | cytoxan | SD |
| MED15 | SNV | Missense_Mutation | novel | c.1938N>C | p.Met646Ile | p.M646I | Q96RN5 | protein_coding | tolerated(0.14) | probably_damaging(0.954) | TCGA-BH-A2L8-01 | Breast | breast invasive carcinoma | Female | <65 | I/II | Chemotherapy | cytoxan | CR |
| MED15 | deletion | In_Frame_Del | novel | c.750_776delACAGCAGCAGCAGCAGCAGCAGCAGCA | p.Gln254_Gln262del | p.Q254_Q262del | Q96RN5 | protein_coding | TCGA-A7-A0DA-01 | Breast | breast invasive carcinoma | Female | <65 | I/II | Chemotherapy | adriamycin | SD | ||
| MED15 | SNV | Missense_Mutation | rs763744861 | c.208N>T | p.His70Tyr | p.H70Y | Q96RN5 | protein_coding | tolerated(0.46) | benign(0.001) | TCGA-EK-A2R8-01 | Cervix | cervical & endocervical cancer | Female | <65 | I/II | Unknown | Unknown | SD |
| MED15 | SNV | Missense_Mutation | c.1814C>T | p.Pro605Leu | p.P605L | Q96RN5 | protein_coding | deleterious(0.03) | probably_damaging(0.999) | TCGA-A6-2684-01 | Colorectum | colon adenocarcinoma | Female | >=65 | I/II | Unknown | Unknown | PD | |
| MED15 | SNV | Missense_Mutation | c.817N>T | p.Pro273Ser | p.P273S | Q96RN5 | protein_coding | tolerated_low_confidence(0.58) | benign(0.007) | TCGA-A6-5665-01 | Colorectum | colon adenocarcinoma | Female | >=65 | I/II | Unknown | Unknown | PD | |
| MED15 | SNV | Missense_Mutation | c.1021N>G | p.Thr341Ala | p.T341A | Q96RN5 | protein_coding | tolerated_low_confidence(0.8) | benign(0) | TCGA-AA-3815-01 | Colorectum | colon adenocarcinoma | Female | >=65 | I/II | Unknown | Unknown | SD | |
| MED15 | SNV | Missense_Mutation | novel | c.796N>A | p.Ala266Thr | p.A266T | Q96RN5 | protein_coding | tolerated_low_confidence(0.35) | benign(0.174) | TCGA-CK-4951-01 | Colorectum | colon adenocarcinoma | Female | >=65 | I/II | Unknown | Unknown | PD |
| MED15 | SNV | Missense_Mutation | c.1273N>A | p.Val425Ile | p.V425I | Q96RN5 | protein_coding | deleterious_low_confidence(0.05) | probably_damaging(0.983) | TCGA-CK-4951-01 | Colorectum | colon adenocarcinoma | Female | >=65 | I/II | Unknown | Unknown | PD |
| Page: 1 2 3 4 5 6 7 8 |
Top |
Related drugs of malignant transformation related genes |
| Identification of chemicals and drugs interact with genes involved in malignant transfromation |
| (DGIdb 4.0) |
| Entrez ID | Symbol | Category | Interaction Types | Drug Claim Name | Drug Name | PMIDs |
| Page: 1 |

Copyright 2023-Present -The University of Texas Health Science Center at Houston |