
|
|||||
|
 | |
| |
| |
| |
| |
| |
|
Gene: MED14 |
Gene summary for MED14 |
| Gene information | Species | Human | Gene symbol | MED14 | Gene ID | 9282 |
| Gene name | mediator complex subunit 14 | |
| Gene Alias | CRSP150 | |
| Cytomap | Xp11.4 | |
| Gene Type | protein-coding | GO ID | GO:0006139 | UniProtAcc | O60244 |
Top |
Malignant transformation analysis |
| Identification of the aberrant gene expression in precancerous and cancerous lesions by comparing the gene expression of stem-like cells in diseased tissues with normal stem cells |
| Entrez ID | Symbol | Replicates | Species | Organ | Tissue | Adj P-value | Log2FC | Malignancy |
| 9282 | MED14 | HCC1_Meng | Human | Liver | HCC | 6.00e-32 | -4.58e-03 | 0.0246 |
| 9282 | MED14 | HCC2_Meng | Human | Liver | HCC | 6.34e-06 | 1.81e-02 | 0.0107 |
| 9282 | MED14 | S027 | Human | Liver | HCC | 4.35e-05 | 5.60e-01 | 0.2446 |
| 9282 | MED14 | S028 | Human | Liver | HCC | 1.41e-11 | 5.72e-01 | 0.2503 |
| 9282 | MED14 | S029 | Human | Liver | HCC | 8.03e-12 | 6.98e-01 | 0.2581 |
| 9282 | MED14 | RNA-P17T-P17T-4 | Human | Lung | IAC | 5.63e-03 | 5.73e-01 | 0.343 |
| 9282 | MED14 | RNA-P17T-P17T-8 | Human | Lung | IAC | 6.26e-04 | 5.10e-01 | 0.3329 |
| 9282 | MED14 | RNA-P6T2-P6T2-3 | Human | Lung | IAC | 1.40e-04 | 1.93e-01 | -0.013 |
| 9282 | MED14 | C21 | Human | Oral cavity | OSCC | 6.27e-09 | 3.82e-01 | 0.2678 |
| 9282 | MED14 | C30 | Human | Oral cavity | OSCC | 2.96e-15 | 5.76e-01 | 0.3055 |
| 9282 | MED14 | C43 | Human | Oral cavity | OSCC | 1.88e-18 | 3.01e-01 | 0.1704 |
| 9282 | MED14 | C51 | Human | Oral cavity | OSCC | 3.85e-03 | 2.92e-01 | 0.2674 |
| 9282 | MED14 | C07 | Human | Oral cavity | OSCC | 1.38e-02 | 4.53e-01 | 0.2491 |
| 9282 | MED14 | LP15 | Human | Oral cavity | LP | 2.09e-03 | 6.75e-01 | 0.2174 |
| 9282 | MED14 | EOLP-1 | Human | Oral cavity | EOLP | 8.45e-03 | 1.79e-01 | -0.0202 |
| 9282 | MED14 | SYSMH1 | Human | Oral cavity | OSCC | 1.35e-03 | 1.14e-01 | 0.1127 |
| 9282 | MED14 | SYSMH2 | Human | Oral cavity | OSCC | 4.90e-04 | 1.89e-01 | 0.2326 |
| 9282 | MED14 | SYSMH3 | Human | Oral cavity | OSCC | 1.71e-10 | 3.65e-01 | 0.2442 |
| 9282 | MED14 | HTA12-23-1 | Human | Pancreas | PDAC | 1.93e-02 | 5.14e-01 | 0.3405 |
| 9282 | MED14 | HTA12-26-1 | Human | Pancreas | PDAC | 3.34e-07 | 5.65e-01 | 0.3728 |
| Page: 1 2 |
| Tissue | Expression Dynamics | Abbreviation |
| Liver | 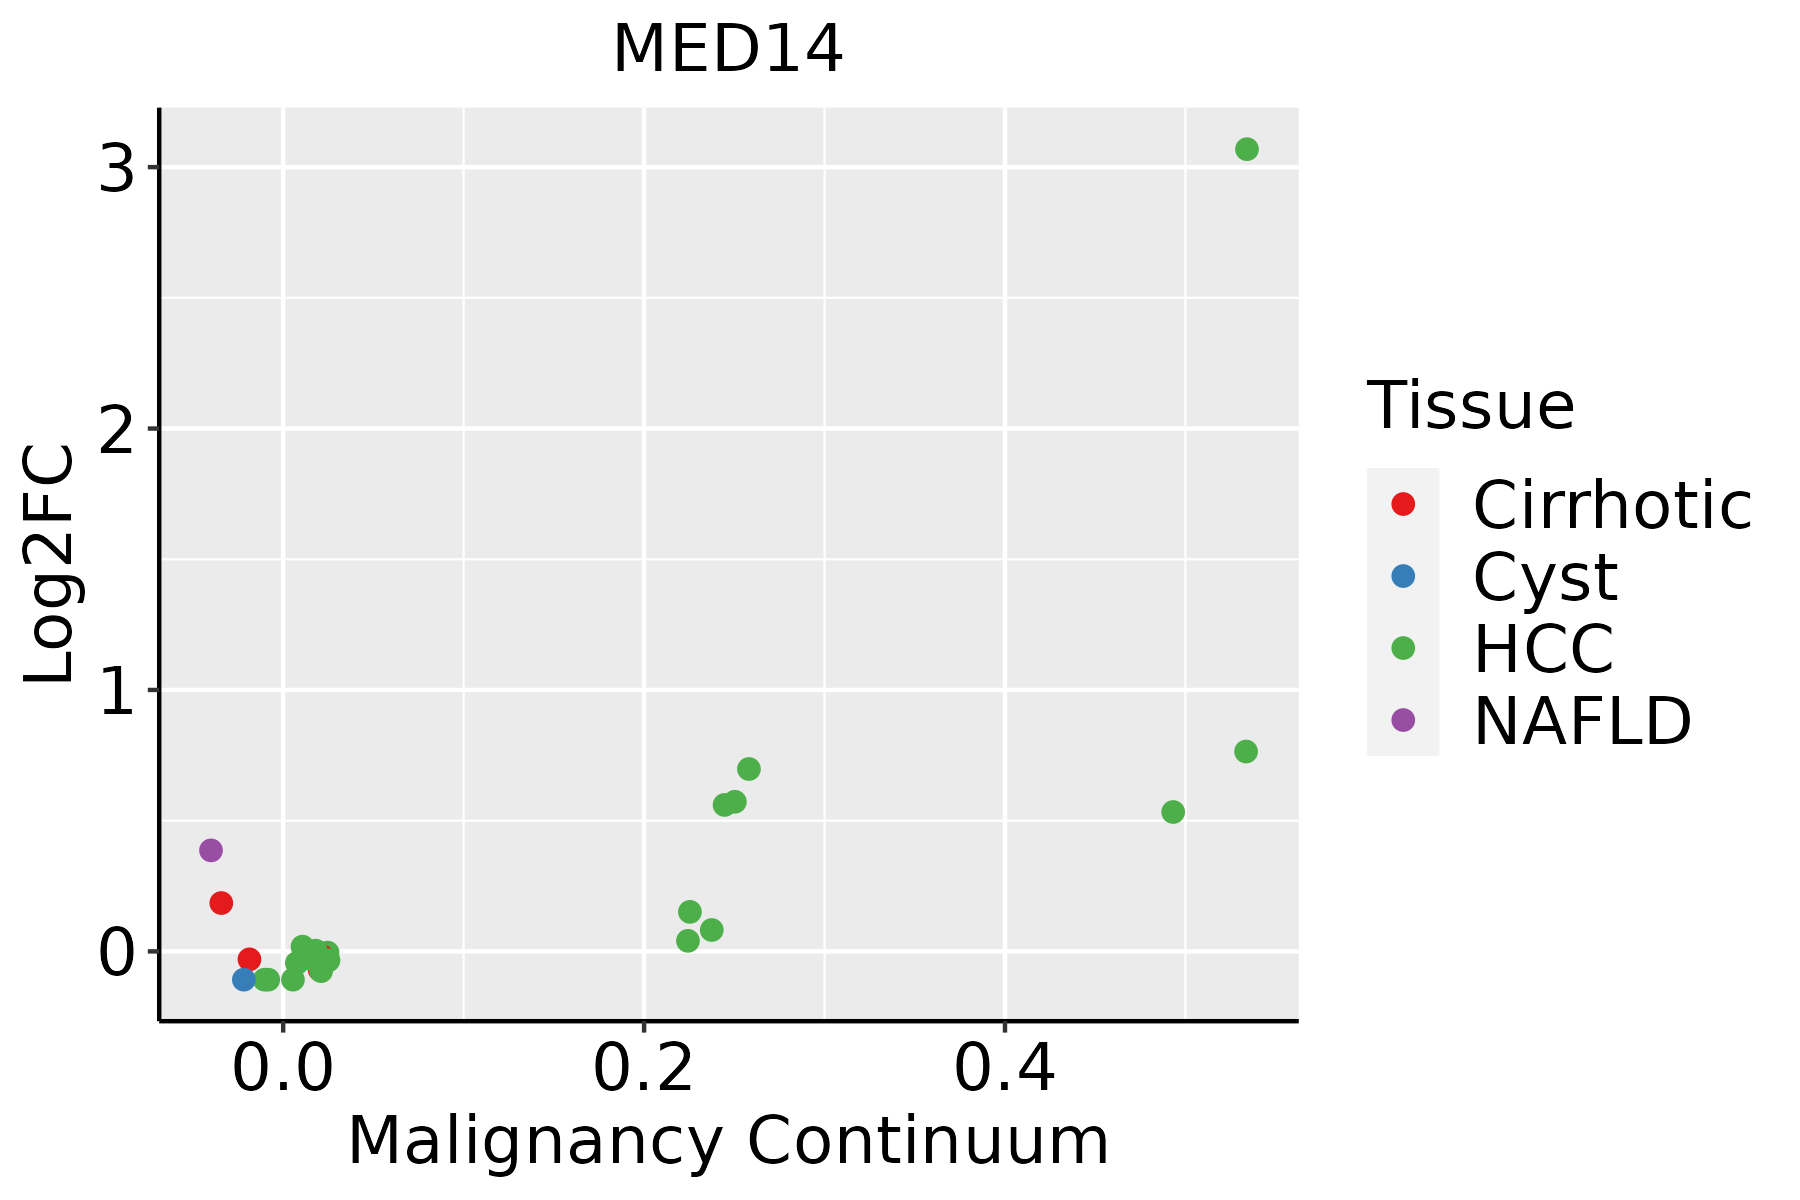 | HCC: Hepatocellular carcinoma |
| NAFLD: Non-alcoholic fatty liver disease | ||
| Lung |  | AAH: Atypical adenomatous hyperplasia |
| AIS: Adenocarcinoma in situ | ||
| IAC: Invasive lung adenocarcinoma | ||
| MIA: Minimally invasive adenocarcinoma | ||
| Oral Cavity |  | EOLP: Erosive Oral lichen planus |
| LP: leukoplakia | ||
| NEOLP: Non-erosive oral lichen planus | ||
| OSCC: Oral squamous cell carcinoma | ||
| Thyroid | 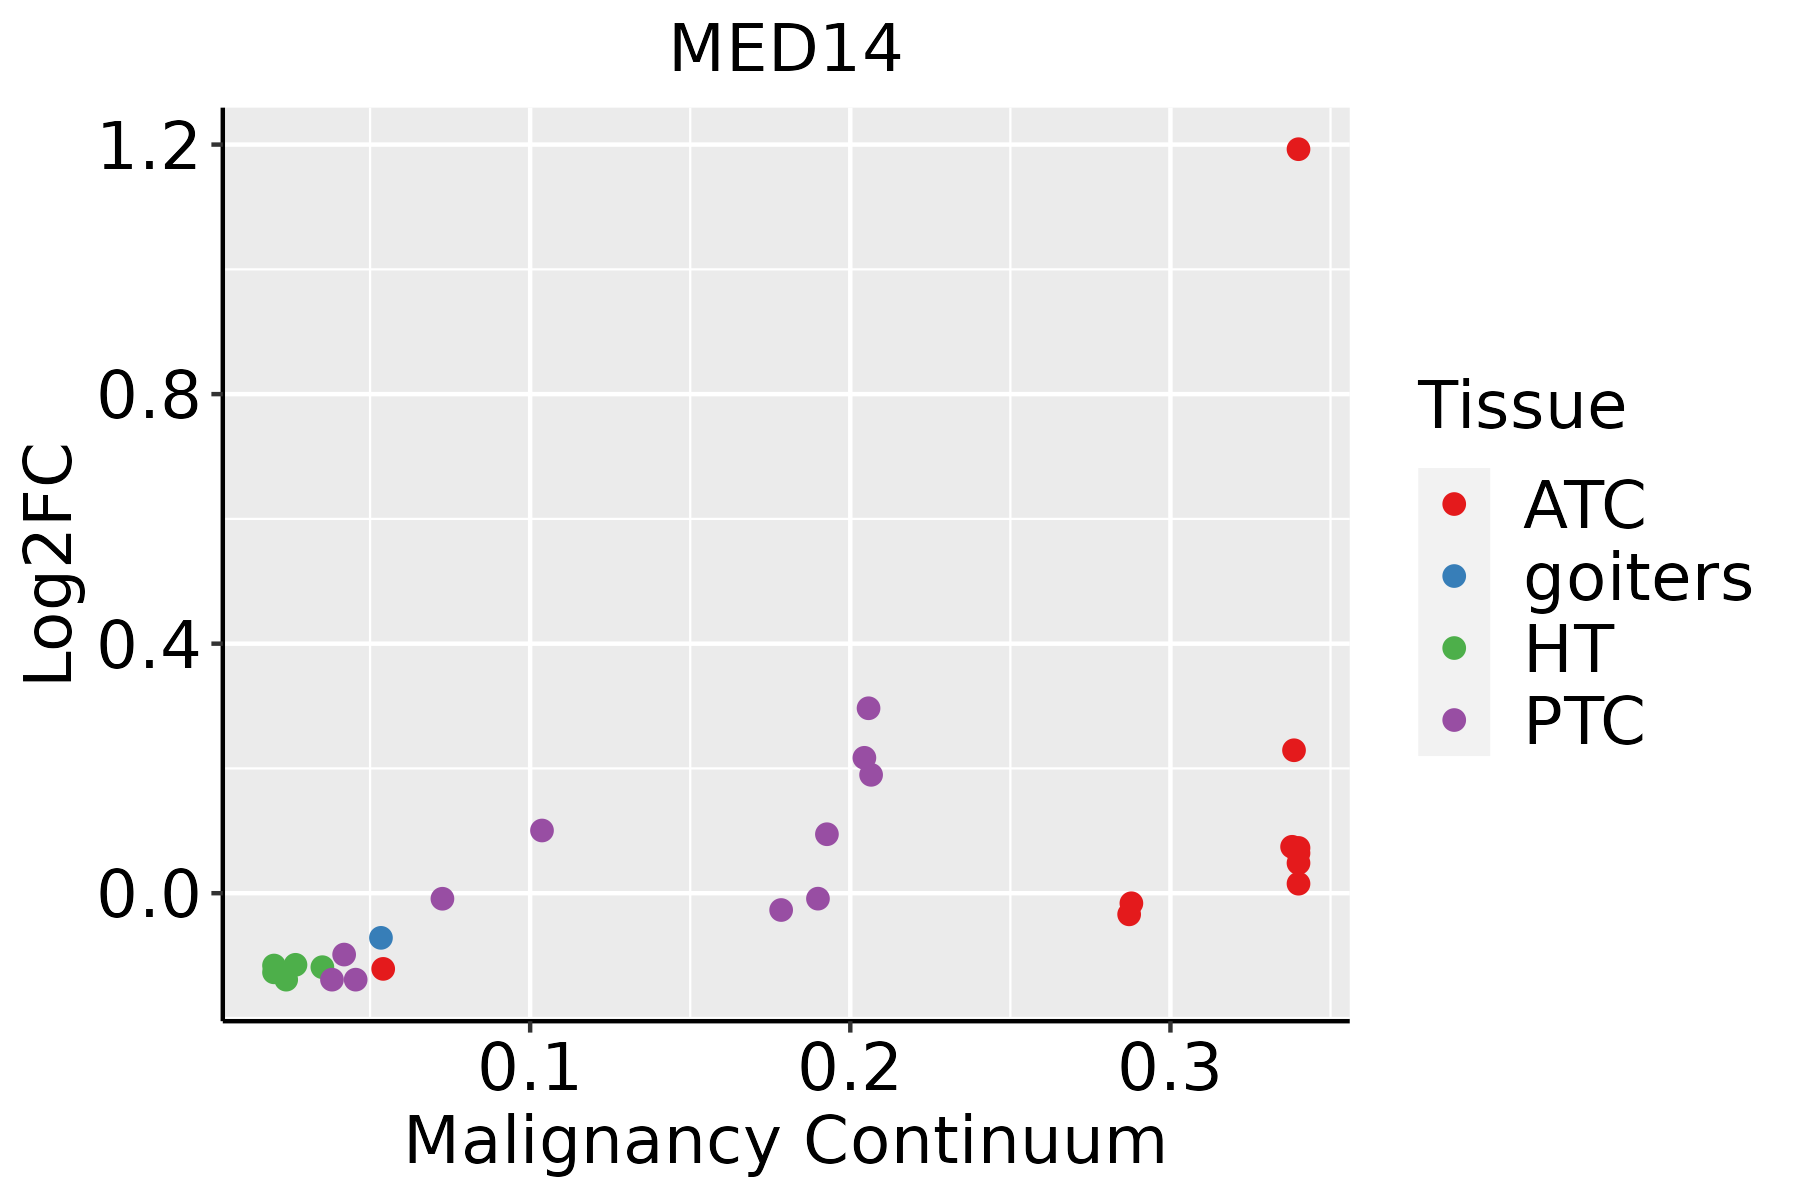 | ATC: Anaplastic thyroid cancer |
| HT: Hashimoto's thyroiditis | ||
| PTC: Papillary thyroid cancer |
| ∗log2FC in expression of this searched gene in stem-like cells from each diseased tissue sample relative to stem-like cells in normal samples in each tissue plotted against the malignancy continuum. Samples are colored based on if they are from different disease stage. |
Top |
Malignant transformation related pathway analysis |
| Find out the enriched GO biological processes and KEGG pathways involved in transition from healthy to precancer to cancer |
| Tissue | Disease Stage | Enriched GO biological Processes |
| Colorectum | AD |  |
| Colorectum | SER |  |
| Colorectum | MSS |  |
| Colorectum | MSI-H |  |
| Colorectum | FAP |  |
| ∗Top 15 enriched GO BP terms are showed in the bar plot of each disease state in each tissue. Each row represents a significant GO biological process which is colored according to the -log10(p.adjust). |
| Page: 1 2 3 4 5 6 7 8 9 |
| GO ID | Tissue | Disease Stage | Description | Gene Ratio | Bg Ratio | pvalue | p.adjust | Count |
| GO:00063671 | Liver | HCC | transcription initiation from RNA polymerase II promoter | 52/7958 | 77/18723 | 7.87e-06 | 9.27e-05 | 52 |
| GO:0006352 | Liver | HCC | DNA-templated transcription, initiation | 78/7958 | 130/18723 | 4.19e-05 | 4.11e-04 | 78 |
| GO:00987272 | Liver | HCC | maintenance of cell number | 77/7958 | 134/18723 | 3.32e-04 | 2.33e-03 | 77 |
| GO:20001421 | Liver | HCC | regulation of DNA-templated transcription, initiation | 28/7958 | 40/18723 | 4.01e-04 | 2.71e-03 | 28 |
| GO:00602601 | Liver | HCC | regulation of transcription initiation from RNA polymerase II promoter | 24/7958 | 33/18723 | 4.24e-04 | 2.85e-03 | 24 |
| GO:00198272 | Liver | HCC | stem cell population maintenance | 75/7958 | 131/18723 | 4.58e-04 | 3.04e-03 | 75 |
| GO:2000144 | Liver | HCC | positive regulation of DNA-templated transcription, initiation | 21/7958 | 31/18723 | 4.01e-03 | 1.76e-02 | 21 |
| GO:0060261 | Liver | HCC | positive regulation of transcription initiation from RNA polymerase II promoter | 17/7958 | 25/18723 | 8.94e-03 | 3.45e-02 | 17 |
| GO:00987274 | Lung | IAC | maintenance of cell number | 25/2061 | 134/18723 | 5.73e-03 | 4.18e-02 | 25 |
| GO:00987277 | Oral cavity | OSCC | maintenance of cell number | 81/7305 | 134/18723 | 3.96e-07 | 5.90e-06 | 81 |
| GO:00198276 | Oral cavity | OSCC | stem cell population maintenance | 79/7305 | 131/18723 | 6.28e-07 | 8.96e-06 | 79 |
| GO:00063522 | Oral cavity | OSCC | DNA-templated transcription, initiation | 74/7305 | 130/18723 | 2.56e-05 | 2.39e-04 | 74 |
| GO:00063672 | Oral cavity | OSCC | transcription initiation from RNA polymerase II promoter | 46/7305 | 77/18723 | 1.82e-04 | 1.24e-03 | 46 |
| GO:20001423 | Oral cavity | OSCC | regulation of DNA-templated transcription, initiation | 26/7305 | 40/18723 | 7.79e-04 | 4.23e-03 | 26 |
| GO:20001442 | Oral cavity | OSCC | positive regulation of DNA-templated transcription, initiation | 21/7305 | 31/18723 | 1.13e-03 | 5.75e-03 | 21 |
| GO:00602602 | Oral cavity | OSCC | regulation of transcription initiation from RNA polymerase II promoter | 21/7305 | 33/18723 | 3.63e-03 | 1.51e-02 | 21 |
| GO:00602611 | Oral cavity | OSCC | positive regulation of transcription initiation from RNA polymerase II promoter | 16/7305 | 25/18723 | 1.00e-02 | 3.49e-02 | 16 |
| GO:000636711 | Oral cavity | LP | transcription initiation from RNA polymerase II promoter | 31/4623 | 77/18723 | 1.83e-03 | 1.38e-02 | 31 |
| GO:20001441 | Oral cavity | LP | positive regulation of DNA-templated transcription, initiation | 15/4623 | 31/18723 | 3.59e-03 | 2.39e-02 | 15 |
| GO:200014211 | Oral cavity | LP | regulation of DNA-templated transcription, initiation | 18/4623 | 40/18723 | 4.00e-03 | 2.59e-02 | 18 |
| Page: 1 2 |
| Pathway ID | Tissue | Disease Stage | Description | Gene Ratio | Bg Ratio | pvalue | p.adjust | qvalue | Count |
| hsa0491912 | Liver | HCC | Thyroid hormone signaling pathway | 75/4020 | 121/8465 | 8.76e-04 | 3.38e-03 | 1.88e-03 | 75 |
| hsa0491913 | Liver | HCC | Thyroid hormone signaling pathway | 75/4020 | 121/8465 | 8.76e-04 | 3.38e-03 | 1.88e-03 | 75 |
| hsa0491914 | Lung | IAC | Thyroid hormone signaling pathway | 27/1053 | 121/8465 | 1.61e-03 | 9.49e-03 | 6.30e-03 | 27 |
| hsa0491915 | Lung | IAC | Thyroid hormone signaling pathway | 27/1053 | 121/8465 | 1.61e-03 | 9.49e-03 | 6.30e-03 | 27 |
| hsa0491926 | Oral cavity | OSCC | Thyroid hormone signaling pathway | 73/3704 | 121/8465 | 1.63e-04 | 5.52e-04 | 2.81e-04 | 73 |
| hsa04919112 | Oral cavity | OSCC | Thyroid hormone signaling pathway | 73/3704 | 121/8465 | 1.63e-04 | 5.52e-04 | 2.81e-04 | 73 |
| hsa0491927 | Oral cavity | EOLP | Thyroid hormone signaling pathway | 32/1218 | 121/8465 | 3.38e-04 | 1.42e-03 | 8.35e-04 | 32 |
| hsa0491935 | Oral cavity | EOLP | Thyroid hormone signaling pathway | 32/1218 | 121/8465 | 3.38e-04 | 1.42e-03 | 8.35e-04 | 32 |
| Page: 1 |
Top |
Cell-cell communication analysis |
| Identification of potential cell-cell interactions between two cell types and their ligand-receptor pairs for different disease states |
| Ligand | Receptor | LRpair | Pathway | Tissue | Disease Stage |
| Page: 1 |
Top |
Single-cell gene regulatory network inference analysis |
| Find out the significant the regulons (TFs) and the target genes of each regulon across cell types for different disease states |
| TF | Cell Type | Tissue | Disease Stage | Target Gene | RSS | Regulon Activity |
| ∗The dot plots of a searched regulon are shown for all cell subpopulations in each disease state of each tissue based on the regulon specific score inferred using pySCENIC and by calculating the average expression. |
| Page: 1 |
Top |
Somatic mutation of malignant transformation related genes |
| Annotation of somatic variants for genes involved in malignant transformation |
| Hugo Symbol | Variant Class | Variant Classification | dbSNP RS | HGVSc | HGVSp | HGVSp Short | SWISSPROT | BIOTYPE | SIFT | PolyPhen | Tumor Sample Barcode | Tissue | Histology | Sex | Age | Stage | Therapy Types | Drugs | Outcome |
| MED14 | SNV | Missense_Mutation | c.2083N>A | p.Glu695Lys | p.E695K | O60244 | protein_coding | tolerated(0.51) | benign(0.262) | TCGA-AC-A23H-01 | Breast | breast invasive carcinoma | Female | >=65 | I/II | Unknown | Unknown | PD | |
| MED14 | SNV | Missense_Mutation | novel | c.1369G>T | p.Asp457Tyr | p.D457Y | O60244 | protein_coding | deleterious(0) | probably_damaging(0.993) | TCGA-AN-A046-01 | Breast | breast invasive carcinoma | Female | >=65 | I/II | Unknown | Unknown | SD |
| MED14 | SNV | Missense_Mutation | c.842N>T | p.Arg281Met | p.R281M | O60244 | protein_coding | deleterious(0) | benign(0.376) | TCGA-AN-A0AK-01 | Breast | breast invasive carcinoma | Female | >=65 | I/II | Unknown | Unknown | SD | |
| MED14 | SNV | Missense_Mutation | novel | c.4336C>T | p.Leu1446Phe | p.L1446F | O60244 | protein_coding | tolerated(0.1) | probably_damaging(0.979) | TCGA-AN-A0FF-01 | Breast | breast invasive carcinoma | Female | <65 | I/II | Unknown | Unknown | SD |
| MED14 | SNV | Missense_Mutation | novel | c.3505N>G | p.Trp1169Gly | p.W1169G | O60244 | protein_coding | deleterious(0.01) | possibly_damaging(0.885) | TCGA-BH-A0C3-01 | Breast | breast invasive carcinoma | Female | <65 | I/II | Chemotherapy | adriamycin | PD |
| MED14 | SNV | Missense_Mutation | novel | c.3505T>G | p.Trp1169Gly | p.W1169G | O60244 | protein_coding | deleterious(0.01) | possibly_damaging(0.885) | TCGA-BH-A1EY-01 | Breast | breast invasive carcinoma | Female | >=65 | I/II | Unknown | Unknown | PD |
| MED14 | SNV | Missense_Mutation | novel | c.4040N>T | p.Pro1347Leu | p.P1347L | O60244 | protein_coding | tolerated(0.27) | possibly_damaging(0.467) | TCGA-E2-A2P6-01 | Breast | breast invasive carcinoma | Female | >=65 | I/II | Hormone Therapy | anastrozole | SD |
| MED14 | SNV | Missense_Mutation | novel | c.614N>A | p.Thr205Asn | p.T205N | O60244 | protein_coding | deleterious(0) | benign(0.049) | TCGA-GM-A2D9-01 | Breast | breast invasive carcinoma | Female | >=65 | I/II | Hormone Therapy | arimidex | SD |
| MED14 | insertion | Nonsense_Mutation | novel | c.1653_1654insACTCATTTTTAATATGAGAAAGAACTAAGATACA | p.Val552ThrfsTer4 | p.V552Tfs*4 | O60244 | protein_coding | TCGA-A8-A06P-01 | Breast | breast invasive carcinoma | Female | <65 | III/IV | Unspecific | SD | |||
| MED14 | insertion | Frame_Shift_Ins | novel | c.2907_2908insTGTAGGCAAGGCTCTTTGGCACATCCTTTAGTTTTGGTTTACG | p.Asn970CysfsTer25 | p.N970Cfs*25 | O60244 | protein_coding | TCGA-A8-A08H-01 | Breast | breast invasive carcinoma | Female | >=65 | I/II | Unknown | Unknown | SD |
| Page: 1 2 3 4 5 6 7 8 9 10 11 12 13 14 15 16 |
Top |
Related drugs of malignant transformation related genes |
| Identification of chemicals and drugs interact with genes involved in malignant transfromation |
| (DGIdb 4.0) |
| Entrez ID | Symbol | Category | Interaction Types | Drug Claim Name | Drug Name | PMIDs |
| Page: 1 |

Copyright 2023-Present -The University of Texas Health Science Center at Houston |