| Tissue | Expression Dynamics | Abbreviation |
| Breast |  | IDC: Invasive ductal carcinoma |
| DCIS: Ductal carcinoma in situ |
| Precancer(BRCA1-mut): Precancerous lesion from BRCA1 mutation carriers |
| Cervix |  | CC: Cervix cancer |
| HSIL_HPV: HPV-infected high-grade squamous intraepithelial lesions |
| N_HPV: HPV-infected normal cervix |
| Colorectum (GSE201348) |  | FAP: Familial adenomatous polyposis |
| CRC: Colorectal cancer |
| Colorectum (HTA11) |  | AD: Adenomas |
| SER: Sessile serrated lesions |
| MSI-H: Microsatellite-high colorectal cancer |
| MSS: Microsatellite stable colorectal cancer |
| Endometrium | 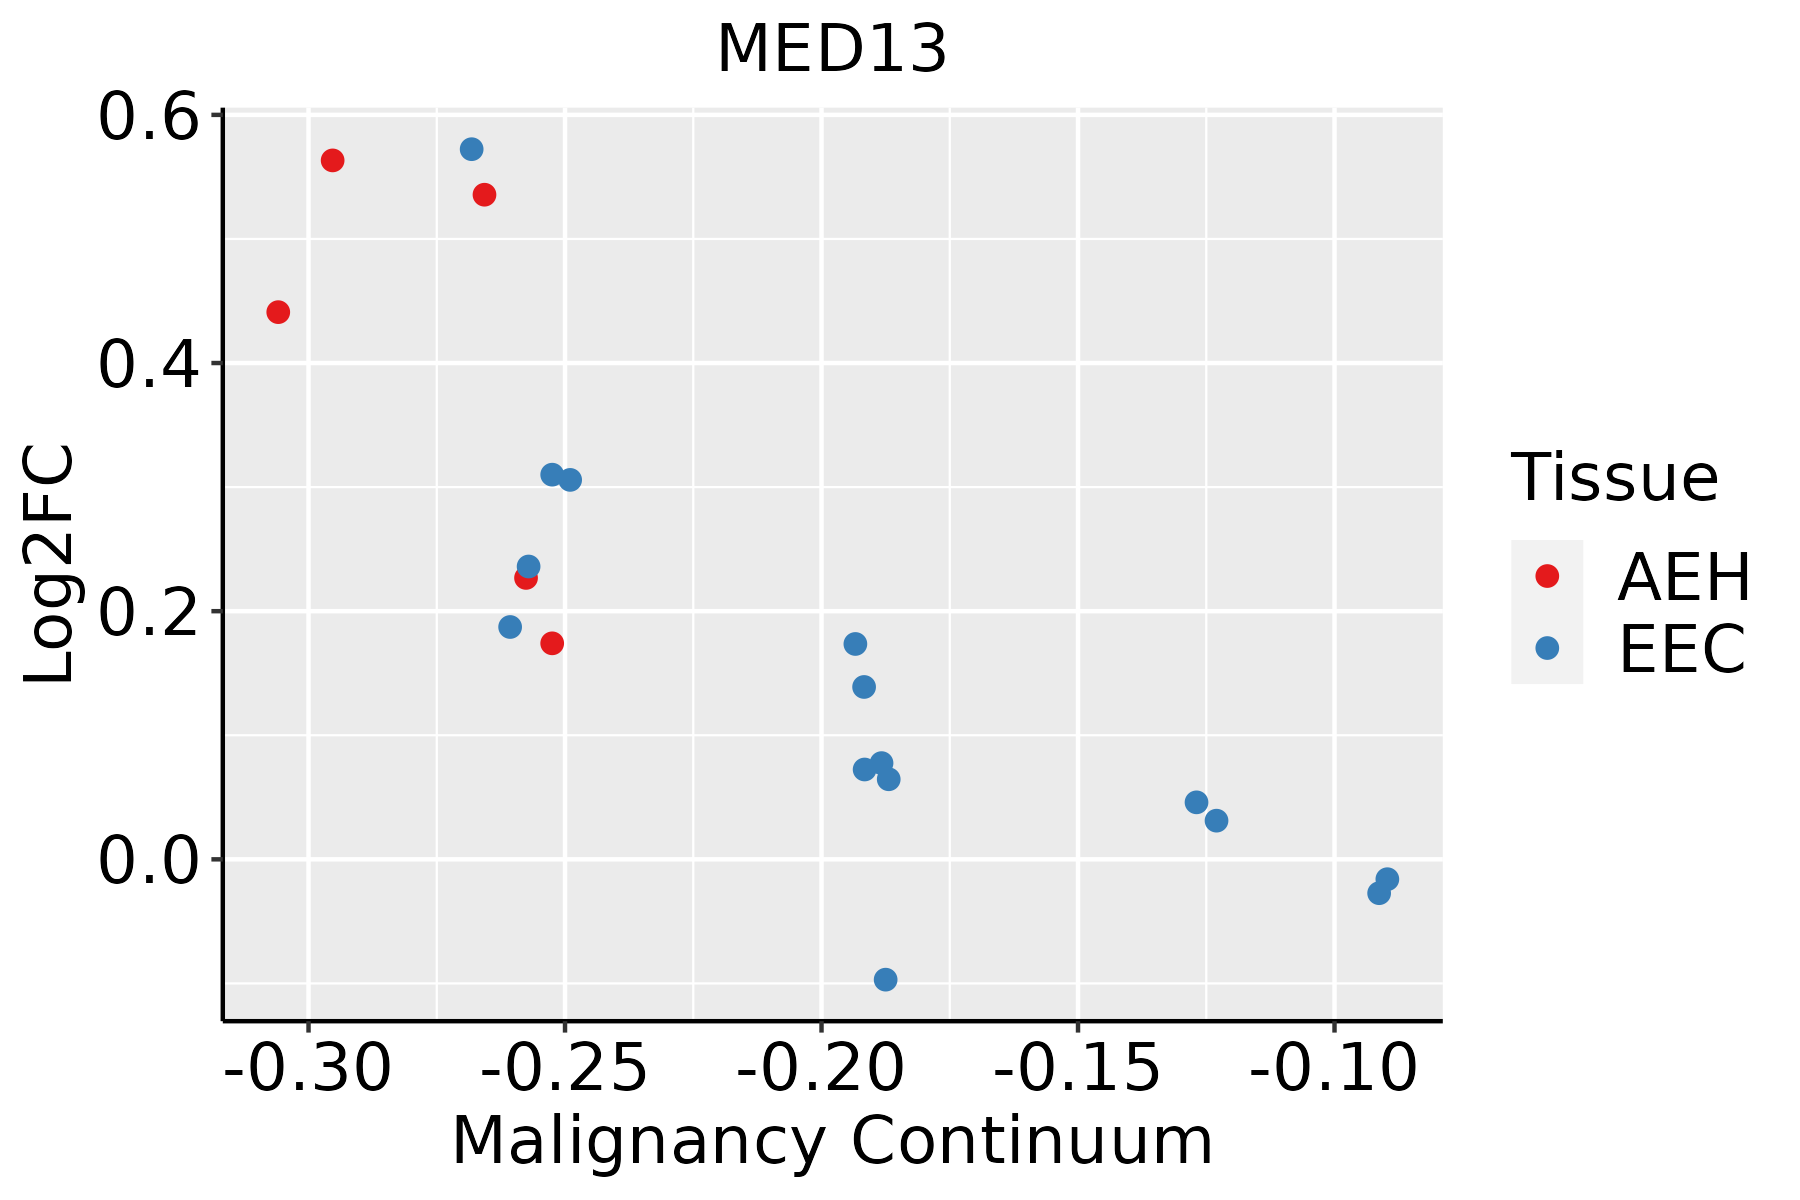 | AEH: Atypical endometrial hyperplasia |
| EEC: Endometrioid Cancer |
| Esophagus |  | ESCC: Esophageal squamous cell carcinoma |
| HGIN: High-grade intraepithelial neoplasias |
| LGIN: Low-grade intraepithelial neoplasias |
| Liver |  | HCC: Hepatocellular carcinoma |
| NAFLD: Non-alcoholic fatty liver disease |
| Lung | 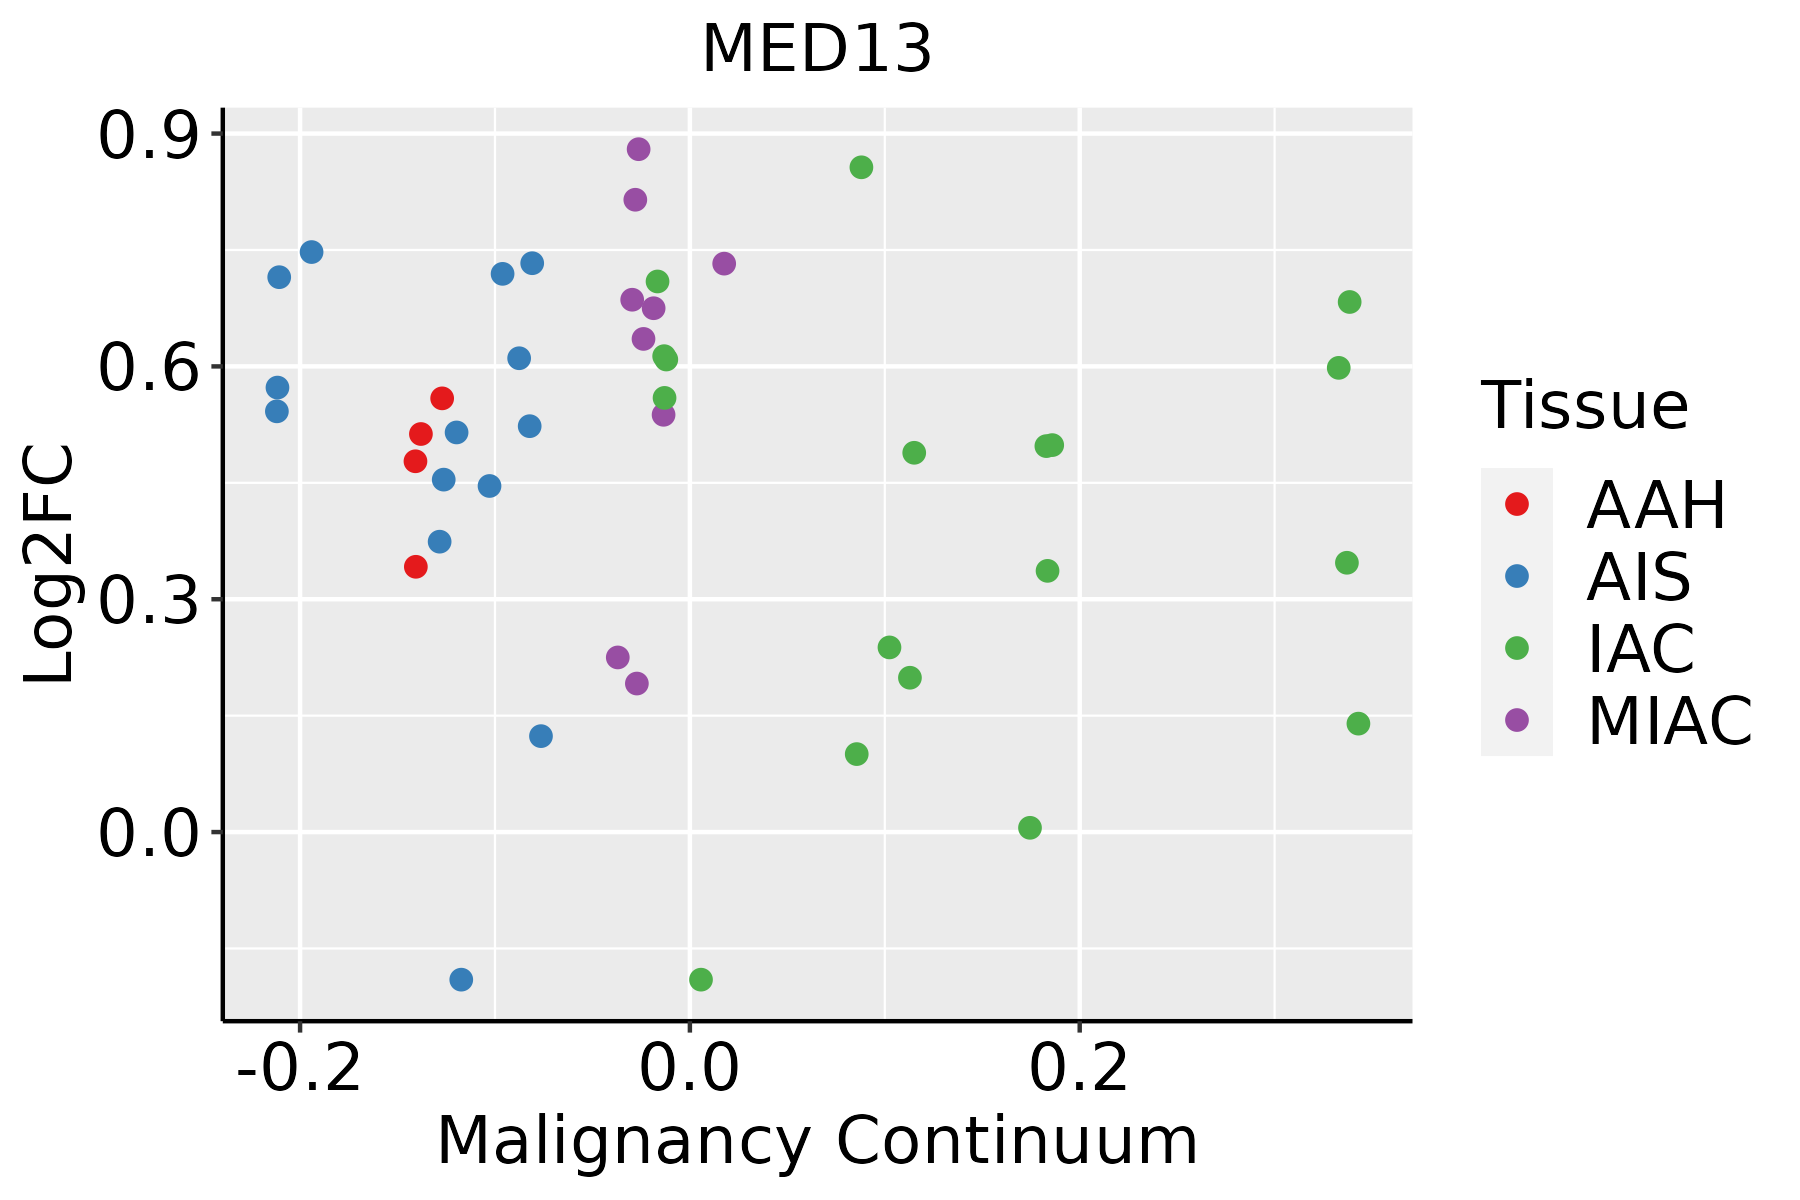 | AAH: Atypical adenomatous hyperplasia |
| AIS: Adenocarcinoma in situ |
| IAC: Invasive lung adenocarcinoma |
| MIA: Minimally invasive adenocarcinoma |
| Oral Cavity | 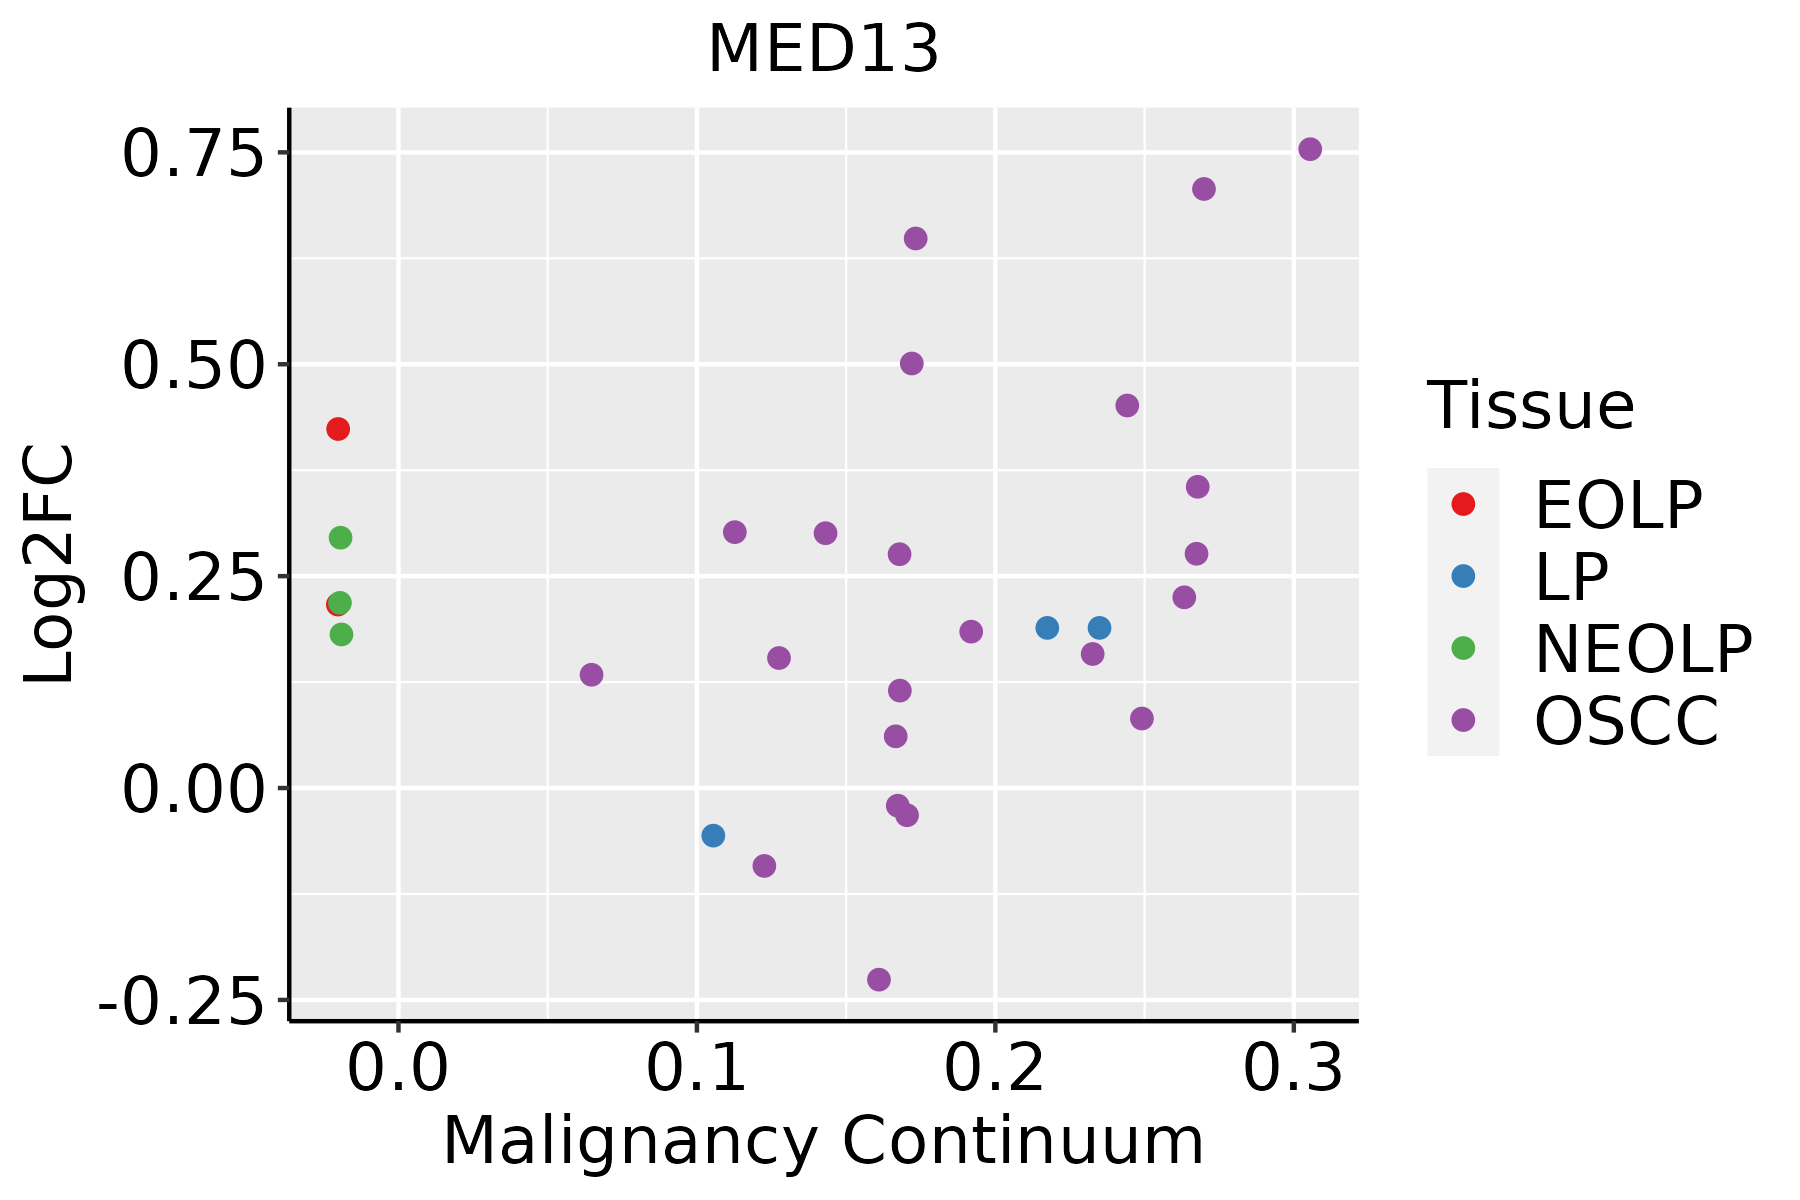 | EOLP: Erosive Oral lichen planus |
| LP: leukoplakia |
| NEOLP: Non-erosive oral lichen planus |
| OSCC: Oral squamous cell carcinoma |
| Prostate | 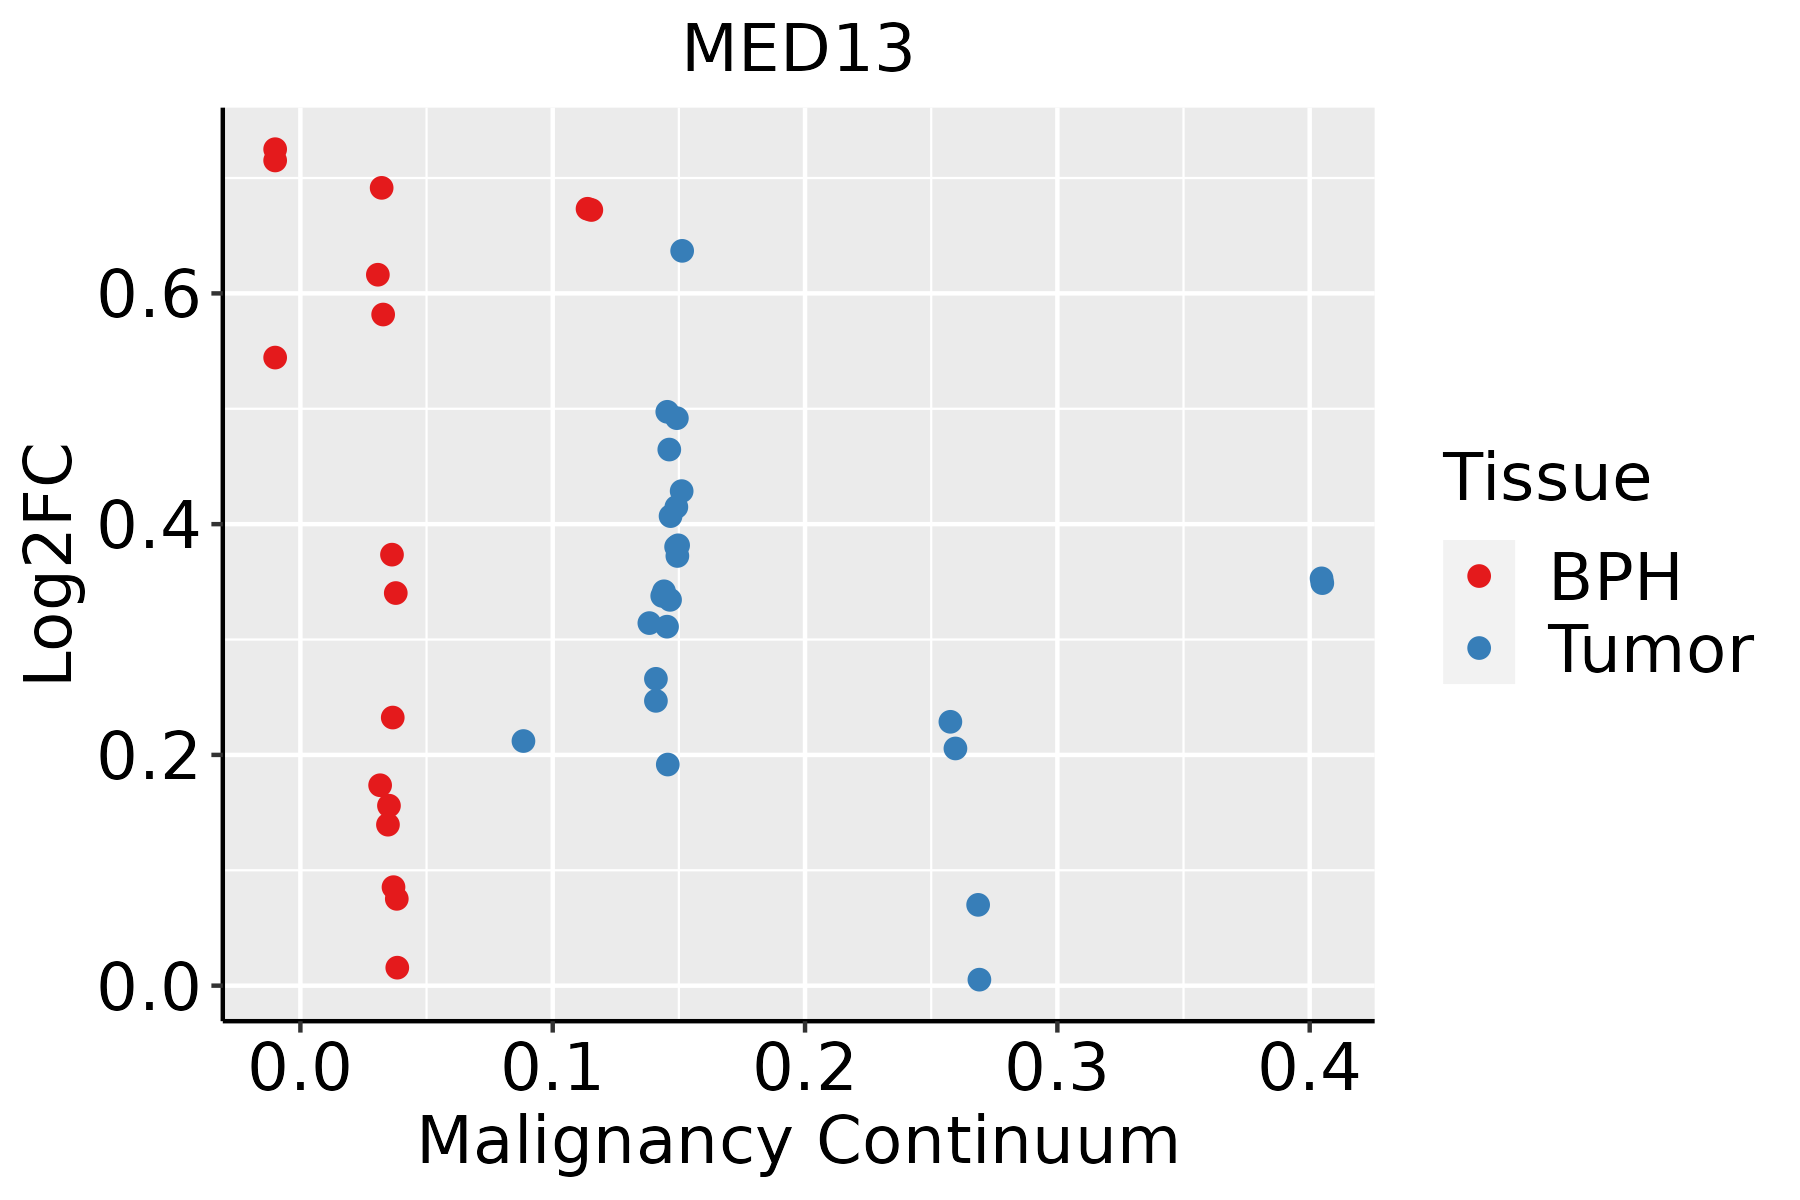 | BPH: Benign Prostatic Hyperplasia |
| Thyroid |  | ATC: Anaplastic thyroid cancer |
| HT: Hashimoto's thyroiditis |
| PTC: Papillary thyroid cancer |
| GO ID | Tissue | Disease Stage | Description | Gene Ratio | Bg Ratio | pvalue | p.adjust | Count |
| GO:00063523 | Esophagus | HGIN | DNA-templated transcription, initiation | 30/2587 | 130/18723 | 2.86e-03 | 2.79e-02 | 30 |
| GO:20001424 | Esophagus | HGIN | regulation of DNA-templated transcription, initiation | 12/2587 | 40/18723 | 6.22e-03 | 4.95e-02 | 12 |
| GO:00063673 | Esophagus | ESCC | transcription initiation from RNA polymerase II promoter | 56/8552 | 77/18723 | 1.30e-06 | 1.59e-05 | 56 |
| GO:000635211 | Esophagus | ESCC | DNA-templated transcription, initiation | 86/8552 | 130/18723 | 1.88e-06 | 2.19e-05 | 86 |
| GO:00602603 | Esophagus | ESCC | regulation of transcription initiation from RNA polymerase II promoter | 25/8552 | 33/18723 | 4.30e-04 | 2.43e-03 | 25 |
| GO:200014212 | Esophagus | ESCC | regulation of DNA-templated transcription, initiation | 29/8552 | 40/18723 | 5.32e-04 | 2.93e-03 | 29 |
| GO:20001443 | Esophagus | ESCC | positive regulation of DNA-templated transcription, initiation | 21/8552 | 31/18723 | 1.10e-02 | 3.70e-02 | 21 |
| GO:0006367 | Liver | Cirrhotic | transcription initiation from RNA polymerase II promoter | 31/4634 | 77/18723 | 1.91e-03 | 1.20e-02 | 31 |
| GO:0060260 | Liver | Cirrhotic | regulation of transcription initiation from RNA polymerase II promoter | 15/4634 | 33/18723 | 7.61e-03 | 3.60e-02 | 15 |
| GO:2000142 | Liver | Cirrhotic | regulation of DNA-templated transcription, initiation | 17/4634 | 40/18723 | 1.04e-02 | 4.61e-02 | 17 |
| GO:00063671 | Liver | HCC | transcription initiation from RNA polymerase II promoter | 52/7958 | 77/18723 | 7.87e-06 | 9.27e-05 | 52 |
| GO:0006352 | Liver | HCC | DNA-templated transcription, initiation | 78/7958 | 130/18723 | 4.19e-05 | 4.11e-04 | 78 |
| GO:20001421 | Liver | HCC | regulation of DNA-templated transcription, initiation | 28/7958 | 40/18723 | 4.01e-04 | 2.71e-03 | 28 |
| GO:00602601 | Liver | HCC | regulation of transcription initiation from RNA polymerase II promoter | 24/7958 | 33/18723 | 4.24e-04 | 2.85e-03 | 24 |
| GO:2000144 | Liver | HCC | positive regulation of DNA-templated transcription, initiation | 21/7958 | 31/18723 | 4.01e-03 | 1.76e-02 | 21 |
| GO:0060261 | Liver | HCC | positive regulation of transcription initiation from RNA polymerase II promoter | 17/7958 | 25/18723 | 8.94e-03 | 3.45e-02 | 17 |
| GO:00063522 | Oral cavity | OSCC | DNA-templated transcription, initiation | 74/7305 | 130/18723 | 2.56e-05 | 2.39e-04 | 74 |
| GO:00063672 | Oral cavity | OSCC | transcription initiation from RNA polymerase II promoter | 46/7305 | 77/18723 | 1.82e-04 | 1.24e-03 | 46 |
| GO:20001423 | Oral cavity | OSCC | regulation of DNA-templated transcription, initiation | 26/7305 | 40/18723 | 7.79e-04 | 4.23e-03 | 26 |
| GO:20001442 | Oral cavity | OSCC | positive regulation of DNA-templated transcription, initiation | 21/7305 | 31/18723 | 1.13e-03 | 5.75e-03 | 21 |
| Pathway ID | Tissue | Disease Stage | Description | Gene Ratio | Bg Ratio | pvalue | p.adjust | qvalue | Count |
| hsa0491916 | Breast | IDC | Thyroid hormone signaling pathway | 23/867 | 121/8465 | 2.45e-03 | 1.69e-02 | 1.27e-02 | 23 |
| hsa0491917 | Breast | IDC | Thyroid hormone signaling pathway | 23/867 | 121/8465 | 2.45e-03 | 1.69e-02 | 1.27e-02 | 23 |
| hsa0491922 | Breast | DCIS | Thyroid hormone signaling pathway | 23/846 | 121/8465 | 1.78e-03 | 1.22e-02 | 9.00e-03 | 23 |
| hsa0491932 | Breast | DCIS | Thyroid hormone signaling pathway | 23/846 | 121/8465 | 1.78e-03 | 1.22e-02 | 9.00e-03 | 23 |
| hsa0491918 | Cervix | CC | Thyroid hormone signaling pathway | 33/1267 | 121/8465 | 3.11e-04 | 1.65e-03 | 9.78e-04 | 33 |
| hsa0491919 | Cervix | CC | Thyroid hormone signaling pathway | 33/1267 | 121/8465 | 3.11e-04 | 1.65e-03 | 9.78e-04 | 33 |
| hsa04919 | Colorectum | AD | Thyroid hormone signaling pathway | 51/2092 | 121/8465 | 1.71e-05 | 1.73e-04 | 1.10e-04 | 51 |
| hsa049191 | Colorectum | AD | Thyroid hormone signaling pathway | 51/2092 | 121/8465 | 1.71e-05 | 1.73e-04 | 1.10e-04 | 51 |
| hsa049196 | Colorectum | MSI-H | Thyroid hormone signaling pathway | 21/797 | 121/8465 | 4.18e-03 | 4.10e-02 | 3.44e-02 | 21 |
| hsa049197 | Colorectum | MSI-H | Thyroid hormone signaling pathway | 21/797 | 121/8465 | 4.18e-03 | 4.10e-02 | 3.44e-02 | 21 |
| hsa049198 | Colorectum | FAP | Thyroid hormone signaling pathway | 41/1404 | 121/8465 | 2.28e-06 | 4.28e-05 | 2.60e-05 | 41 |
| hsa049199 | Colorectum | FAP | Thyroid hormone signaling pathway | 41/1404 | 121/8465 | 2.28e-06 | 4.28e-05 | 2.60e-05 | 41 |
| hsa0491910 | Colorectum | CRC | Thyroid hormone signaling pathway | 35/1091 | 121/8465 | 2.05e-06 | 6.85e-05 | 4.64e-05 | 35 |
| hsa0491911 | Colorectum | CRC | Thyroid hormone signaling pathway | 35/1091 | 121/8465 | 2.05e-06 | 6.85e-05 | 4.64e-05 | 35 |
| hsa0491920 | Endometrium | AEH | Thyroid hormone signaling pathway | 30/1197 | 121/8465 | 1.20e-03 | 7.52e-03 | 5.50e-03 | 30 |
| hsa04919110 | Endometrium | AEH | Thyroid hormone signaling pathway | 30/1197 | 121/8465 | 1.20e-03 | 7.52e-03 | 5.50e-03 | 30 |
| hsa0491923 | Endometrium | EEC | Thyroid hormone signaling pathway | 29/1237 | 121/8465 | 4.08e-03 | 2.24e-02 | 1.67e-02 | 29 |
| hsa0491933 | Endometrium | EEC | Thyroid hormone signaling pathway | 29/1237 | 121/8465 | 4.08e-03 | 2.24e-02 | 1.67e-02 | 29 |
| hsa0491928 | Esophagus | ESCC | Thyroid hormone signaling pathway | 78/4205 | 121/8465 | 6.79e-04 | 2.23e-03 | 1.14e-03 | 78 |
| hsa04919113 | Esophagus | ESCC | Thyroid hormone signaling pathway | 78/4205 | 121/8465 | 6.79e-04 | 2.23e-03 | 1.14e-03 | 78 |
| Hugo Symbol | Variant Class | Variant Classification | dbSNP RS | HGVSc | HGVSp | HGVSp Short | SWISSPROT | BIOTYPE | SIFT | PolyPhen | Tumor Sample Barcode | Tissue | Histology | Sex | Age | Stage | Therapy Types | Drugs | Outcome |
| MED13 | SNV | Missense_Mutation | | c.4298A>T | p.Glu1433Val | p.E1433V | Q9UHV7 | protein_coding | deleterious(0) | possibly_damaging(0.806) | TCGA-A8-A09G-01 | Breast | breast invasive carcinoma | Female | >=65 | III/IV | Unknown | Unknown | SD |
| MED13 | SNV | Missense_Mutation | | c.3757N>A | p.Glu1253Lys | p.E1253K | Q9UHV7 | protein_coding | deleterious(0.01) | probably_damaging(0.98) | TCGA-AC-A23H-01 | Breast | breast invasive carcinoma | Female | >=65 | I/II | Unknown | Unknown | PD |
| MED13 | SNV | Missense_Mutation | | c.2621N>G | p.Ser874Cys | p.S874C | Q9UHV7 | protein_coding | tolerated(0.07) | benign(0.003) | TCGA-AC-A23H-01 | Breast | breast invasive carcinoma | Female | >=65 | I/II | Unknown | Unknown | PD |
| MED13 | SNV | Missense_Mutation | | c.2161N>C | p.Glu721Gln | p.E721Q | Q9UHV7 | protein_coding | deleterious(0.01) | possibly_damaging(0.815) | TCGA-AC-A23H-01 | Breast | breast invasive carcinoma | Female | >=65 | I/II | Unknown | Unknown | PD |
| MED13 | SNV | Missense_Mutation | | c.1526N>T | p.Ser509Leu | p.S509L | Q9UHV7 | protein_coding | tolerated(0.14) | benign(0.01) | TCGA-AC-A23H-01 | Breast | breast invasive carcinoma | Female | >=65 | I/II | Unknown | Unknown | PD |
| MED13 | SNV | Missense_Mutation | rs147399023 | c.3452N>A | p.Arg1151His | p.R1151H | Q9UHV7 | protein_coding | deleterious(0.02) | probably_damaging(0.991) | TCGA-AN-A0AK-01 | Breast | breast invasive carcinoma | Female | >=65 | I/II | Unknown | Unknown | SD |
| MED13 | SNV | Missense_Mutation | | c.6513N>C | p.Met2171Ile | p.M2171I | Q9UHV7 | protein_coding | deleterious(0.05) | benign(0.098) | TCGA-AN-A0XW-01 | Breast | breast invasive carcinoma | Female | <65 | III/IV | Unknown | Unknown | SD |
| MED13 | SNV | Missense_Mutation | | c.5032N>T | p.Pro1678Ser | p.P1678S | Q9UHV7 | protein_coding | deleterious(0.01) | probably_damaging(0.999) | TCGA-AN-A0XW-01 | Breast | breast invasive carcinoma | Female | <65 | III/IV | Unknown | Unknown | SD |
| MED13 | SNV | Missense_Mutation | | c.1950T>A | p.Ser650Arg | p.S650R | Q9UHV7 | protein_coding | tolerated(0.1) | benign(0.024) | TCGA-AO-A124-01 | Breast | breast invasive carcinoma | Female | <65 | I/II | Chemotherapy | doxorubicin | SD |
| MED13 | SNV | Missense_Mutation | | c.2366N>G | p.Ser789Cys | p.S789C | Q9UHV7 | protein_coding | deleterious(0) | probably_damaging(0.921) | TCGA-AR-A255-01 | Breast | breast invasive carcinoma | Female | <65 | I/II | Targeted Molecular therapy | trastuzumab | SD |


