
|
|||||
|
 | |
| |
| |
| |
| |
| |
|
Gene: MED12 |
Gene summary for MED12 |
| Gene information | Species | Human | Gene symbol | MED12 | Gene ID | 9968 |
| Gene name | mediator complex subunit 12 | |
| Gene Alias | ARC240 | |
| Cytomap | Xq13.1 | |
| Gene Type | protein-coding | GO ID | GO:0001501 | UniProtAcc | Q93074 |
Top |
Malignant transformation analysis |
| Identification of the aberrant gene expression in precancerous and cancerous lesions by comparing the gene expression of stem-like cells in diseased tissues with normal stem cells |
| Entrez ID | Symbol | Replicates | Species | Organ | Tissue | Adj P-value | Log2FC | Malignancy |
| 9968 | MED12 | LZE7T | Human | Esophagus | ESCC | 9.32e-08 | 4.72e-01 | 0.0667 |
| 9968 | MED12 | LZE8T | Human | Esophagus | ESCC | 2.72e-03 | 1.10e-01 | 0.067 |
| 9968 | MED12 | LZE24T | Human | Esophagus | ESCC | 8.28e-18 | 3.57e-01 | 0.0596 |
| 9968 | MED12 | LZE21T | Human | Esophagus | ESCC | 8.02e-04 | 2.19e-01 | 0.0655 |
| 9968 | MED12 | P1T-E | Human | Esophagus | ESCC | 5.20e-08 | 2.96e-01 | 0.0875 |
| 9968 | MED12 | P2T-E | Human | Esophagus | ESCC | 1.07e-09 | 2.18e-01 | 0.1177 |
| 9968 | MED12 | P4T-E | Human | Esophagus | ESCC | 1.75e-05 | 1.15e-01 | 0.1323 |
| 9968 | MED12 | P5T-E | Human | Esophagus | ESCC | 3.98e-02 | 2.52e-02 | 0.1327 |
| 9968 | MED12 | P8T-E | Human | Esophagus | ESCC | 4.62e-14 | 2.51e-01 | 0.0889 |
| 9968 | MED12 | P9T-E | Human | Esophagus | ESCC | 2.30e-02 | 5.96e-02 | 0.1131 |
| 9968 | MED12 | P11T-E | Human | Esophagus | ESCC | 3.25e-05 | 1.73e-01 | 0.1426 |
| 9968 | MED12 | P12T-E | Human | Esophagus | ESCC | 9.52e-10 | 2.07e-01 | 0.1122 |
| 9968 | MED12 | P15T-E | Human | Esophagus | ESCC | 2.11e-03 | 7.07e-02 | 0.1149 |
| 9968 | MED12 | P16T-E | Human | Esophagus | ESCC | 2.04e-09 | 2.34e-01 | 0.1153 |
| 9968 | MED12 | P17T-E | Human | Esophagus | ESCC | 1.29e-08 | 2.65e-01 | 0.1278 |
| 9968 | MED12 | P21T-E | Human | Esophagus | ESCC | 5.07e-04 | 8.42e-02 | 0.1617 |
| 9968 | MED12 | P22T-E | Human | Esophagus | ESCC | 1.67e-17 | 1.79e-01 | 0.1236 |
| 9968 | MED12 | P23T-E | Human | Esophagus | ESCC | 1.99e-08 | 1.65e-01 | 0.108 |
| 9968 | MED12 | P24T-E | Human | Esophagus | ESCC | 1.71e-07 | 1.41e-01 | 0.1287 |
| 9968 | MED12 | P26T-E | Human | Esophagus | ESCC | 6.15e-08 | 2.02e-01 | 0.1276 |
| Page: 1 2 3 4 |
| Tissue | Expression Dynamics | Abbreviation |
| Esophagus | 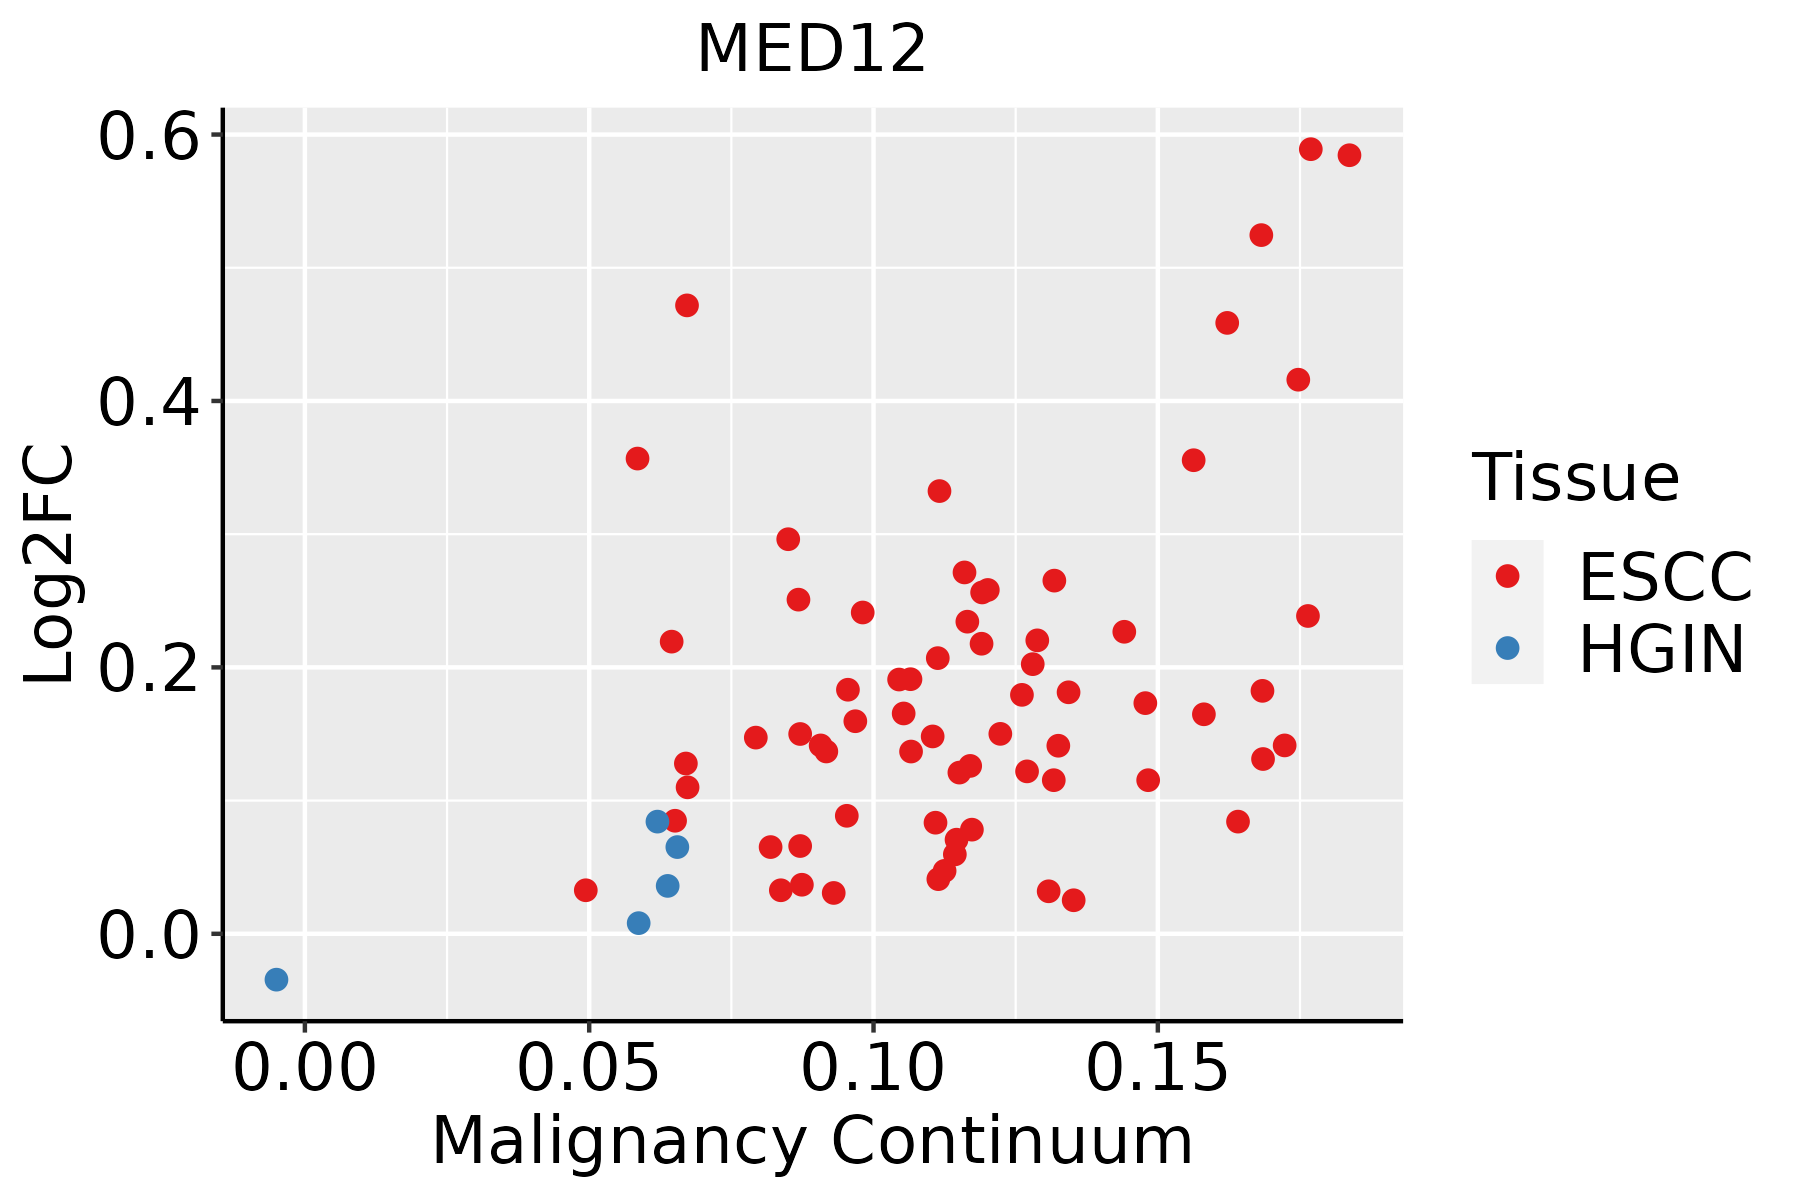 | ESCC: Esophageal squamous cell carcinoma |
| HGIN: High-grade intraepithelial neoplasias | ||
| LGIN: Low-grade intraepithelial neoplasias | ||
| Liver |  | HCC: Hepatocellular carcinoma |
| NAFLD: Non-alcoholic fatty liver disease |
| ∗log2FC in expression of this searched gene in stem-like cells from each diseased tissue sample relative to stem-like cells in normal samples in each tissue plotted against the malignancy continuum. Samples are colored based on if they are from different disease stage. |
Top |
Malignant transformation related pathway analysis |
| Find out the enriched GO biological processes and KEGG pathways involved in transition from healthy to precancer to cancer |
| Tissue | Disease Stage | Enriched GO biological Processes |
| Colorectum | AD |  |
| Colorectum | SER |  |
| Colorectum | MSS |  |
| Colorectum | MSI-H |  |
| Colorectum | FAP |  |
| ∗Top 15 enriched GO BP terms are showed in the bar plot of each disease state in each tissue. Each row represents a significant GO biological process which is colored according to the -log10(p.adjust). |
| Page: 1 2 3 4 5 6 7 8 9 |
| GO ID | Tissue | Disease Stage | Description | Gene Ratio | Bg Ratio | pvalue | p.adjust | Count |
| GO:001605517 | Esophagus | ESCC | Wnt signaling pathway | 268/8552 | 444/18723 | 2.32e-10 | 6.58e-09 | 268 |
| GO:019873817 | Esophagus | ESCC | cell-cell signaling by wnt | 269/8552 | 446/18723 | 2.41e-10 | 6.79e-09 | 269 |
| GO:000184115 | Esophagus | ESCC | neural tube formation | 75/8552 | 102/18723 | 9.68e-09 | 1.95e-07 | 75 |
| GO:000184314 | Esophagus | ESCC | neural tube closure | 66/8552 | 88/18723 | 1.98e-08 | 3.82e-07 | 66 |
| GO:001402014 | Esophagus | ESCC | primary neural tube formation | 69/8552 | 94/18723 | 4.22e-08 | 7.76e-07 | 69 |
| GO:006060614 | Esophagus | ESCC | tube closure | 66/8552 | 89/18723 | 4.24e-08 | 7.76e-07 | 66 |
| GO:00219159 | Esophagus | ESCC | neural tube development | 101/8552 | 152/18723 | 1.78e-07 | 2.79e-06 | 101 |
| GO:00163316 | Esophagus | ESCC | morphogenesis of embryonic epithelium | 98/8552 | 147/18723 | 2.12e-07 | 3.27e-06 | 98 |
| GO:000183814 | Esophagus | ESCC | embryonic epithelial tube formation | 83/8552 | 121/18723 | 2.78e-07 | 4.08e-06 | 83 |
| GO:009872714 | Esophagus | ESCC | maintenance of cell number | 90/8552 | 134/18723 | 3.94e-07 | 5.43e-06 | 90 |
| GO:001982714 | Esophagus | ESCC | stem cell population maintenance | 88/8552 | 131/18723 | 5.23e-07 | 6.97e-06 | 88 |
| GO:006007016 | Esophagus | ESCC | canonical Wnt signaling pathway | 180/8552 | 303/18723 | 9.15e-07 | 1.17e-05 | 180 |
| GO:00063673 | Esophagus | ESCC | transcription initiation from RNA polymerase II promoter | 56/8552 | 77/18723 | 1.30e-06 | 1.59e-05 | 56 |
| GO:003514815 | Esophagus | ESCC | tube formation | 96/8552 | 148/18723 | 1.86e-06 | 2.16e-05 | 96 |
| GO:000635211 | Esophagus | ESCC | DNA-templated transcription, initiation | 86/8552 | 130/18723 | 1.88e-06 | 2.19e-05 | 86 |
| GO:00721759 | Esophagus | ESCC | epithelial tube formation | 86/8552 | 132/18723 | 4.81e-06 | 5.10e-05 | 86 |
| GO:006056210 | Esophagus | ESCC | epithelial tube morphogenesis | 187/8552 | 325/18723 | 9.95e-06 | 9.44e-05 | 187 |
| GO:00074926 | Esophagus | ESCC | endoderm development | 54/8552 | 77/18723 | 1.20e-05 | 1.12e-04 | 54 |
| GO:00017387 | Esophagus | ESCC | morphogenesis of a polarized epithelium | 63/8552 | 94/18723 | 2.34e-05 | 2.00e-04 | 63 |
| GO:00420636 | Esophagus | ESCC | gliogenesis | 172/8552 | 301/18723 | 3.75e-05 | 3.04e-04 | 172 |
| Page: 1 2 3 |
| Pathway ID | Tissue | Disease Stage | Description | Gene Ratio | Bg Ratio | pvalue | p.adjust | qvalue | Count |
| hsa0491928 | Esophagus | ESCC | Thyroid hormone signaling pathway | 78/4205 | 121/8465 | 6.79e-04 | 2.23e-03 | 1.14e-03 | 78 |
| hsa04919113 | Esophagus | ESCC | Thyroid hormone signaling pathway | 78/4205 | 121/8465 | 6.79e-04 | 2.23e-03 | 1.14e-03 | 78 |
| hsa0491912 | Liver | HCC | Thyroid hormone signaling pathway | 75/4020 | 121/8465 | 8.76e-04 | 3.38e-03 | 1.88e-03 | 75 |
| hsa0491913 | Liver | HCC | Thyroid hormone signaling pathway | 75/4020 | 121/8465 | 8.76e-04 | 3.38e-03 | 1.88e-03 | 75 |
| Page: 1 |
Top |
Cell-cell communication analysis |
| Identification of potential cell-cell interactions between two cell types and their ligand-receptor pairs for different disease states |
| Ligand | Receptor | LRpair | Pathway | Tissue | Disease Stage |
| Page: 1 |
Top |
Single-cell gene regulatory network inference analysis |
| Find out the significant the regulons (TFs) and the target genes of each regulon across cell types for different disease states |
| TF | Cell Type | Tissue | Disease Stage | Target Gene | RSS | Regulon Activity |
| ∗The dot plots of a searched regulon are shown for all cell subpopulations in each disease state of each tissue based on the regulon specific score inferred using pySCENIC and by calculating the average expression. |
| Page: 1 |
Top |
Somatic mutation of malignant transformation related genes |
| Annotation of somatic variants for genes involved in malignant transformation |
| Hugo Symbol | Variant Class | Variant Classification | dbSNP RS | HGVSc | HGVSp | HGVSp Short | SWISSPROT | BIOTYPE | SIFT | PolyPhen | Tumor Sample Barcode | Tissue | Histology | Sex | Age | Stage | Therapy Types | Drugs | Outcome |
| MED12 | SNV | Missense_Mutation | c.6476A>G | p.Gln2159Arg | p.Q2159R | Q93074 | protein_coding | deleterious_low_confidence(0.01) | possibly_damaging(0.775) | TCGA-A1-A0SG-01 | Breast | breast invasive carcinoma | Female | <65 | I/II | Chemotherapy | SD | ||
| MED12 | SNV | Missense_Mutation | c.2499N>G | p.Phe833Leu | p.F833L | Q93074 | protein_coding | tolerated(0.49) | benign(0.007) | TCGA-A2-A25A-01 | Breast | breast invasive carcinoma | Female | <65 | I/II | Unspecific | Cytoxan | SD | |
| MED12 | SNV | Missense_Mutation | c.522N>T | p.Lys174Asn | p.K174N | Q93074 | protein_coding | deleterious(0) | benign(0.037) | TCGA-A8-A07L-01 | Breast | breast invasive carcinoma | Female | <65 | III/IV | Chemotherapy | CR | ||
| MED12 | SNV | Missense_Mutation | c.701N>T | p.Asp234Val | p.D234V | Q93074 | protein_coding | deleterious(0.03) | benign(0.103) | TCGA-A8-A083-01 | Breast | breast invasive carcinoma | Female | >=65 | I/II | Unknown | Unknown | SD | |
| MED12 | SNV | Missense_Mutation | c.4141A>T | p.Asn1381Tyr | p.N1381Y | Q93074 | protein_coding | tolerated(0.08) | possibly_damaging(0.476) | TCGA-AC-A23C-01 | Breast | breast invasive carcinoma | Female | <65 | I/II | Chemotherapy | chemo | CR | |
| MED12 | SNV | Missense_Mutation | c.4236N>C | p.Lys1412Asn | p.K1412N | Q93074 | protein_coding | tolerated(0.24) | benign(0.196) | TCGA-AR-A0TX-01 | Breast | breast invasive carcinoma | Female | <65 | I/II | Unknown | Unknown | SD | |
| MED12 | SNV | Missense_Mutation | rs374390933 | c.5138N>A | p.Arg1713Gln | p.R1713Q | Q93074 | protein_coding | deleterious(0) | benign(0.012) | TCGA-AR-A24Q-01 | Breast | breast invasive carcinoma | Female | <65 | I/II | Chemotherapy | doxorubicin | SD |
| MED12 | SNV | Missense_Mutation | c.6490N>G | p.Asn2164Asp | p.N2164D | Q93074 | protein_coding | tolerated_low_confidence(0.09) | benign(0.074) | TCGA-B6-A0I6-01 | Breast | breast invasive carcinoma | Female | <65 | I/II | Unknown | Unknown | PD | |
| MED12 | SNV | Missense_Mutation | c.5896N>G | p.Pro1966Ala | p.P1966A | Q93074 | protein_coding | deleterious_low_confidence(0.01) | benign(0.025) | TCGA-B6-A0RS-01 | Breast | breast invasive carcinoma | Female | <65 | I/II | Unknown | Unknown | PD | |
| MED12 | SNV | Missense_Mutation | c.3230T>A | p.Leu1077Gln | p.L1077Q | Q93074 | protein_coding | deleterious(0) | probably_damaging(0.984) | TCGA-C8-A12V-01 | Breast | breast invasive carcinoma | Female | <65 | I/II | Unknown | Unknown | SD |
| Page: 1 2 3 4 5 6 7 8 9 10 11 12 13 14 15 16 17 18 19 20 21 22 23 24 25 26 27 28 29 30 31 32 |
Top |
Related drugs of malignant transformation related genes |
| Identification of chemicals and drugs interact with genes involved in malignant transfromation |
| (DGIdb 4.0) |
| Entrez ID | Symbol | Category | Interaction Types | Drug Claim Name | Drug Name | PMIDs |
| Page: 1 |

Copyright 2023-Present -The University of Texas Health Science Center at Houston |