
|
|||||
|
 | |
| |
| |
| |
| |
| |
|
Gene: MED10 |
Gene summary for MED10 |
| Gene information | Species | Human | Gene symbol | MED10 | Gene ID | 84246 |
| Gene name | mediator complex subunit 10 | |
| Gene Alias | L6 | |
| Cytomap | 5p15.31 | |
| Gene Type | protein-coding | GO ID | GO:0006139 | UniProtAcc | Q9BTT4 |
Top |
Malignant transformation analysis |
| Identification of the aberrant gene expression in precancerous and cancerous lesions by comparing the gene expression of stem-like cells in diseased tissues with normal stem cells |
| Entrez ID | Symbol | Replicates | Species | Organ | Tissue | Adj P-value | Log2FC | Malignancy |
| 84246 | MED10 | LZE2D | Human | Esophagus | HGIN | 1.25e-06 | 2.39e-01 | 0.0642 |
| 84246 | MED10 | LZE4T | Human | Esophagus | ESCC | 4.70e-30 | 7.42e-01 | 0.0811 |
| 84246 | MED10 | LZE7T | Human | Esophagus | ESCC | 1.80e-23 | 9.39e-01 | 0.0667 |
| 84246 | MED10 | LZE8T | Human | Esophagus | ESCC | 1.66e-13 | 3.30e-01 | 0.067 |
| 84246 | MED10 | LZE20T | Human | Esophagus | ESCC | 2.67e-11 | 3.38e-01 | 0.0662 |
| 84246 | MED10 | LZE22D1 | Human | Esophagus | HGIN | 3.31e-03 | 2.57e-01 | 0.0595 |
| 84246 | MED10 | LZE22T | Human | Esophagus | ESCC | 3.18e-08 | 9.90e-01 | 0.068 |
| 84246 | MED10 | LZE24T | Human | Esophagus | ESCC | 3.55e-24 | 7.21e-01 | 0.0596 |
| 84246 | MED10 | LZE21T | Human | Esophagus | ESCC | 2.56e-02 | 5.44e-01 | 0.0655 |
| 84246 | MED10 | LZE6T | Human | Esophagus | ESCC | 4.13e-24 | 1.09e+00 | 0.0845 |
| 84246 | MED10 | P1T-E | Human | Esophagus | ESCC | 8.76e-20 | 1.32e+00 | 0.0875 |
| 84246 | MED10 | P2T-E | Human | Esophagus | ESCC | 4.50e-43 | 8.24e-01 | 0.1177 |
| 84246 | MED10 | P4T-E | Human | Esophagus | ESCC | 6.95e-79 | 1.79e+00 | 0.1323 |
| 84246 | MED10 | P5T-E | Human | Esophagus | ESCC | 5.20e-49 | 1.21e+00 | 0.1327 |
| 84246 | MED10 | P8T-E | Human | Esophagus | ESCC | 7.72e-60 | 1.52e+00 | 0.0889 |
| 84246 | MED10 | P9T-E | Human | Esophagus | ESCC | 5.74e-43 | 9.84e-01 | 0.1131 |
| 84246 | MED10 | P10T-E | Human | Esophagus | ESCC | 2.79e-96 | 1.93e+00 | 0.116 |
| 84246 | MED10 | P11T-E | Human | Esophagus | ESCC | 7.77e-32 | 1.22e+00 | 0.1426 |
| 84246 | MED10 | P12T-E | Human | Esophagus | ESCC | 8.44e-62 | 1.40e+00 | 0.1122 |
| 84246 | MED10 | P15T-E | Human | Esophagus | ESCC | 1.64e-32 | 6.84e-01 | 0.1149 |
| Page: 1 2 3 4 5 6 7 |
| Tissue | Expression Dynamics | Abbreviation |
| Esophagus | 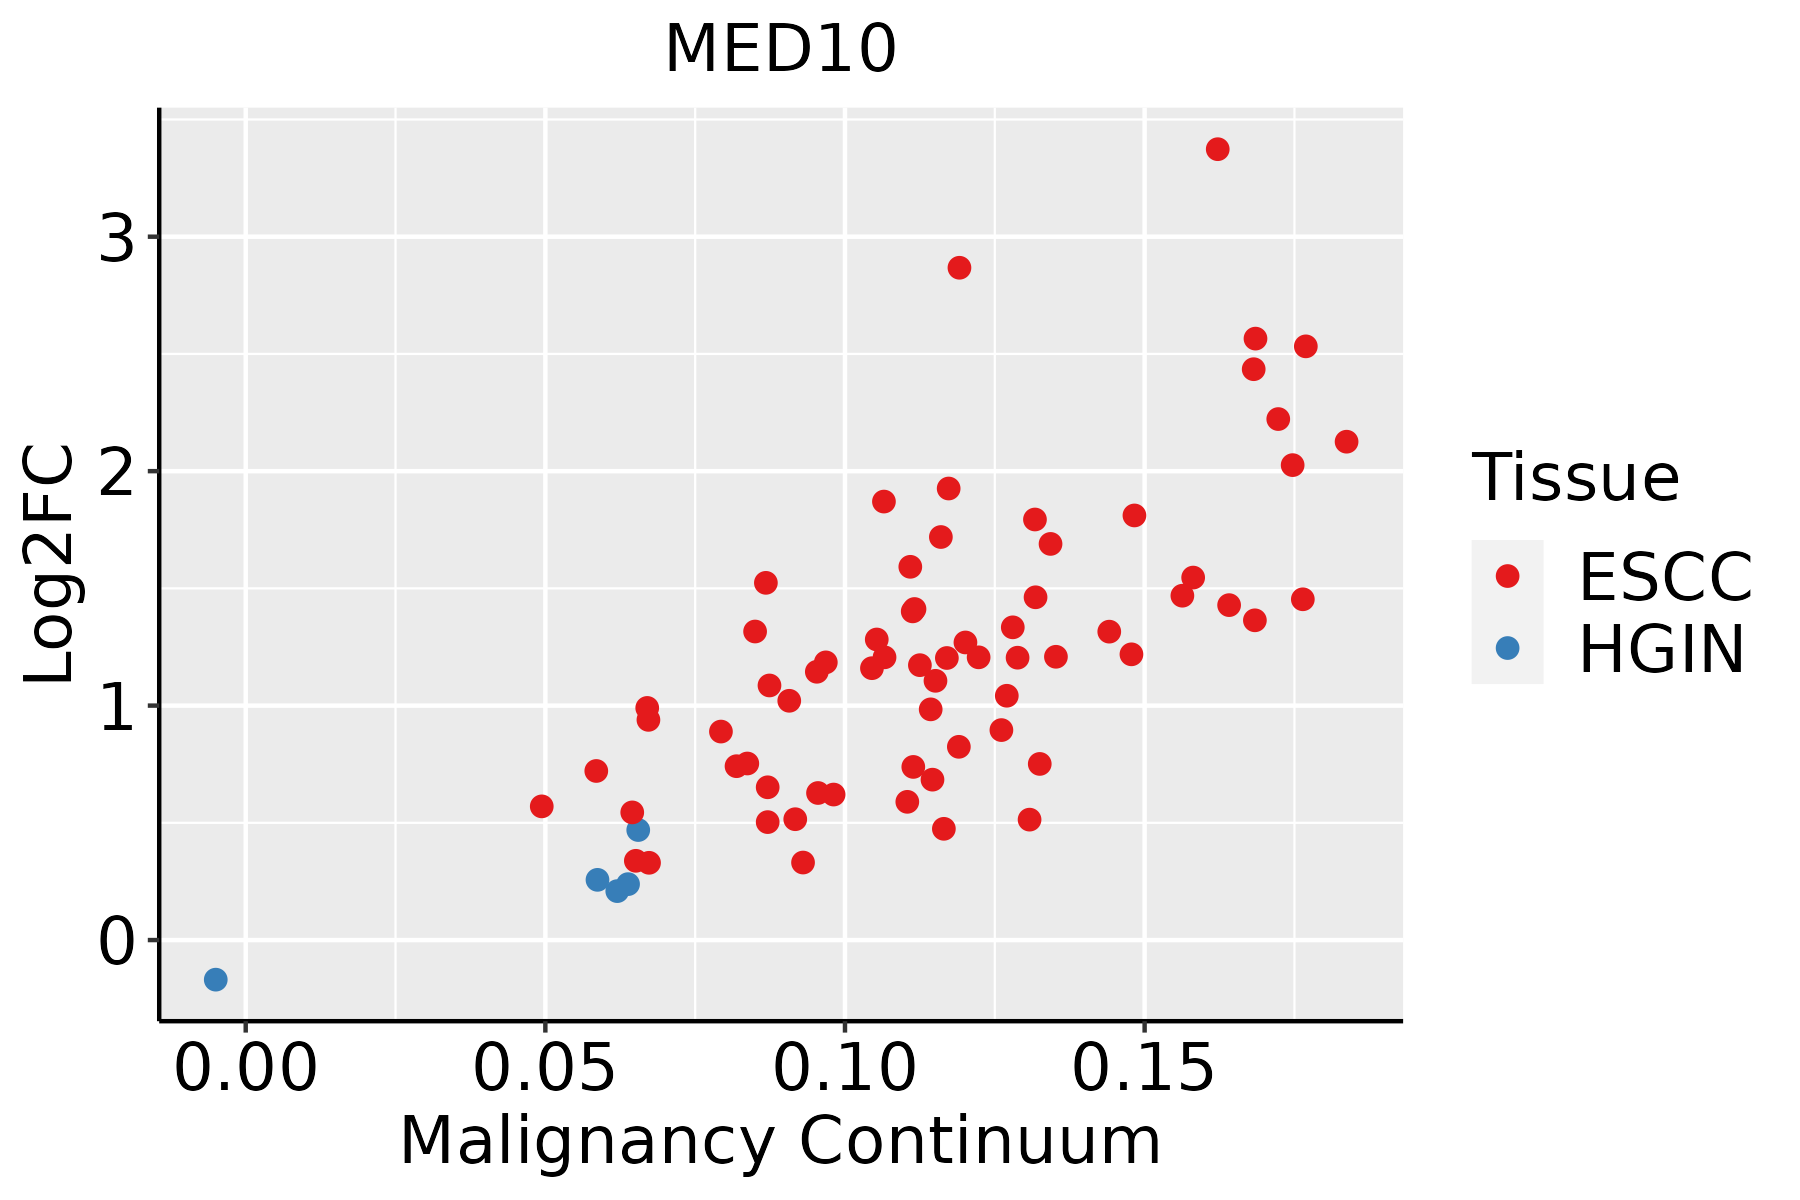 | ESCC: Esophageal squamous cell carcinoma |
| HGIN: High-grade intraepithelial neoplasias | ||
| LGIN: Low-grade intraepithelial neoplasias | ||
| Liver |  | HCC: Hepatocellular carcinoma |
| NAFLD: Non-alcoholic fatty liver disease | ||
| Lung | 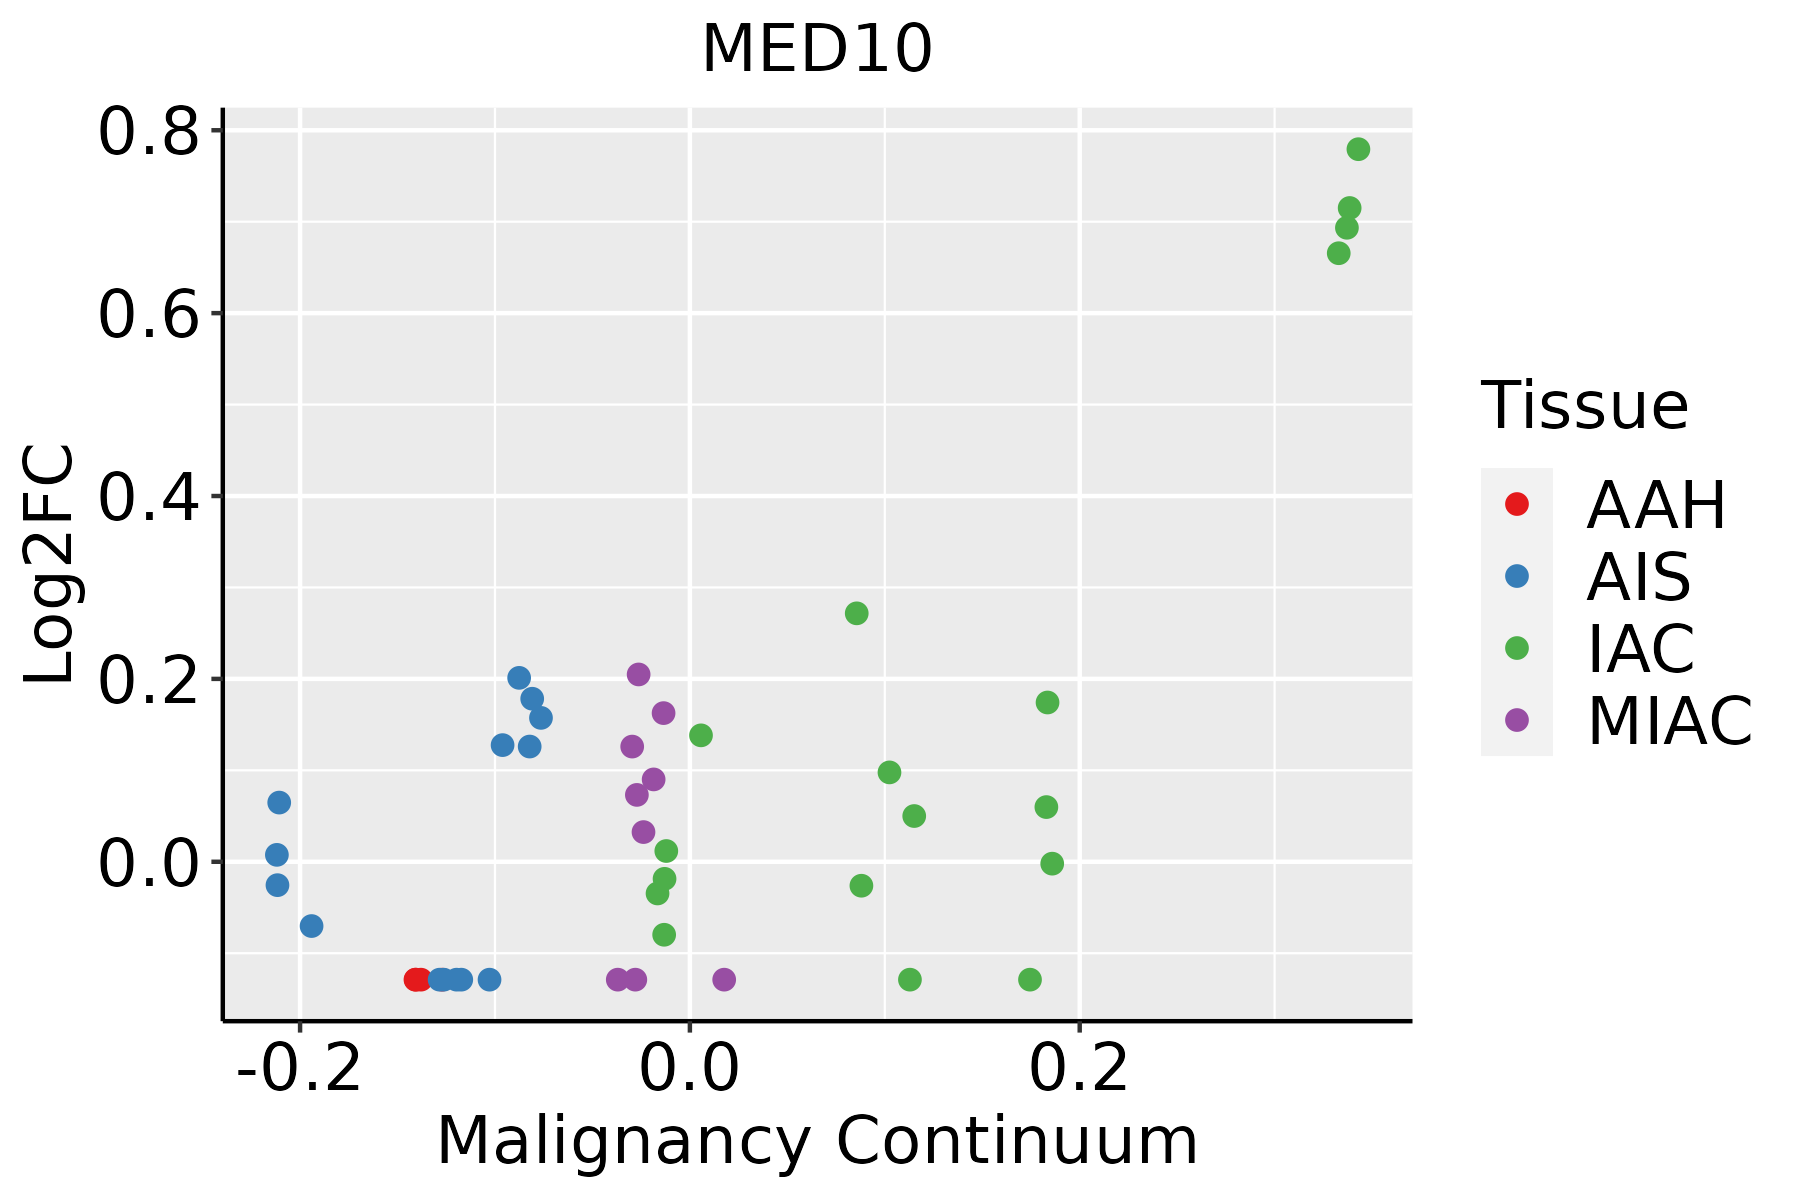 | AAH: Atypical adenomatous hyperplasia |
| AIS: Adenocarcinoma in situ | ||
| IAC: Invasive lung adenocarcinoma | ||
| MIA: Minimally invasive adenocarcinoma | ||
| Oral Cavity | 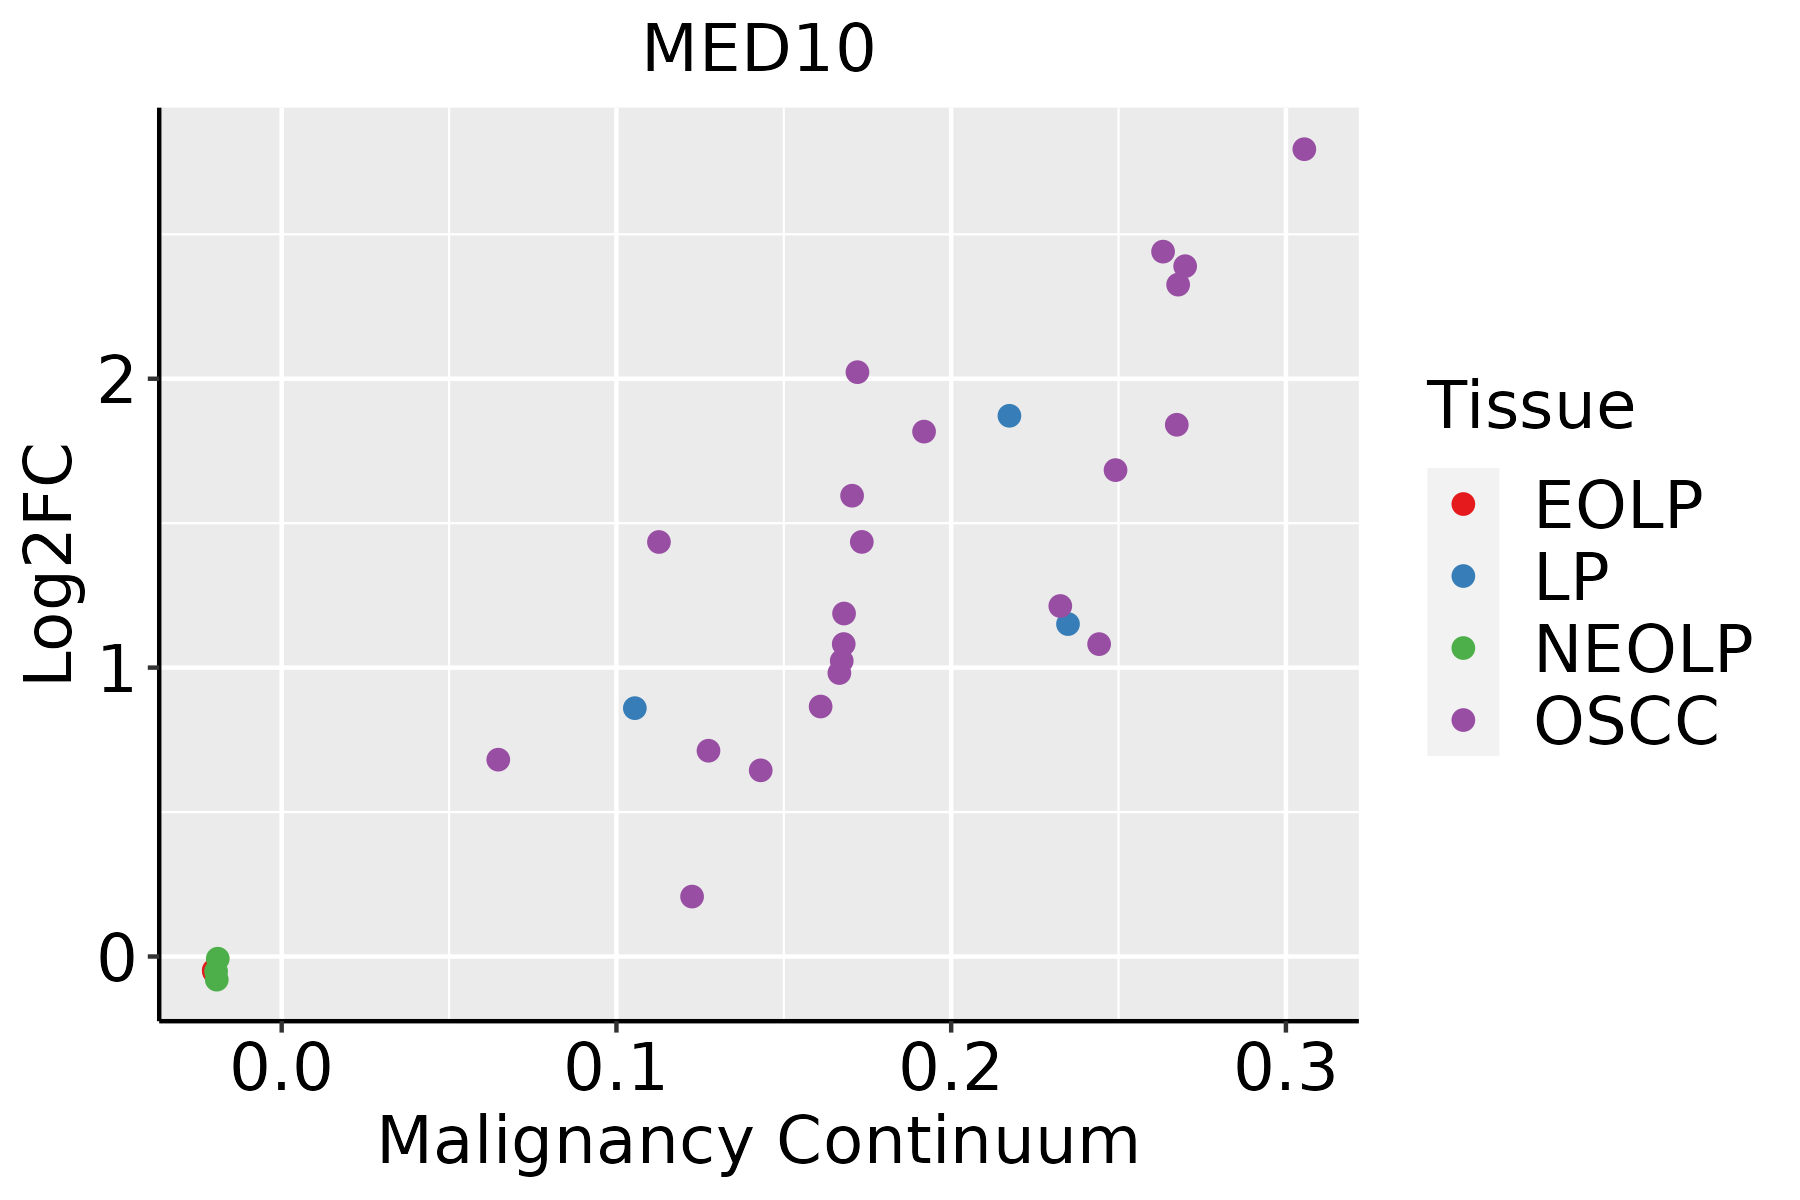 | EOLP: Erosive Oral lichen planus |
| LP: leukoplakia | ||
| NEOLP: Non-erosive oral lichen planus | ||
| OSCC: Oral squamous cell carcinoma | ||
| Skin | 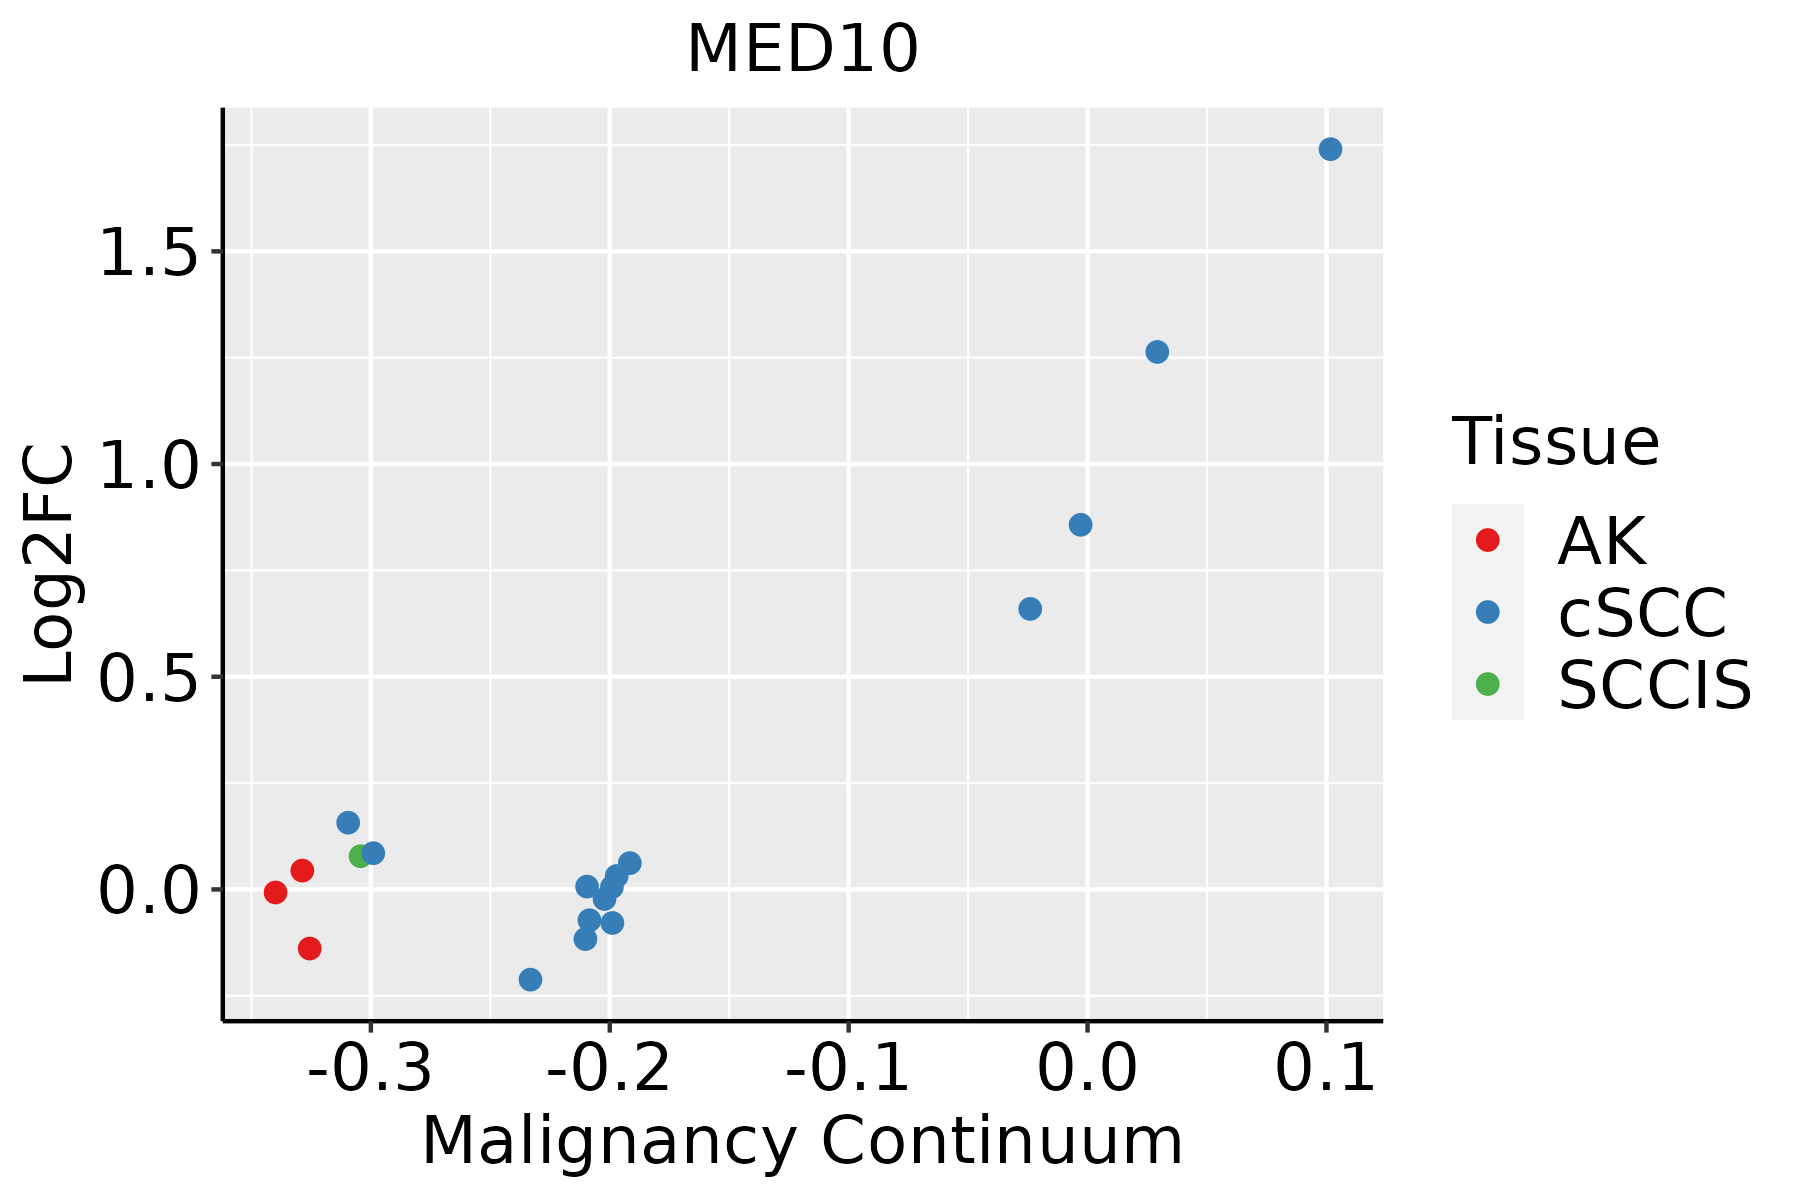 | AK: Actinic keratosis |
| cSCC: Cutaneous squamous cell carcinoma | ||
| SCCIS:squamous cell carcinoma in situ | ||
| Thyroid |  | ATC: Anaplastic thyroid cancer |
| HT: Hashimoto's thyroiditis | ||
| PTC: Papillary thyroid cancer |
| ∗log2FC in expression of this searched gene in stem-like cells from each diseased tissue sample relative to stem-like cells in normal samples in each tissue plotted against the malignancy continuum. Samples are colored based on if they are from different disease stage. |
Top |
Malignant transformation related pathway analysis |
| Find out the enriched GO biological processes and KEGG pathways involved in transition from healthy to precancer to cancer |
| Tissue | Disease Stage | Enriched GO biological Processes |
| Colorectum | AD |  |
| Colorectum | SER |  |
| Colorectum | MSS |  |
| Colorectum | MSI-H |  |
| Colorectum | FAP |  |
| ∗Top 15 enriched GO BP terms are showed in the bar plot of each disease state in each tissue. Each row represents a significant GO biological process which is colored according to the -log10(p.adjust). |
| Page: 1 2 3 4 5 6 7 8 9 |
| GO ID | Tissue | Disease Stage | Description | Gene Ratio | Bg Ratio | pvalue | p.adjust | Count |
| GO:00525479 | Breast | Precancer | regulation of peptidase activity | 71/1080 | 461/18723 | 2.72e-14 | 6.94e-12 | 71 |
| GO:00525489 | Breast | Precancer | regulation of endopeptidase activity | 67/1080 | 432/18723 | 1.06e-13 | 2.36e-11 | 67 |
| GO:00458619 | Breast | Precancer | negative regulation of proteolysis | 50/1080 | 351/18723 | 2.99e-09 | 2.39e-07 | 50 |
| GO:00513468 | Breast | Precancer | negative regulation of hydrolase activity | 50/1080 | 379/18723 | 3.85e-08 | 2.34e-06 | 50 |
| GO:00104668 | Breast | Precancer | negative regulation of peptidase activity | 38/1080 | 262/18723 | 1.46e-07 | 7.82e-06 | 38 |
| GO:00109519 | Breast | Precancer | negative regulation of endopeptidase activity | 37/1080 | 252/18723 | 1.55e-07 | 8.05e-06 | 37 |
| GO:00018196 | Breast | Precancer | positive regulation of cytokine production | 52/1080 | 467/18723 | 4.18e-06 | 1.29e-04 | 52 |
| GO:19049519 | Breast | Precancer | positive regulation of establishment of protein localization | 36/1080 | 319/18723 | 9.30e-05 | 1.75e-03 | 36 |
| GO:00069009 | Breast | Precancer | vesicle budding from membrane | 12/1080 | 61/18723 | 1.61e-04 | 2.69e-03 | 12 |
| GO:00512229 | Breast | Precancer | positive regulation of protein transport | 31/1080 | 303/18723 | 1.44e-03 | 1.50e-02 | 31 |
| GO:00507086 | Breast | Precancer | regulation of protein secretion | 28/1080 | 268/18723 | 1.76e-03 | 1.74e-02 | 28 |
| GO:00718064 | Breast | Precancer | protein transmembrane transport | 10/1080 | 59/18723 | 1.86e-03 | 1.81e-02 | 10 |
| GO:0032732 | Breast | Precancer | positive regulation of interleukin-1 production | 11/1080 | 73/18723 | 2.96e-03 | 2.55e-02 | 11 |
| GO:00716926 | Breast | Precancer | protein localization to extracellular region | 34/1080 | 368/18723 | 4.65e-03 | 3.58e-02 | 34 |
| GO:00093067 | Breast | Precancer | protein secretion | 33/1080 | 359/18723 | 5.65e-03 | 4.08e-02 | 33 |
| GO:00355927 | Breast | Precancer | establishment of protein localization to extracellular region | 33/1080 | 360/18723 | 5.89e-03 | 4.21e-02 | 33 |
| GO:00481992 | Breast | Precancer | vesicle targeting, to, from or within Golgi | 5/1080 | 21/18723 | 5.93e-03 | 4.21e-02 | 5 |
| GO:005254714 | Breast | IDC | regulation of peptidase activity | 96/1434 | 461/18723 | 7.58e-20 | 6.15e-17 | 96 |
| GO:005254814 | Breast | IDC | regulation of endopeptidase activity | 88/1434 | 432/18723 | 1.20e-17 | 4.85e-15 | 88 |
| GO:004586114 | Breast | IDC | negative regulation of proteolysis | 70/1434 | 351/18723 | 8.21e-14 | 2.22e-11 | 70 |
| Page: 1 2 3 4 5 6 7 8 9 10 11 12 13 14 15 16 17 18 19 20 21 22 23 24 25 26 27 28 29 30 31 32 33 34 35 36 37 |
| Pathway ID | Tissue | Disease Stage | Description | Gene Ratio | Bg Ratio | pvalue | p.adjust | qvalue | Count |
| Page: 1 |
Top |
Cell-cell communication analysis |
| Identification of potential cell-cell interactions between two cell types and their ligand-receptor pairs for different disease states |
| Ligand | Receptor | LRpair | Pathway | Tissue | Disease Stage |
| Page: 1 |
Top |
Single-cell gene regulatory network inference analysis |
| Find out the significant the regulons (TFs) and the target genes of each regulon across cell types for different disease states |
| TF | Cell Type | Tissue | Disease Stage | Target Gene | RSS | Regulon Activity |
| ∗The dot plots of a searched regulon are shown for all cell subpopulations in each disease state of each tissue based on the regulon specific score inferred using pySCENIC and by calculating the average expression. |
| Page: 1 |
Top |
Somatic mutation of malignant transformation related genes |
| Annotation of somatic variants for genes involved in malignant transformation |
| Hugo Symbol | Variant Class | Variant Classification | dbSNP RS | HGVSc | HGVSp | HGVSp Short | SWISSPROT | BIOTYPE | SIFT | PolyPhen | Tumor Sample Barcode | Tissue | Histology | Sex | Age | Stage | Therapy Types | Drugs | Outcome |
| MED10 | SNV | Missense_Mutation | c.17N>T | p.Asp6Val | p.D6V | Q9BTT4 | protein_coding | deleterious(0.01) | probably_damaging(0.987) | TCGA-AD-6964-01 | Colorectum | colon adenocarcinoma | Male | <65 | III/IV | Chemotherapy | folfox | PD | |
| MED10 | deletion | Frame_Shift_Del | novel | c.275delN | p.Asn92MetfsTer11 | p.N92Mfs*11 | Q9BTT4 | protein_coding | TCGA-A6-2686-01 | Colorectum | colon adenocarcinoma | Female | >=65 | I/II | Unknown | Unknown | SD | ||
| MED10 | SNV | Missense_Mutation | novel | c.260N>T | p.Arg87Met | p.R87M | Q9BTT4 | protein_coding | deleterious(0) | possibly_damaging(0.609) | TCGA-A5-A0G2-01 | Endometrium | uterine corpus endometrioid carcinoma | Female | <65 | III/IV | Unknown | Unknown | SD |
| MED10 | SNV | Missense_Mutation | novel | c.341N>A | p.Ser114Tyr | p.S114Y | Q9BTT4 | protein_coding | deleterious(0.04) | benign(0.27) | TCGA-A5-A2K5-01 | Endometrium | uterine corpus endometrioid carcinoma | Female | >=65 | I/II | Unknown | Unknown | SD |
| MED10 | SNV | Missense_Mutation | novel | c.109C>T | p.Leu37Phe | p.L37F | Q9BTT4 | protein_coding | tolerated(0.11) | probably_damaging(0.992) | TCGA-FI-A2F4-01 | Endometrium | uterine corpus endometrioid carcinoma | Female | <65 | I/II | Unknown | Unknown | SD |
| MED10 | deletion | Frame_Shift_Del | c.388delG | p.Glu130ArgfsTer14 | p.E130Rfs*14 | Q9BTT4 | protein_coding | TCGA-A5-A7WJ-01 | Endometrium | uterine corpus endometrioid carcinoma | Female | <65 | I/II | Unknown | Unknown | SD | |||
| MED10 | SNV | Missense_Mutation | novel | c.258G>T | p.Glu86Asp | p.E86D | Q9BTT4 | protein_coding | tolerated(0.09) | probably_damaging(0.983) | TCGA-55-7911-01 | Lung | lung adenocarcinoma | Female | >=65 | I/II | Unknown | Unknown | PD |
| MED10 | SNV | Missense_Mutation | novel | c.394N>T | p.His132Tyr | p.H132Y | Q9BTT4 | protein_coding | tolerated(0.27) | benign(0.026) | TCGA-NC-A5HG-01 | Lung | lung squamous cell carcinoma | Male | <65 | III/IV | Chemotherapy | cisplatin | CR |
| MED10 | SNV | Missense_Mutation | rs773128691 | c.151A>G | p.Ile51Val | p.I51V | Q9BTT4 | protein_coding | tolerated(0.27) | benign(0.001) | TCGA-4P-AA8J-01 | Oral cavity | head & neck squamous cell carcinoma | Male | >=65 | I/II | Unknown | Unknown | SD |
| MED10 | SNV | Missense_Mutation | c.191N>A | p.Pro64Gln | p.P64Q | Q9BTT4 | protein_coding | deleterious(0) | probably_damaging(0.998) | TCGA-EJ-7125-01 | Prostate | prostate adenocarcinoma | Male | <65 | 7 | Unknown | Unknown | SD |
| Page: 1 2 |
Top |
Related drugs of malignant transformation related genes |
| Identification of chemicals and drugs interact with genes involved in malignant transfromation |
| (DGIdb 4.0) |
| Entrez ID | Symbol | Category | Interaction Types | Drug Claim Name | Drug Name | PMIDs |
| Page: 1 |

Copyright 2023-Present -The University of Texas Health Science Center at Houston |