
|
|||||
|
 | |
| |
| |
| |
| |
| |
|
Gene: MECOM |
Gene summary for MECOM |
| Gene information | Species | Human | Gene symbol | MECOM | Gene ID | 2122 |
| Gene name | MDS1 and EVI1 complex locus | |
| Gene Alias | AML1-EVI-1 | |
| Cytomap | 3q26.2 | |
| Gene Type | protein-coding | GO ID | GO:0000165 | UniProtAcc | Q03112 |
Top |
Malignant transformation analysis |
| Identification of the aberrant gene expression in precancerous and cancerous lesions by comparing the gene expression of stem-like cells in diseased tissues with normal stem cells |
| Entrez ID | Symbol | Replicates | Species | Organ | Tissue | Adj P-value | Log2FC | Malignancy |
| 2122 | MECOM | CA_HPV_1 | Human | Cervix | CC | 1.93e-06 | -1.60e-01 | 0.0264 |
| 2122 | MECOM | CA_HPV_2 | Human | Cervix | CC | 2.80e-03 | 3.81e-01 | 0.0391 |
| 2122 | MECOM | N_HPV_1 | Human | Cervix | N_HPV | 3.98e-02 | -1.45e-01 | 0.0079 |
| 2122 | MECOM | CCI_1 | Human | Cervix | CC | 7.01e-28 | 2.25e+00 | 0.528 |
| 2122 | MECOM | CCI_2 | Human | Cervix | CC | 2.96e-03 | 7.08e-01 | 0.5249 |
| 2122 | MECOM | CCI_3 | Human | Cervix | CC | 4.23e-45 | 2.79e+00 | 0.516 |
| 2122 | MECOM | CCII_1 | Human | Cervix | CC | 6.13e-26 | 1.10e+00 | 0.3249 |
| 2122 | MECOM | H2 | Human | Cervix | HSIL_HPV | 5.01e-10 | 5.29e-01 | 0.0632 |
| 2122 | MECOM | HTA11_3410_2000001011 | Human | Colorectum | AD | 2.81e-13 | -4.52e-01 | 0.0155 |
| 2122 | MECOM | HTA11_2951_2000001011 | Human | Colorectum | AD | 2.82e-03 | -5.54e-01 | 0.0216 |
| 2122 | MECOM | HTA11_1938_2000001011 | Human | Colorectum | AD | 3.82e-16 | 7.84e-01 | -0.0811 |
| 2122 | MECOM | HTA11_78_2000001011 | Human | Colorectum | AD | 4.46e-06 | 5.12e-01 | -0.1088 |
| 2122 | MECOM | HTA11_347_2000001011 | Human | Colorectum | AD | 6.52e-12 | 6.83e-01 | -0.1954 |
| 2122 | MECOM | HTA11_3361_2000001011 | Human | Colorectum | AD | 1.39e-12 | -7.28e-01 | -0.1207 |
| 2122 | MECOM | HTA11_83_2000001011 | Human | Colorectum | SER | 1.21e-07 | 4.44e-01 | -0.1526 |
| 2122 | MECOM | HTA11_696_2000001011 | Human | Colorectum | AD | 2.83e-05 | -2.70e-01 | -0.1464 |
| 2122 | MECOM | HTA11_1391_2000001011 | Human | Colorectum | AD | 2.47e-06 | 8.59e-01 | -0.059 |
| 2122 | MECOM | HTA11_5212_2000001011 | Human | Colorectum | AD | 4.66e-16 | -8.60e-01 | -0.2061 |
| 2122 | MECOM | HTA11_5216_2000001011 | Human | Colorectum | SER | 2.26e-02 | -4.92e-01 | -0.1462 |
| 2122 | MECOM | HTA11_866_3004761011 | Human | Colorectum | AD | 1.34e-07 | -5.23e-01 | 0.096 |
| Page: 1 2 3 4 5 6 7 8 9 10 11 |
| Tissue | Expression Dynamics | Abbreviation |
| Cervix | 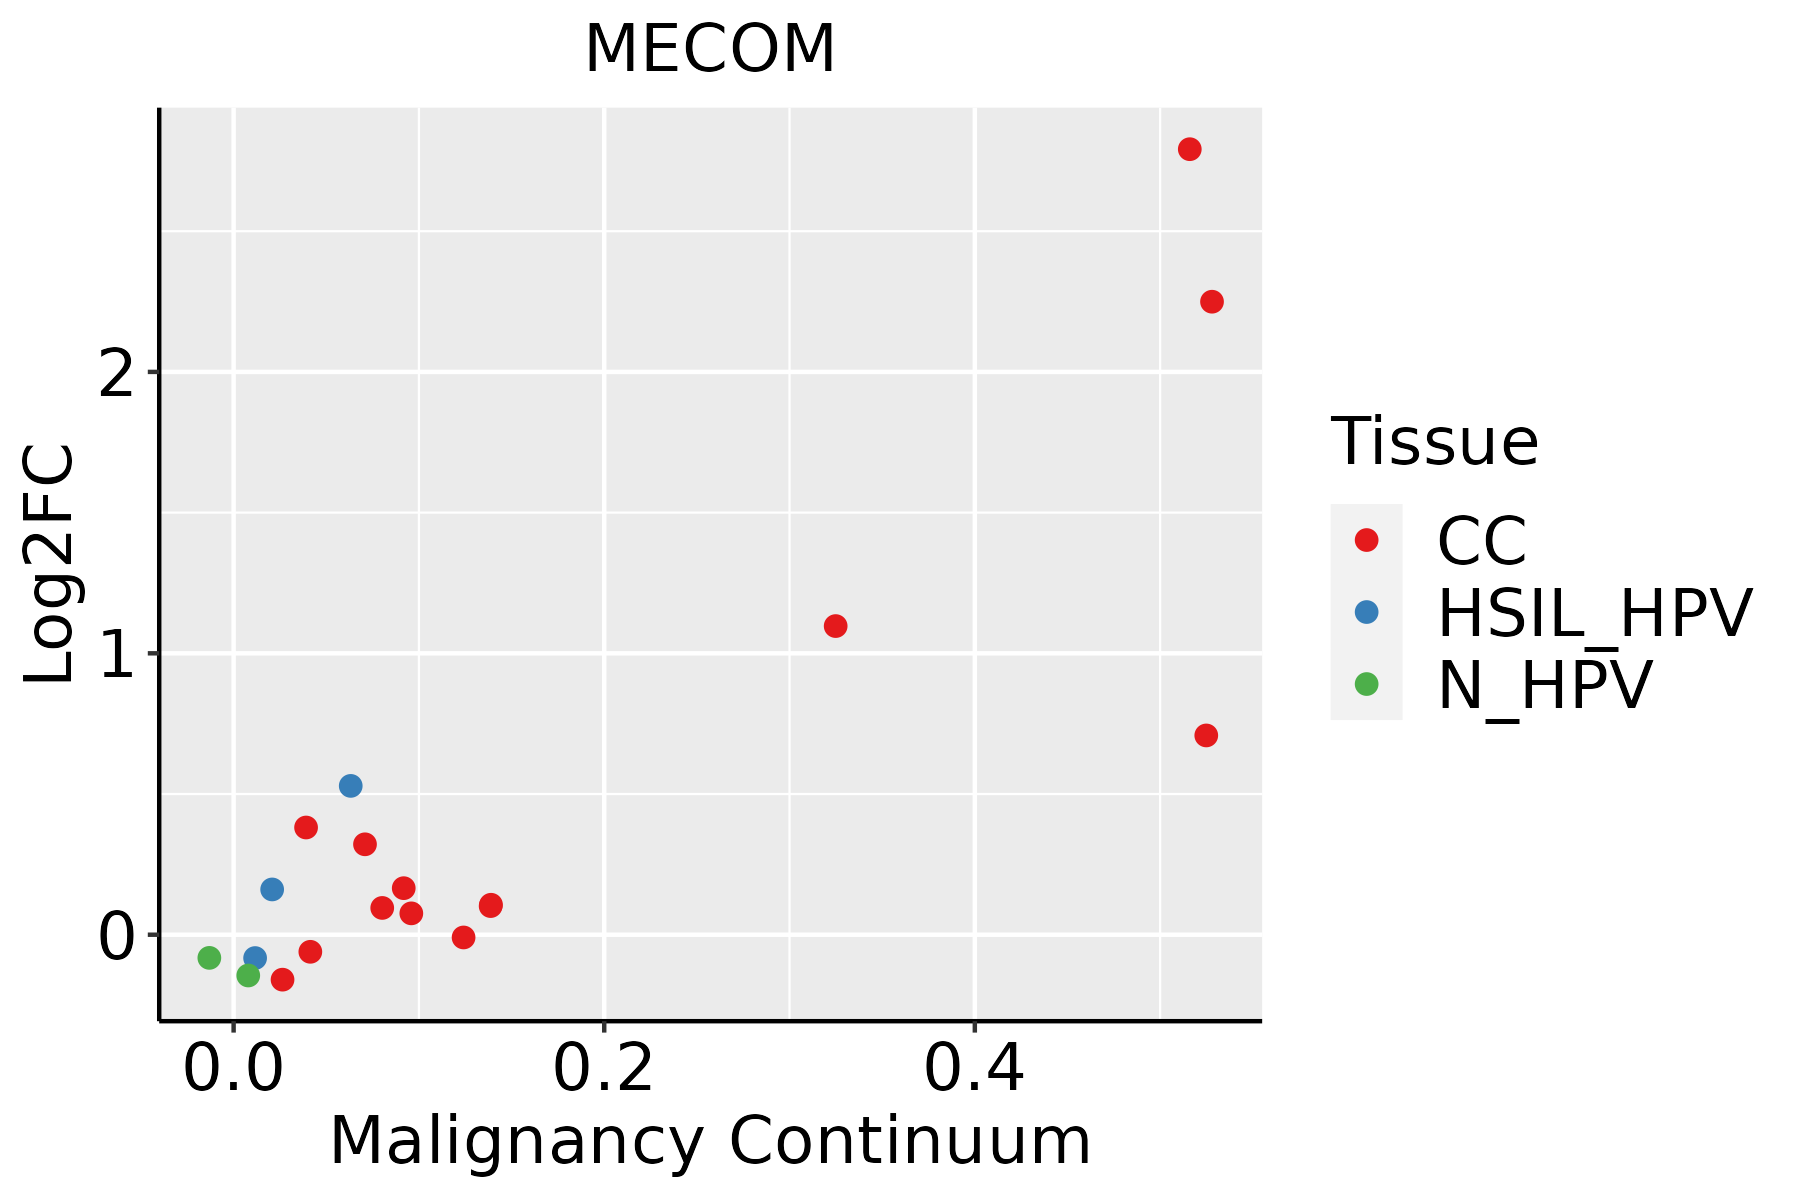 | CC: Cervix cancer |
| HSIL_HPV: HPV-infected high-grade squamous intraepithelial lesions | ||
| N_HPV: HPV-infected normal cervix | ||
| Colorectum (GSE201348) |  | FAP: Familial adenomatous polyposis |
| CRC: Colorectal cancer | ||
| Colorectum (HTA11) | 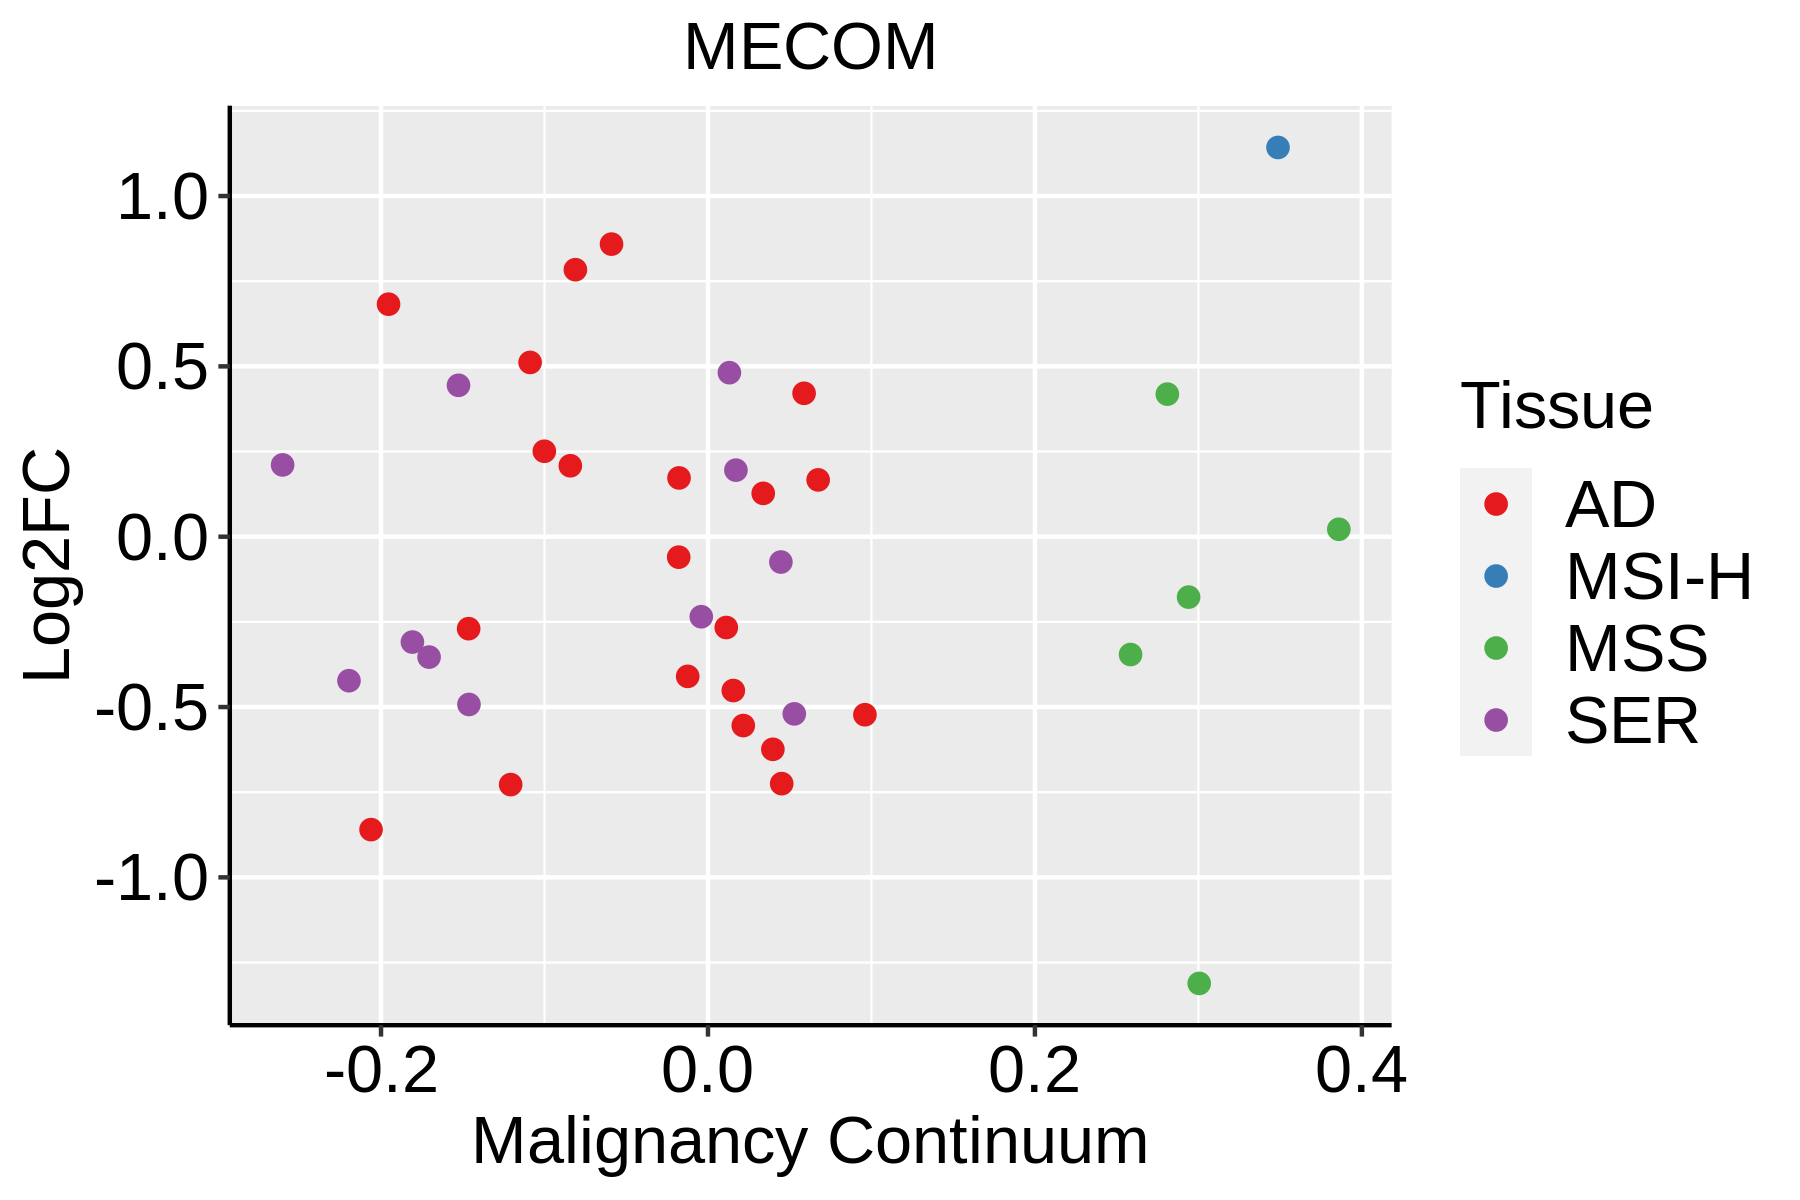 | AD: Adenomas |
| SER: Sessile serrated lesions | ||
| MSI-H: Microsatellite-high colorectal cancer | ||
| MSS: Microsatellite stable colorectal cancer | ||
| Endometrium | 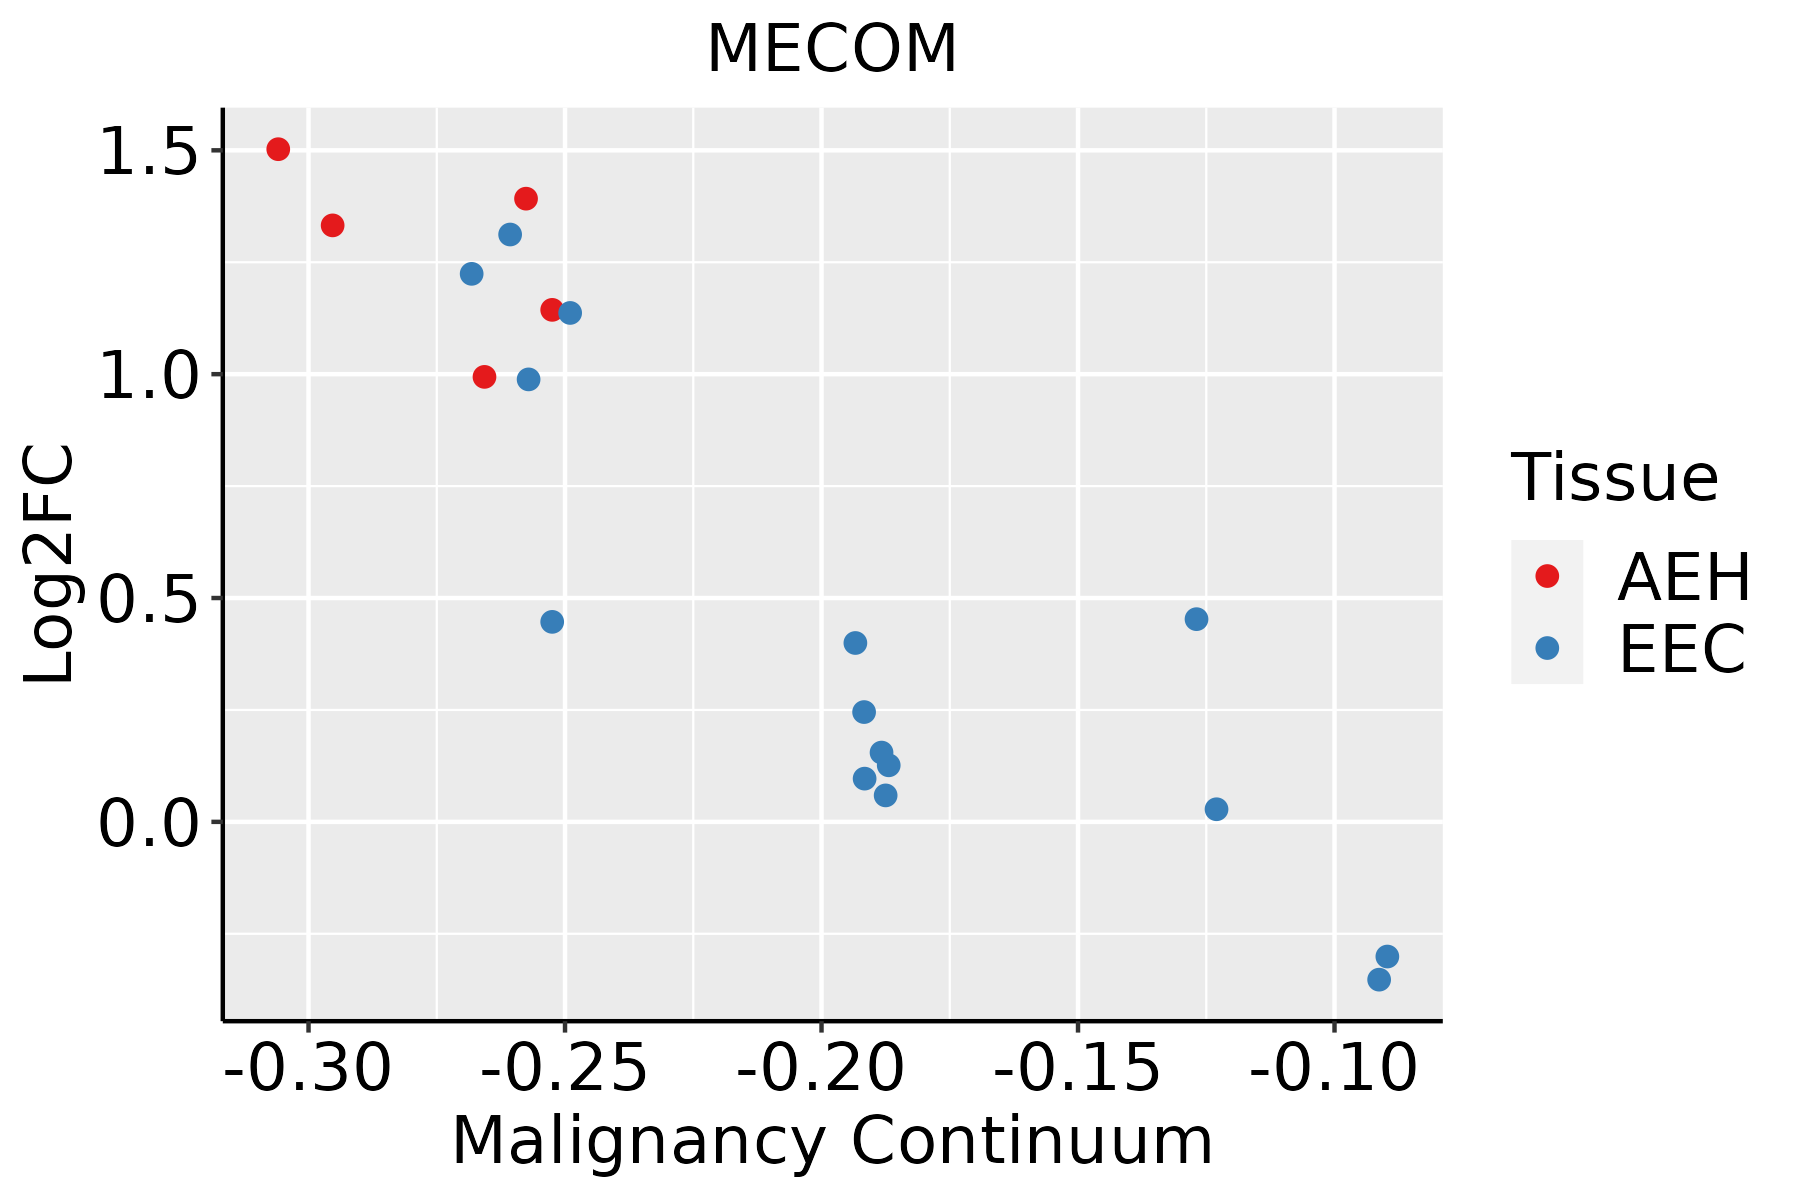 | AEH: Atypical endometrial hyperplasia |
| EEC: Endometrioid Cancer | ||
| Esophagus | 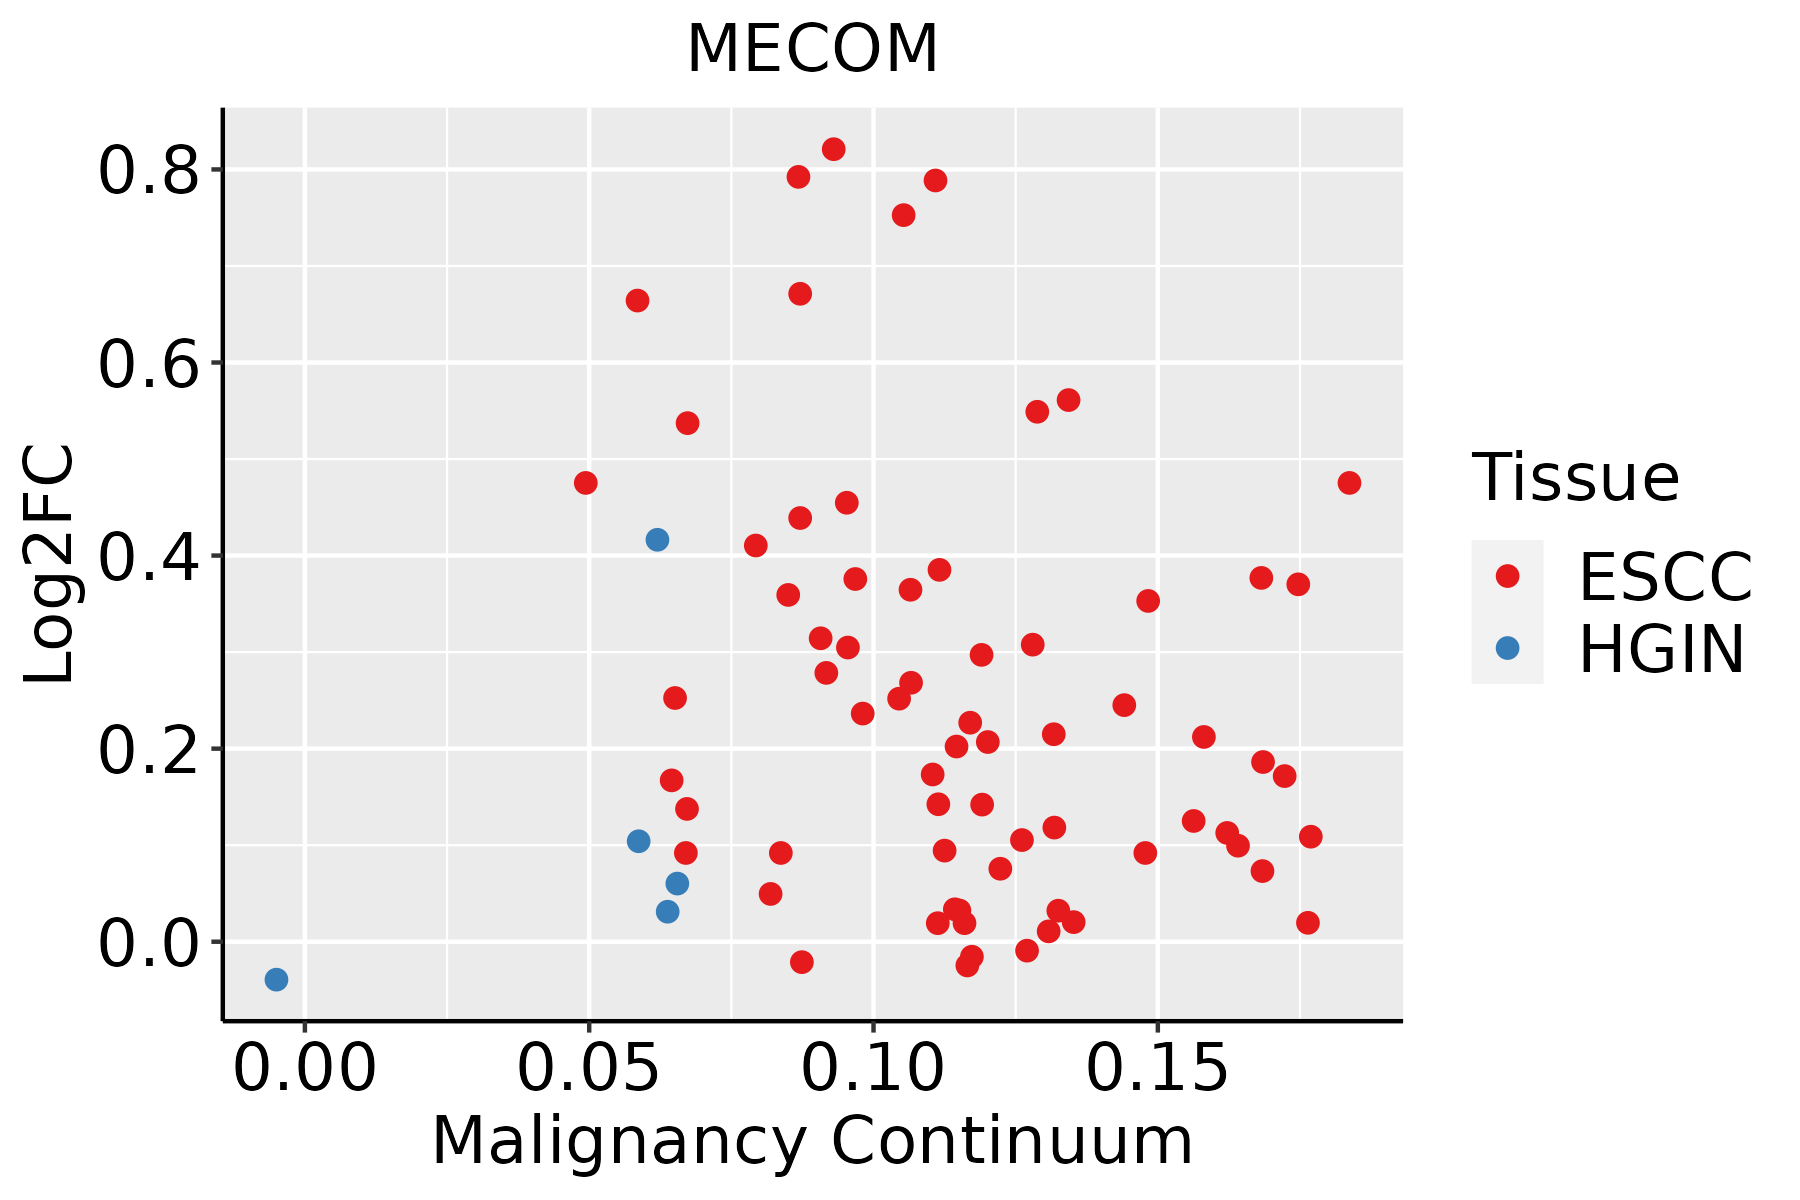 | ESCC: Esophageal squamous cell carcinoma |
| HGIN: High-grade intraepithelial neoplasias | ||
| LGIN: Low-grade intraepithelial neoplasias | ||
| GC | 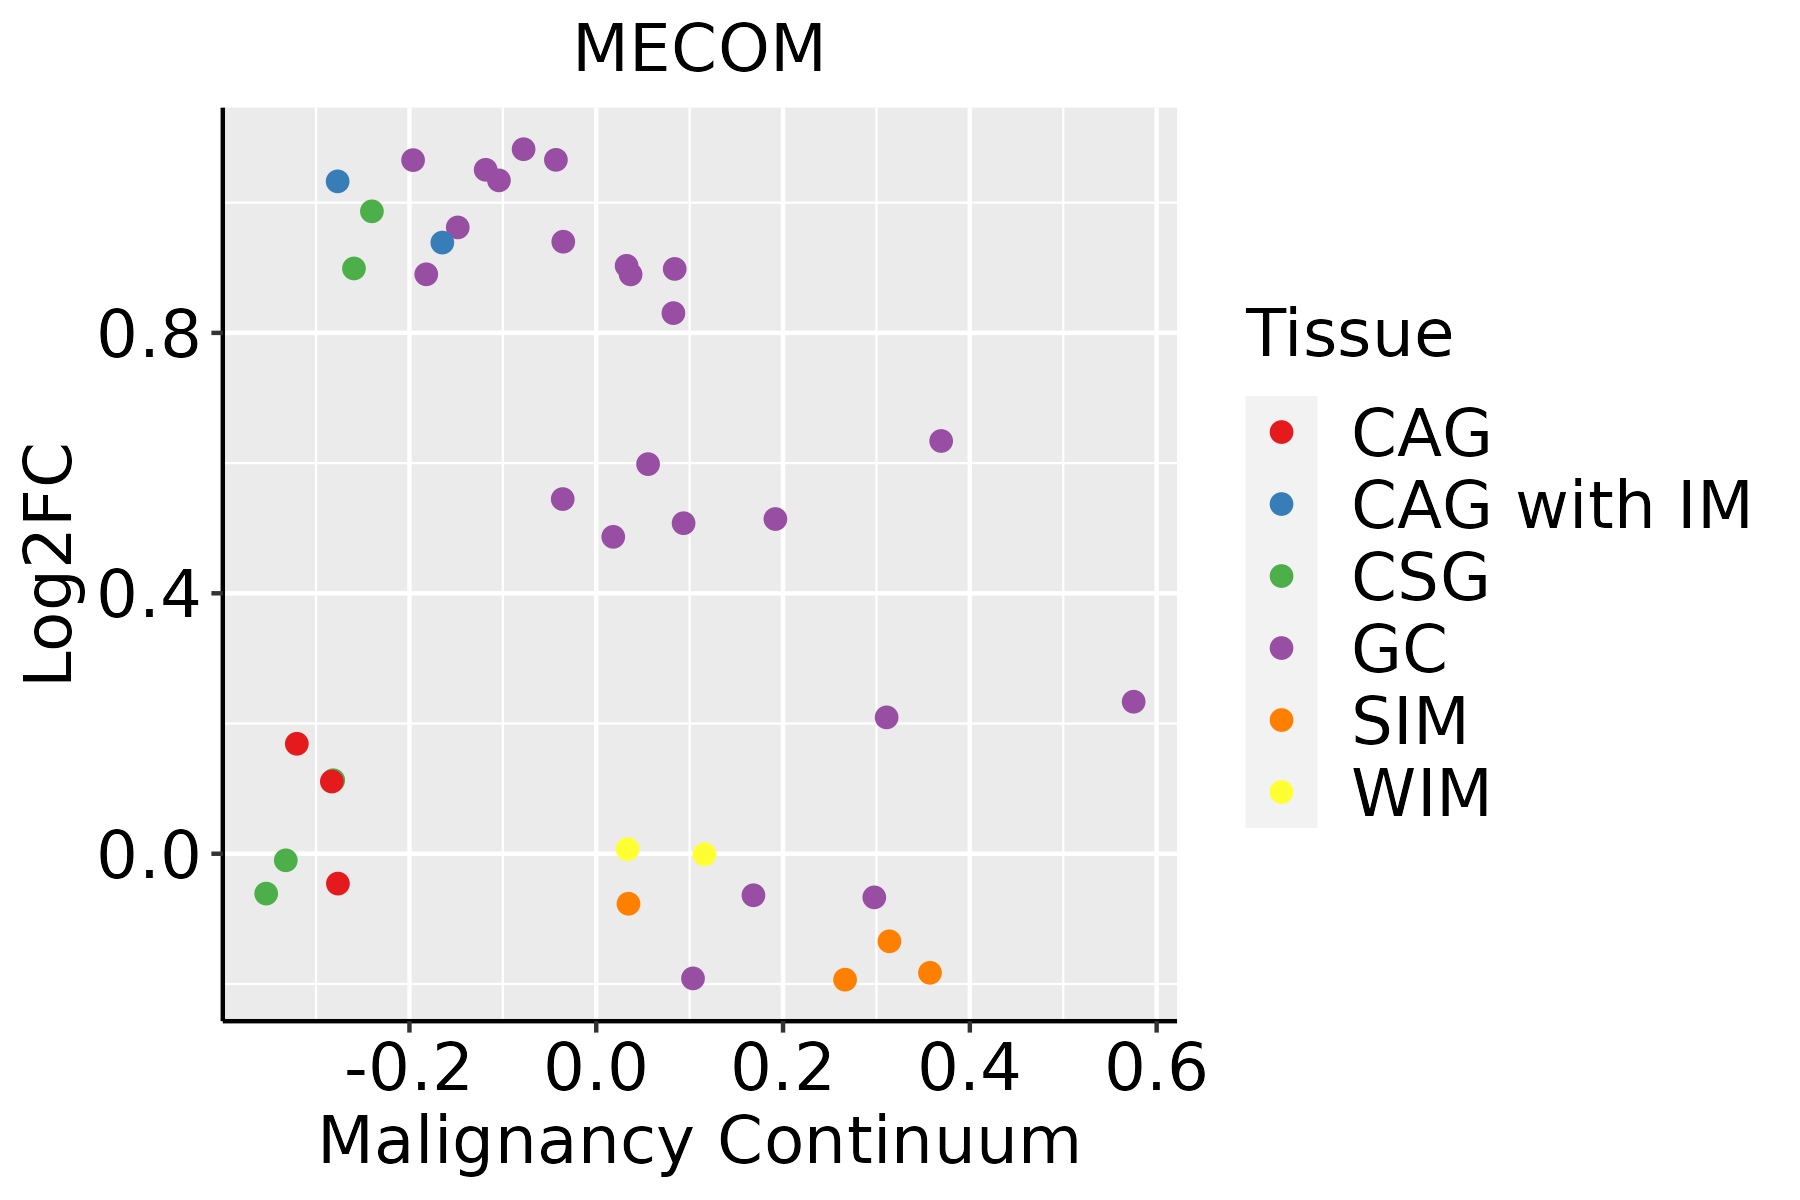 | CAG: Chronic atrophic gastritis |
| CAG with IM: Chronic atrophic gastritis with intestinal metaplasia | ||
| CSG: Chronic superficial gastritis | ||
| GC: Gastric cancer | ||
| SIM: Severe intestinal metaplasia | ||
| WIM: Wild intestinal metaplasia | ||
| Liver |  | HCC: Hepatocellular carcinoma |
| NAFLD: Non-alcoholic fatty liver disease | ||
| Lung | 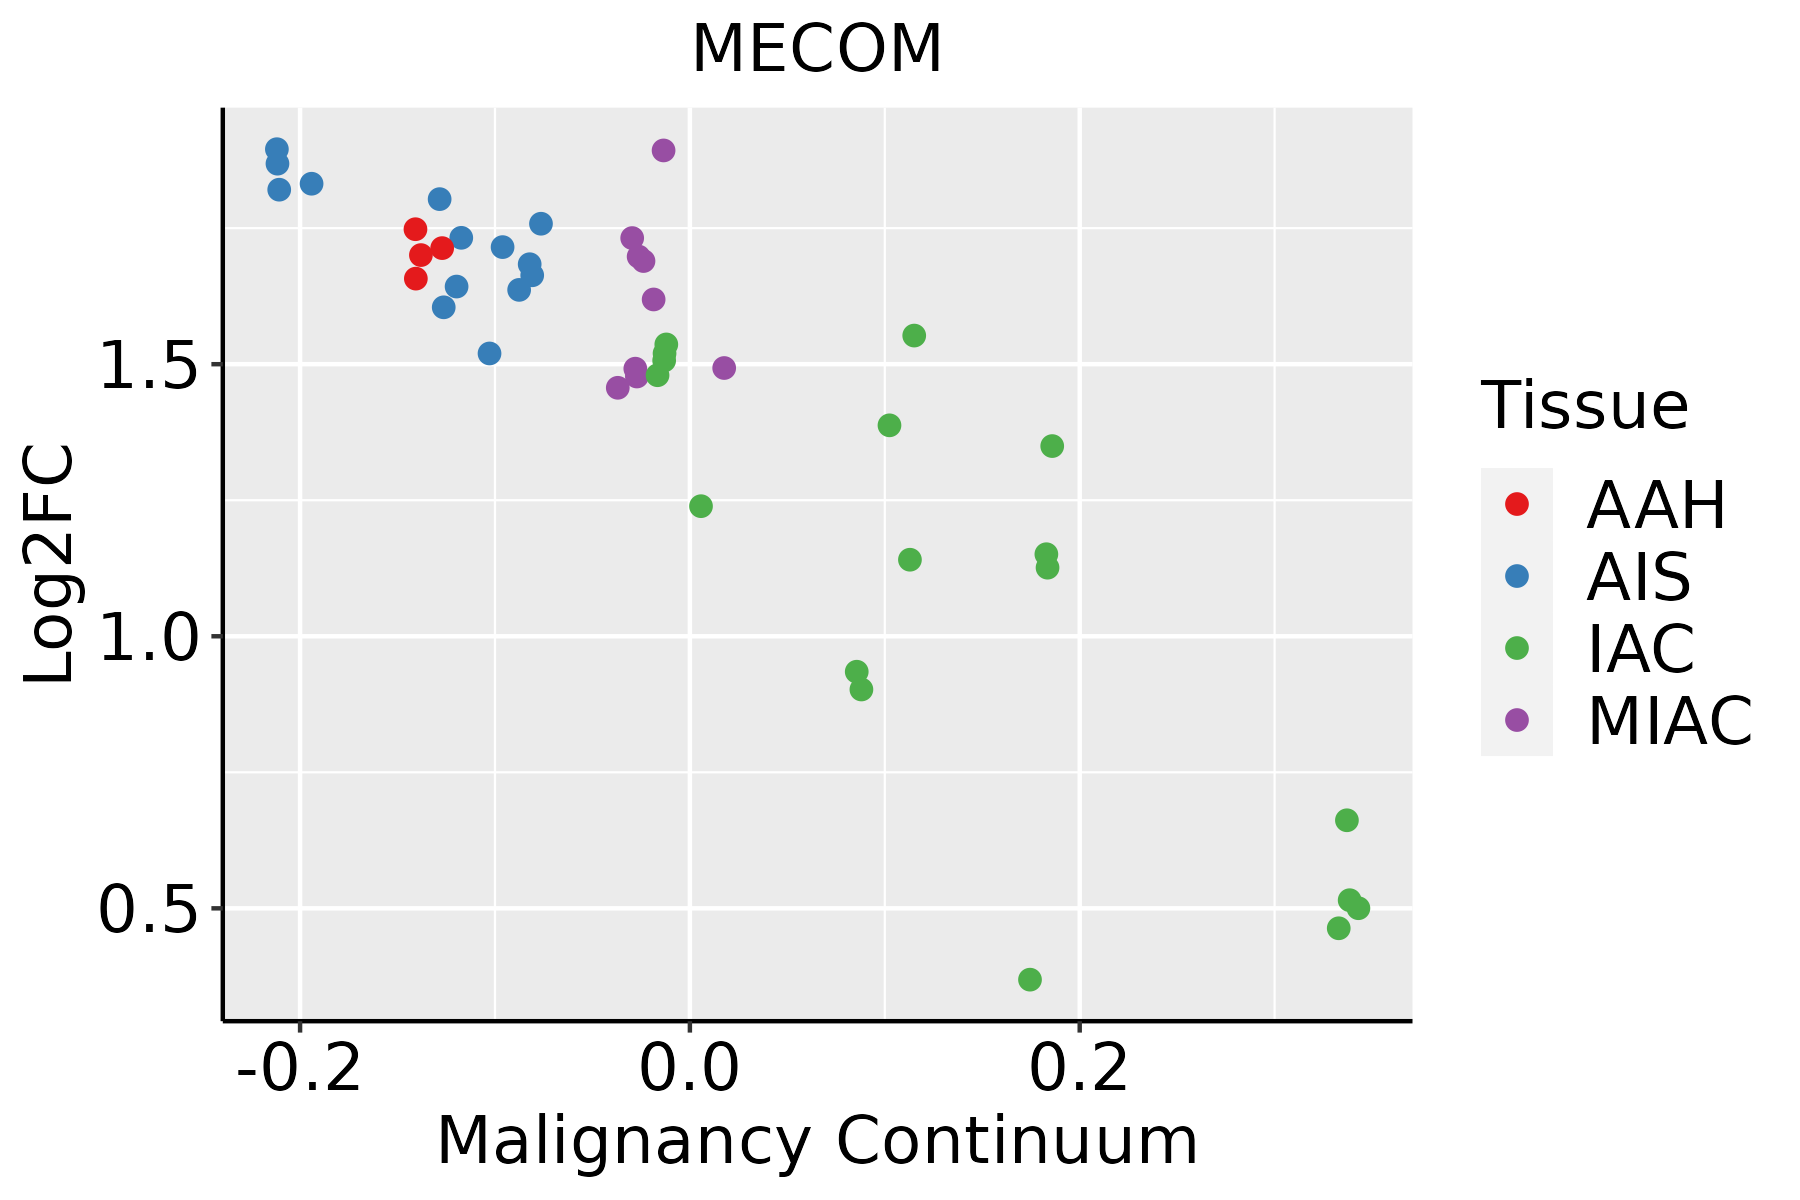 | AAH: Atypical adenomatous hyperplasia |
| AIS: Adenocarcinoma in situ | ||
| IAC: Invasive lung adenocarcinoma | ||
| MIA: Minimally invasive adenocarcinoma | ||
| Oral Cavity | 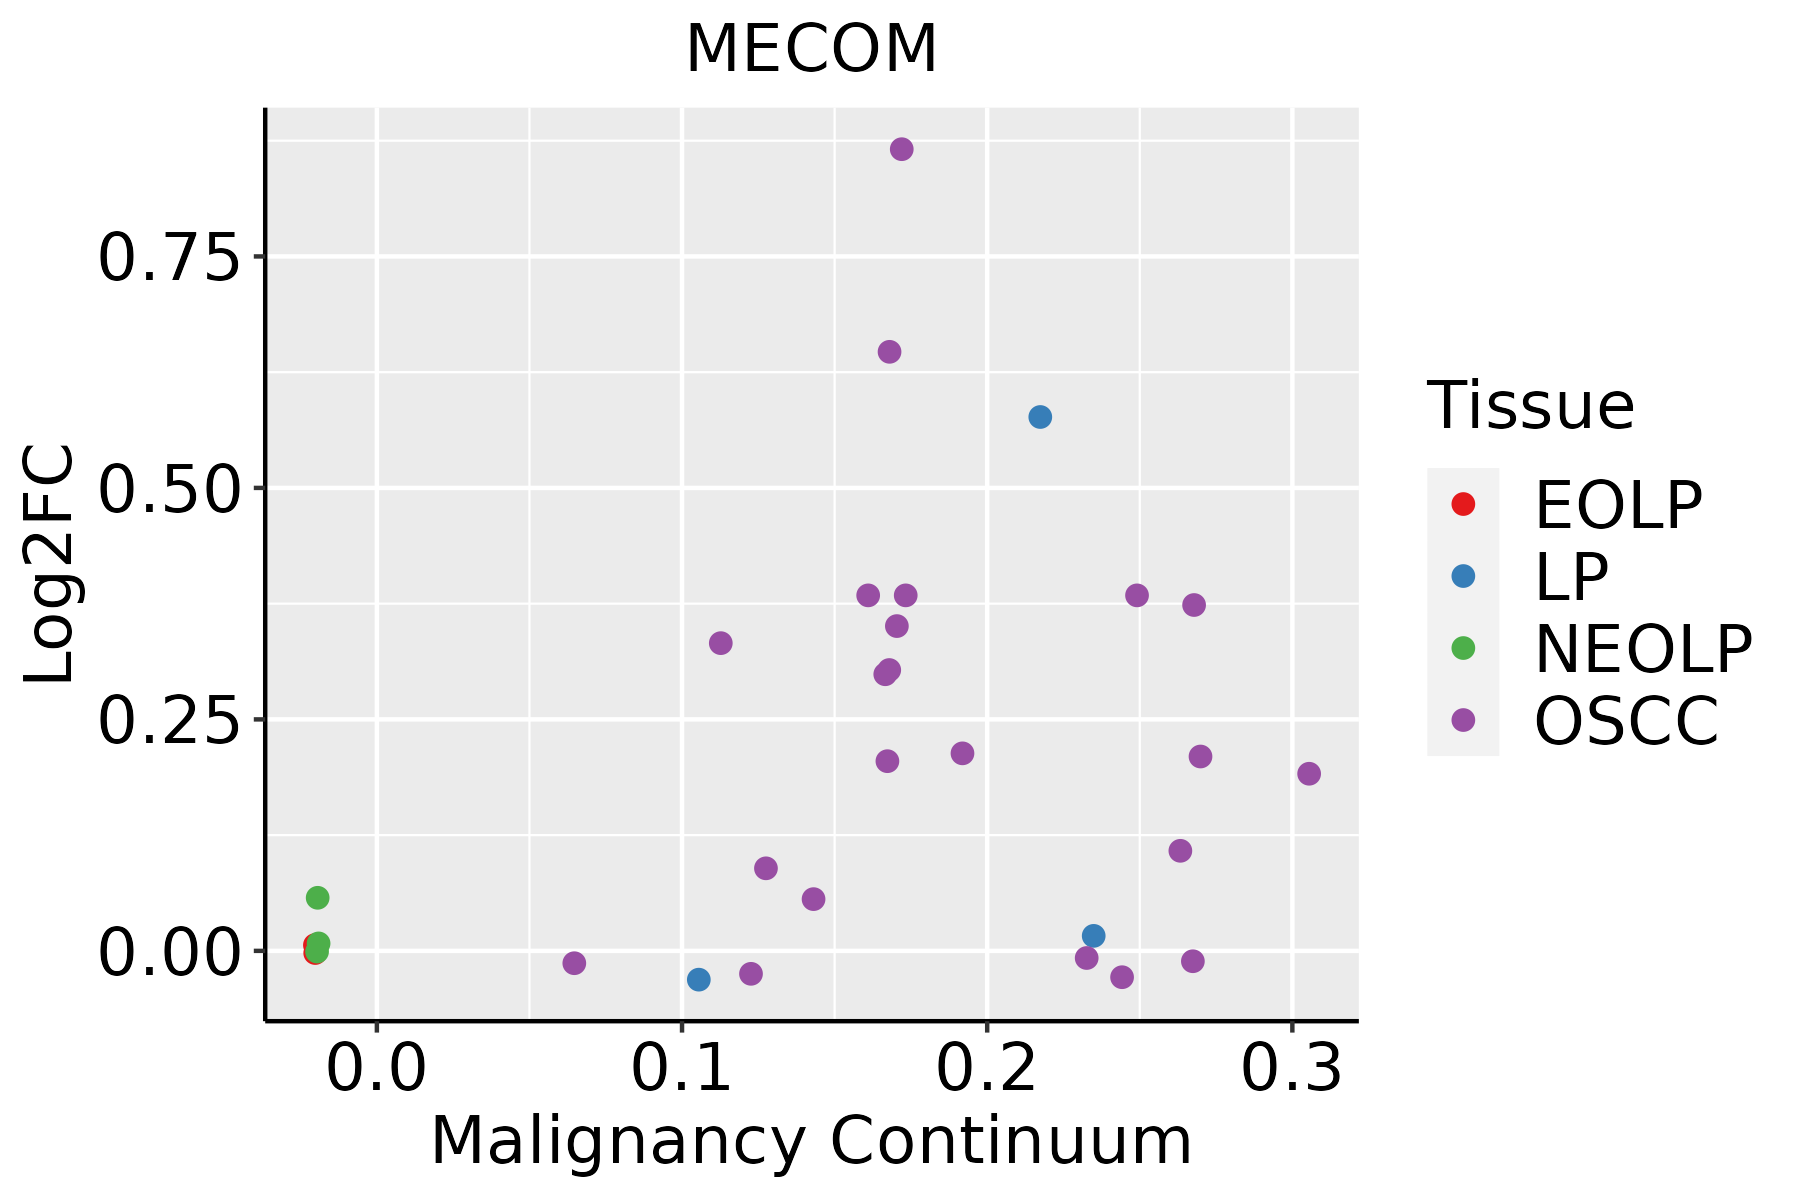 | EOLP: Erosive Oral lichen planus |
| LP: leukoplakia | ||
| NEOLP: Non-erosive oral lichen planus | ||
| OSCC: Oral squamous cell carcinoma | ||
| Prostate | 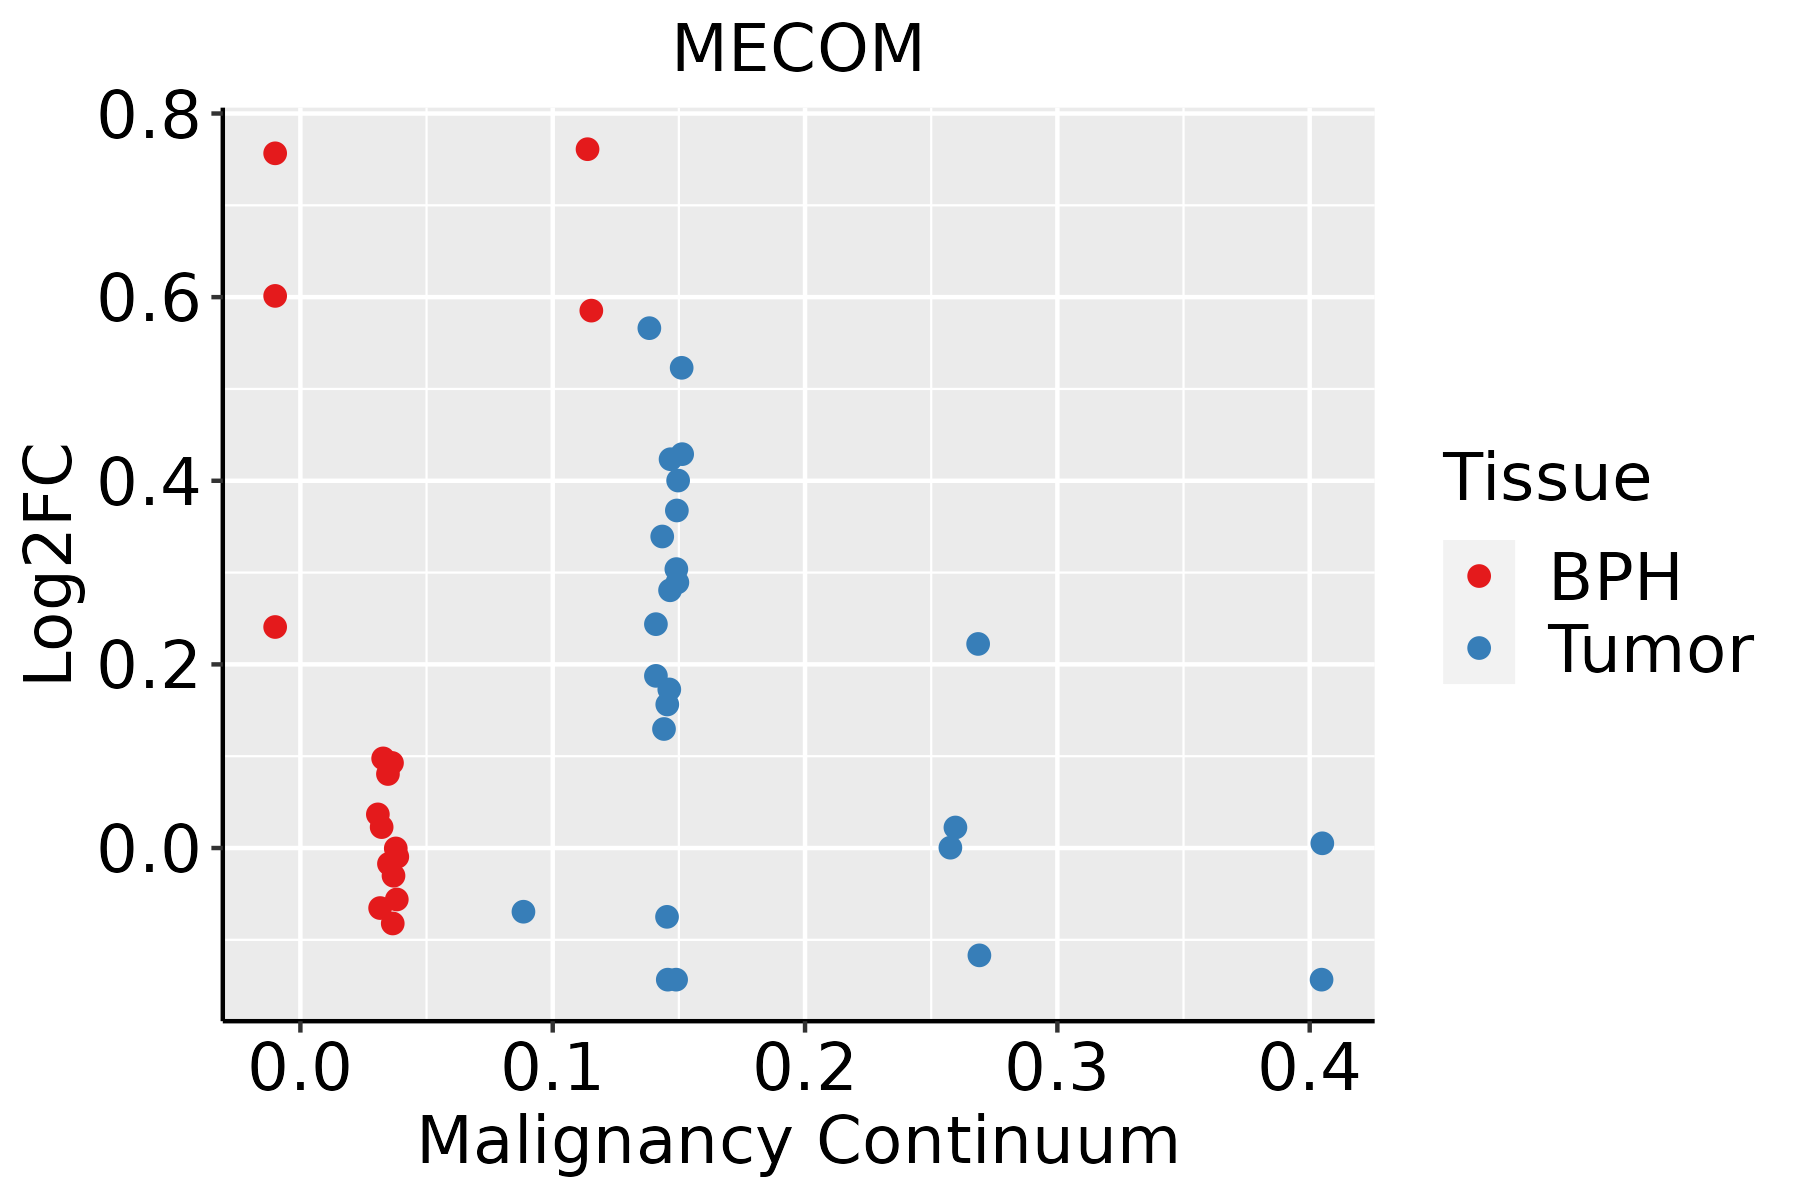 | BPH: Benign Prostatic Hyperplasia |
| ∗log2FC in expression of this searched gene in stem-like cells from each diseased tissue sample relative to stem-like cells in normal samples in each tissue plotted against the malignancy continuum. Samples are colored based on if they are from different disease stage. |
Top |
Malignant transformation related pathway analysis |
| Find out the enriched GO biological processes and KEGG pathways involved in transition from healthy to precancer to cancer |
| Tissue | Disease Stage | Enriched GO biological Processes |
| Colorectum | AD |  |
| Colorectum | SER |  |
| Colorectum | MSS |  |
| Colorectum | MSI-H |  |
| Colorectum | FAP |  |
| ∗Top 15 enriched GO BP terms are showed in the bar plot of each disease state in each tissue. Each row represents a significant GO biological process which is colored according to the -log10(p.adjust). |
| Page: 1 2 3 4 5 6 7 8 9 |
| GO ID | Tissue | Disease Stage | Description | Gene Ratio | Bg Ratio | pvalue | p.adjust | Count |
| GO:00310988 | Cervix | CC | stress-activated protein kinase signaling cascade | 58/2311 | 247/18723 | 8.02e-07 | 2.89e-05 | 58 |
| GO:00514038 | Cervix | CC | stress-activated MAPK cascade | 55/2311 | 239/18723 | 2.96e-06 | 8.31e-05 | 55 |
| GO:00703027 | Cervix | CC | regulation of stress-activated protein kinase signaling cascade | 46/2311 | 195/18723 | 9.35e-06 | 2.11e-04 | 46 |
| GO:00328727 | Cervix | CC | regulation of stress-activated MAPK cascade | 44/2311 | 192/18723 | 3.09e-05 | 5.10e-04 | 44 |
| GO:00063257 | Cervix | CC | chromatin organization | 78/2311 | 409/18723 | 5.40e-05 | 8.02e-04 | 78 |
| GO:00165705 | Cervix | CC | histone modification | 84/2311 | 463/18723 | 1.70e-04 | 2.01e-03 | 84 |
| GO:00349685 | Cervix | CC | histone lysine methylation | 27/2311 | 115/18723 | 6.61e-04 | 6.09e-03 | 27 |
| GO:00072545 | Cervix | CC | JNK cascade | 35/2311 | 167/18723 | 1.10e-03 | 9.09e-03 | 35 |
| GO:00434099 | Cervix | CC | negative regulation of MAPK cascade | 37/2311 | 180/18723 | 1.17e-03 | 9.50e-03 | 37 |
| GO:00165715 | Cervix | CC | histone methylation | 30/2311 | 141/18723 | 1.88e-03 | 1.39e-02 | 30 |
| GO:00180224 | Cervix | CC | peptidyl-lysine methylation | 28/2311 | 131/18723 | 2.43e-03 | 1.71e-02 | 28 |
| GO:00064795 | Cervix | CC | protein methylation | 36/2311 | 181/18723 | 2.46e-03 | 1.71e-02 | 36 |
| GO:00082135 | Cervix | CC | protein alkylation | 36/2311 | 181/18723 | 2.46e-03 | 1.71e-02 | 36 |
| GO:00463285 | Cervix | CC | regulation of JNK cascade | 28/2311 | 133/18723 | 3.06e-03 | 2.01e-02 | 28 |
| GO:00328737 | Cervix | CC | negative regulation of stress-activated MAPK cascade | 13/2311 | 51/18723 | 7.67e-03 | 4.07e-02 | 13 |
| GO:00703037 | Cervix | CC | negative regulation of stress-activated protein kinase signaling cascade | 13/2311 | 51/18723 | 7.67e-03 | 4.07e-02 | 13 |
| GO:00182054 | Cervix | CC | peptidyl-lysine modification | 62/2311 | 376/18723 | 1.04e-02 | 4.97e-02 | 62 |
| GO:004340913 | Cervix | HSIL_HPV | negative regulation of MAPK cascade | 16/737 | 180/18723 | 2.05e-03 | 2.13e-02 | 16 |
| GO:003287314 | Cervix | HSIL_HPV | negative regulation of stress-activated MAPK cascade | 7/737 | 51/18723 | 3.65e-03 | 3.25e-02 | 7 |
| GO:007030314 | Cervix | HSIL_HPV | negative regulation of stress-activated protein kinase signaling cascade | 7/737 | 51/18723 | 3.65e-03 | 3.25e-02 | 7 |
| Page: 1 2 3 4 5 6 7 8 9 10 11 12 13 14 |
| Pathway ID | Tissue | Disease Stage | Description | Gene Ratio | Bg Ratio | pvalue | p.adjust | qvalue | Count |
| hsa0522014 | Cervix | CC | Chronic myeloid leukemia | 21/1267 | 76/8465 | 3.08e-03 | 1.19e-02 | 7.03e-03 | 21 |
| hsa040109 | Cervix | CC | MAPK signaling pathway | 62/1267 | 302/8465 | 4.89e-03 | 1.67e-02 | 9.86e-03 | 62 |
| hsa0522015 | Cervix | CC | Chronic myeloid leukemia | 21/1267 | 76/8465 | 3.08e-03 | 1.19e-02 | 7.03e-03 | 21 |
| hsa0401012 | Cervix | CC | MAPK signaling pathway | 62/1267 | 302/8465 | 4.89e-03 | 1.67e-02 | 9.86e-03 | 62 |
| hsa00310 | Colorectum | AD | Lysine degradation | 27/2092 | 63/8465 | 1.17e-03 | 7.75e-03 | 4.94e-03 | 27 |
| hsa05220 | Colorectum | AD | Chronic myeloid leukemia | 31/2092 | 76/8465 | 1.41e-03 | 8.46e-03 | 5.39e-03 | 31 |
| hsa003101 | Colorectum | AD | Lysine degradation | 27/2092 | 63/8465 | 1.17e-03 | 7.75e-03 | 4.94e-03 | 27 |
| hsa052201 | Colorectum | AD | Chronic myeloid leukemia | 31/2092 | 76/8465 | 1.41e-03 | 8.46e-03 | 5.39e-03 | 31 |
| hsa052202 | Colorectum | MSS | Chronic myeloid leukemia | 29/1875 | 76/8465 | 1.10e-03 | 6.27e-03 | 3.84e-03 | 29 |
| hsa003102 | Colorectum | MSS | Lysine degradation | 24/1875 | 63/8465 | 2.94e-03 | 1.39e-02 | 8.50e-03 | 24 |
| hsa052203 | Colorectum | MSS | Chronic myeloid leukemia | 29/1875 | 76/8465 | 1.10e-03 | 6.27e-03 | 3.84e-03 | 29 |
| hsa003103 | Colorectum | MSS | Lysine degradation | 24/1875 | 63/8465 | 2.94e-03 | 1.39e-02 | 8.50e-03 | 24 |
| hsa003104 | Colorectum | FAP | Lysine degradation | 23/1404 | 63/8465 | 1.04e-04 | 9.46e-04 | 5.76e-04 | 23 |
| hsa052204 | Colorectum | FAP | Chronic myeloid leukemia | 23/1404 | 76/8465 | 2.14e-03 | 1.05e-02 | 6.39e-03 | 23 |
| hsa04010 | Colorectum | FAP | MAPK signaling pathway | 68/1404 | 302/8465 | 4.00e-03 | 1.67e-02 | 1.02e-02 | 68 |
| hsa003105 | Colorectum | FAP | Lysine degradation | 23/1404 | 63/8465 | 1.04e-04 | 9.46e-04 | 5.76e-04 | 23 |
| hsa052205 | Colorectum | FAP | Chronic myeloid leukemia | 23/1404 | 76/8465 | 2.14e-03 | 1.05e-02 | 6.39e-03 | 23 |
| hsa040101 | Colorectum | FAP | MAPK signaling pathway | 68/1404 | 302/8465 | 4.00e-03 | 1.67e-02 | 1.02e-02 | 68 |
| hsa040102 | Colorectum | CRC | MAPK signaling pathway | 56/1091 | 302/8465 | 2.76e-03 | 1.77e-02 | 1.20e-02 | 56 |
| hsa052206 | Colorectum | CRC | Chronic myeloid leukemia | 18/1091 | 76/8465 | 6.86e-03 | 3.37e-02 | 2.28e-02 | 18 |
| Page: 1 2 3 |
Top |
Cell-cell communication analysis |
| Identification of potential cell-cell interactions between two cell types and their ligand-receptor pairs for different disease states |
| Ligand | Receptor | LRpair | Pathway | Tissue | Disease Stage |
| Page: 1 |
Top |
Single-cell gene regulatory network inference analysis |
| Find out the significant the regulons (TFs) and the target genes of each regulon across cell types for different disease states |
| TF | Cell Type | Tissue | Disease Stage | Target Gene | RSS | Regulon Activity |
| MECOM | BAS | Breast | Healthy | LTBP4,SEMA3G,ARL15, etc. | 3.05e-01 |  |
| MECOM | PVA | Breast | ADJ | NOTCH4,GFOD1,SPRY1, etc. | 2.54e-01 |  |
| MECOM | MSC.ADIPO | Breast | DCIS | NOTCH4,GFOD1,SPRY1, etc. | 1.84e-01 |  |
| MECOM | PVA | Breast | Healthy | NOTCH4,GFOD1,SPRY1, etc. | 2.39e-01 | |
| MECOM | MSC.ADIPO | Breast | Healthy | NOTCH4,GFOD1,SPRY1, etc. | 2.08e-01 | |
| MECOM | MVA | Breast | Healthy | NOTCH4,GFOD1,SPRY1, etc. | 1.63e-01 | |
| MECOM | PVA | Breast | Precancer | NOTCH4,GFOD1,SPRY1, etc. | 2.79e-01 |  |
| MECOM | PLA | Endometrium | ADJ | ESR1,NPAS3,RHEX, etc. | 7.00e-02 |  |
| MECOM | PLA | Endometrium | EEC | ESR1,NPAS3,RHEX, etc. | 4.71e-02 |  |
| MECOM | PVA | Endometrium | ADJ | ARL15,EXOC6,KCTD12, etc. | 4.79e-01 | |
| ∗The dot plots of a searched regulon are shown for all cell subpopulations in each disease state of each tissue based on the regulon specific score inferred using pySCENIC and by calculating the average expression. |
| Page: 1 2 3 4 5 |
Top |
Somatic mutation of malignant transformation related genes |
| Annotation of somatic variants for genes involved in malignant transformation |
| Hugo Symbol | Variant Class | Variant Classification | dbSNP RS | HGVSc | HGVSp | HGVSp Short | SWISSPROT | BIOTYPE | SIFT | PolyPhen | Tumor Sample Barcode | Tissue | Histology | Sex | Age | Stage | Therapy Types | Drugs | Outcome |
| MECOM | SNV | Missense_Mutation | novel | c.64N>T | p.His22Tyr | p.H22Y | protein_coding | tolerated_low_confidence(0.65) | unknown(0) | TCGA-3C-AALI-01 | Breast | breast invasive carcinoma | Female | <65 | I/II | Unspecific | Poly E | Complete Response | |
| MECOM | SNV | Missense_Mutation | novel | c.1054C>T | p.His352Tyr | p.H352Y | Q03112 | protein_coding | tolerated(0.08) | probably_damaging(0.994) | TCGA-5L-AAT1-01 | Breast | breast invasive carcinoma | Female | <65 | III/IV | Hormone Therapy | letrozol | SD |
| MECOM | SNV | Missense_Mutation | rs762099223 | c.1694C>A | p.Ala565Asp | p.A565D | Q03112 | protein_coding | deleterious(0.02) | benign(0.229) | TCGA-A2-A0YJ-01 | Breast | breast invasive carcinoma | Female | <65 | III/IV | Chemotherapy | cytoxan | PD |
| MECOM | SNV | Missense_Mutation | novel | c.1511N>C | p.Gln504Pro | p.Q504P | Q03112 | protein_coding | tolerated(0.46) | benign(0.003) | TCGA-AN-A046-01 | Breast | breast invasive carcinoma | Female | >=65 | I/II | Unknown | Unknown | SD |
| MECOM | SNV | Missense_Mutation | rs748747672 | c.710N>T | p.Ser237Leu | p.S237L | Q03112 | protein_coding | deleterious(0) | probably_damaging(0.996) | TCGA-AN-A046-01 | Breast | breast invasive carcinoma | Female | >=65 | I/II | Unknown | Unknown | SD |
| MECOM | SNV | Missense_Mutation | novel | c.1412N>T | p.Glu471Val | p.E471V | Q03112 | protein_coding | deleterious(0) | probably_damaging(0.998) | TCGA-AR-A0TU-01 | Breast | breast invasive carcinoma | Female | <65 | I/II | Unspecific | Doxorubicin | SD |
| MECOM | SNV | Missense_Mutation | c.784N>C | p.Tyr262His | p.Y262H | Q03112 | protein_coding | deleterious(0) | probably_damaging(0.996) | TCGA-AR-A256-01 | Breast | breast invasive carcinoma | Female | <65 | I/II | Chemotherapy | doxorubicin | PD | |
| MECOM | SNV | Missense_Mutation | c.295N>A | p.Pro99Thr | p.P99T | protein_coding | deleterious(0) | probably_damaging(0.998) | TCGA-BH-A18T-01 | Breast | breast invasive carcinoma | Female | >=65 | I/II | Unknown | Unknown | PD | ||
| MECOM | SNV | Missense_Mutation | rs149892422 | c.256N>T | p.Arg86Cys | p.R86C | Q03112 | protein_coding | deleterious(0) | possibly_damaging(0.897) | TCGA-D8-A1JA-01 | Breast | breast invasive carcinoma | Female | <65 | III/IV | Chemotherapy | adriamycin | PD |
| MECOM | SNV | Missense_Mutation | c.568N>A | p.Asp190Asn | p.D190N | Q03112 | protein_coding | tolerated(0.06) | possibly_damaging(0.787) | TCGA-D8-A27G-01 | Breast | breast invasive carcinoma | Female | >=65 | I/II | Unknown | Unknown | SD |
| Page: 1 2 3 4 5 6 7 8 9 10 11 12 13 14 15 16 17 18 |
Top |
Related drugs of malignant transformation related genes |
| Identification of chemicals and drugs interact with genes involved in malignant transfromation |
| (DGIdb 4.0) |
| Entrez ID | Symbol | Category | Interaction Types | Drug Claim Name | Drug Name | PMIDs |
| Page: 1 |

Copyright 2023-Present -The University of Texas Health Science Center at Houston |