
|
|||||
|
 | |
| |
| |
| |
| |
| |
|
Gene: ME3 |
Gene summary for ME3 |
| Gene information | Species | Human | Gene symbol | ME3 | Gene ID | 10873 |
| Gene name | malic enzyme 3 | |
| Gene Alias | NADP-ME | |
| Cytomap | 11q14.2 | |
| Gene Type | protein-coding | GO ID | GO:0006082 | UniProtAcc | Q16798 |
Top |
Malignant transformation analysis |
| Identification of the aberrant gene expression in precancerous and cancerous lesions by comparing the gene expression of stem-like cells in diseased tissues with normal stem cells |
| Entrez ID | Symbol | Replicates | Species | Organ | Tissue | Adj P-value | Log2FC | Malignancy |
| 10873 | ME3 | male-WTA | Human | Thyroid | PTC | 3.36e-07 | 1.03e-01 | 0.1037 |
| 10873 | ME3 | PTC01 | Human | Thyroid | PTC | 5.59e-05 | 7.20e-02 | 0.1899 |
| 10873 | ME3 | PTC04 | Human | Thyroid | PTC | 1.39e-05 | 1.22e-01 | 0.1927 |
| 10873 | ME3 | PTC06 | Human | Thyroid | PTC | 1.09e-09 | 3.08e-01 | 0.2057 |
| 10873 | ME3 | PTC07 | Human | Thyroid | PTC | 7.76e-10 | 1.49e-01 | 0.2044 |
| 10873 | ME3 | ATC09 | Human | Thyroid | ATC | 2.33e-04 | 3.04e-01 | 0.2871 |
| 10873 | ME3 | ATC12 | Human | Thyroid | ATC | 1.58e-03 | 1.02e-01 | 0.34 |
| 10873 | ME3 | ATC1 | Human | Thyroid | ATC | 1.57e-04 | 3.54e-01 | 0.2878 |
| 10873 | ME3 | ATC2 | Human | Thyroid | ATC | 1.12e-18 | 1.14e+00 | 0.34 |
| 10873 | ME3 | ATC4 | Human | Thyroid | ATC | 9.88e-04 | 1.40e-01 | 0.34 |
| Page: 1 |
| Tissue | Expression Dynamics | Abbreviation |
| Thyroid | 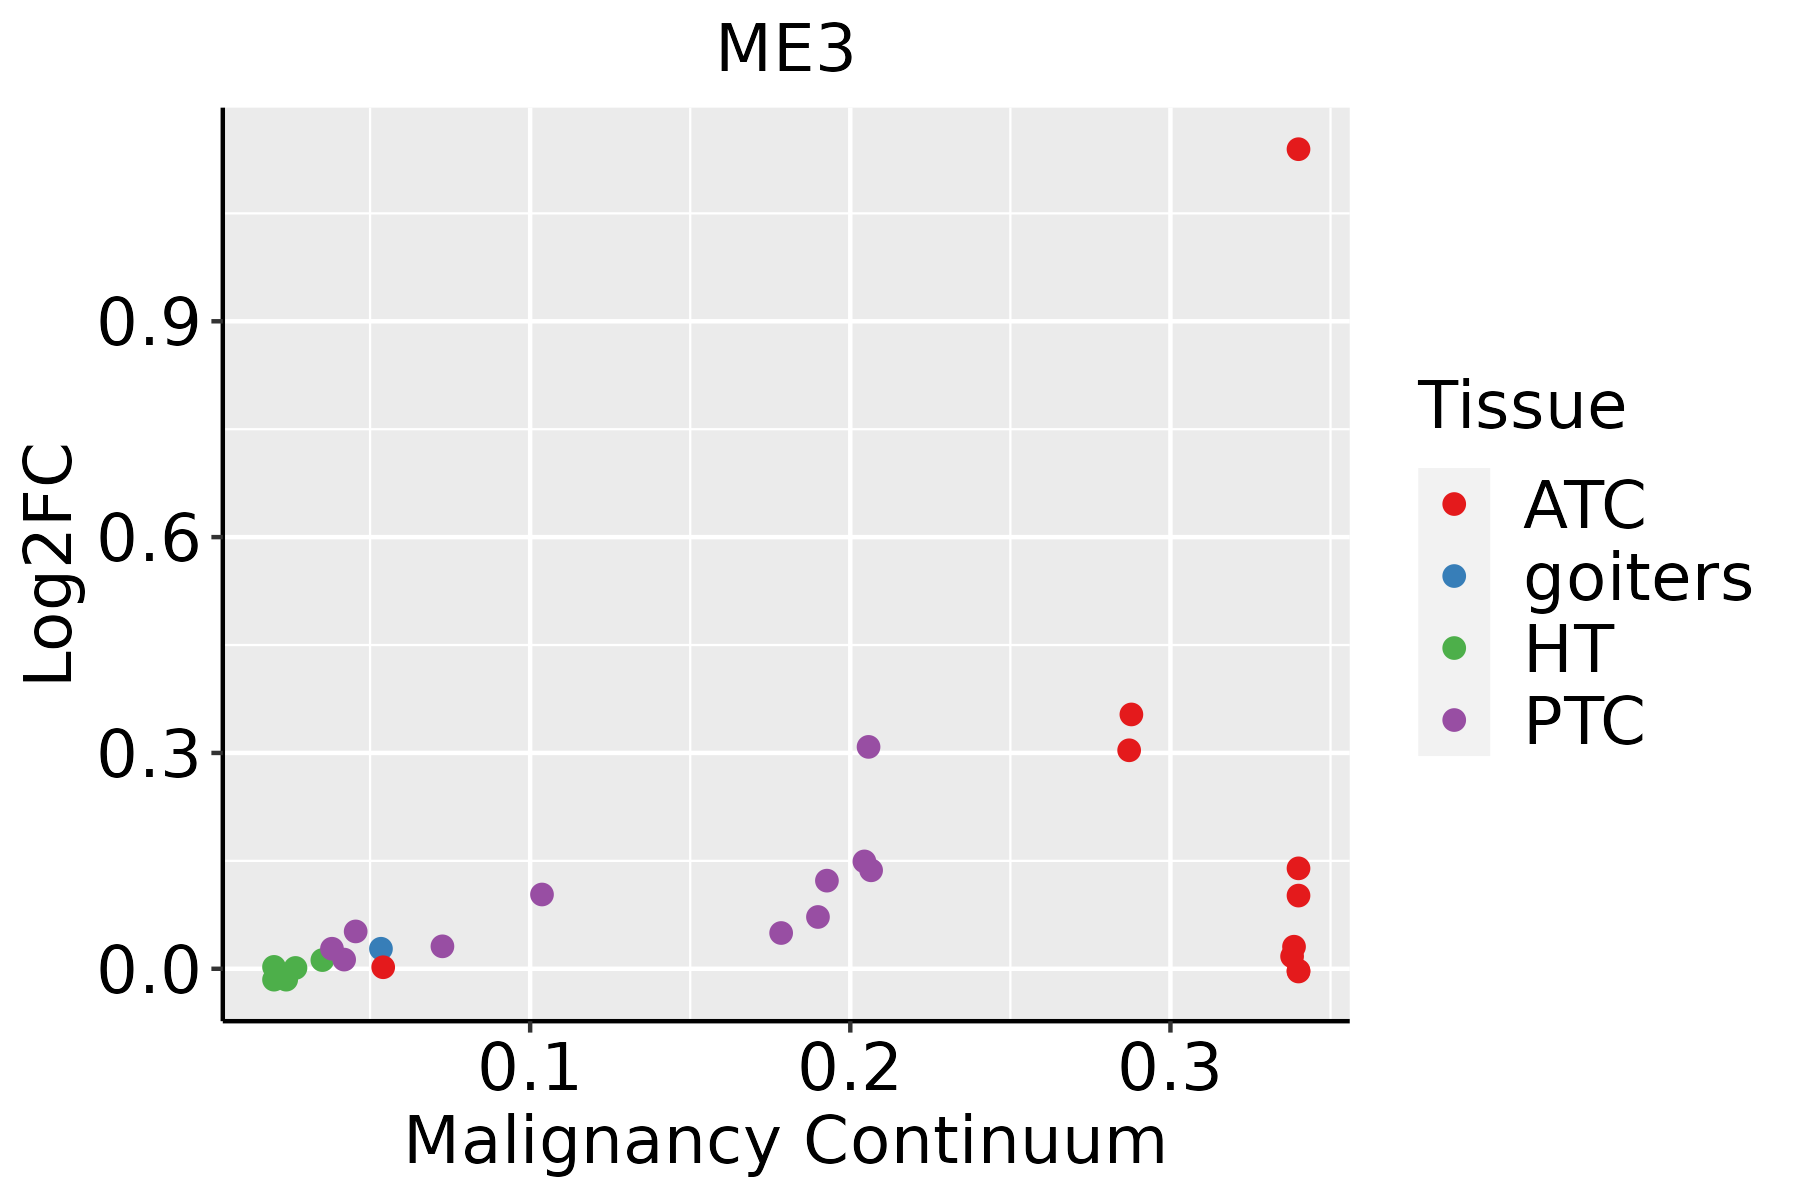 | ATC: Anaplastic thyroid cancer |
| HT: Hashimoto's thyroiditis | ||
| PTC: Papillary thyroid cancer |
| ∗log2FC in expression of this searched gene in stem-like cells from each diseased tissue sample relative to stem-like cells in normal samples in each tissue plotted against the malignancy continuum. Samples are colored based on if they are from different disease stage. |
Top |
Malignant transformation related pathway analysis |
| Find out the enriched GO biological processes and KEGG pathways involved in transition from healthy to precancer to cancer |
| Tissue | Disease Stage | Enriched GO biological Processes |
| Colorectum | AD |  |
| Colorectum | SER |  |
| Colorectum | MSS |  |
| Colorectum | MSI-H |  |
| Colorectum | FAP |  |
| ∗Top 15 enriched GO BP terms are showed in the bar plot of each disease state in each tissue. Each row represents a significant GO biological process which is colored according to the -log10(p.adjust). |
| Page: 1 2 3 4 5 6 7 8 9 |
| GO ID | Tissue | Disease Stage | Description | Gene Ratio | Bg Ratio | pvalue | p.adjust | Count |
| GO:000920614 | Breast | IDC | purine ribonucleoside triphosphate biosynthetic process | 24/1434 | 68/18723 | 7.70e-11 | 1.07e-08 | 24 |
| GO:000914514 | Breast | IDC | purine nucleoside triphosphate biosynthetic process | 24/1434 | 69/18723 | 1.10e-10 | 1.38e-08 | 24 |
| GO:000914214 | Breast | IDC | nucleoside triphosphate biosynthetic process | 26/1434 | 85/18723 | 4.72e-10 | 5.06e-08 | 26 |
| GO:000920113 | Breast | IDC | ribonucleoside triphosphate biosynthetic process | 24/1434 | 74/18723 | 5.73e-10 | 6.03e-08 | 24 |
| GO:000914414 | Breast | IDC | purine nucleoside triphosphate metabolic process | 26/1434 | 88/18723 | 1.09e-09 | 1.07e-07 | 26 |
| GO:000920514 | Breast | IDC | purine ribonucleoside triphosphate metabolic process | 25/1434 | 82/18723 | 1.10e-09 | 1.07e-07 | 25 |
| GO:000914114 | Breast | IDC | nucleoside triphosphate metabolic process | 29/1434 | 112/18723 | 3.68e-09 | 3.03e-07 | 29 |
| GO:000919913 | Breast | IDC | ribonucleoside triphosphate metabolic process | 25/1434 | 89/18723 | 7.22e-09 | 5.47e-07 | 25 |
| GO:000915214 | Breast | IDC | purine ribonucleotide biosynthetic process | 34/1434 | 169/18723 | 1.63e-07 | 8.92e-06 | 34 |
| GO:004639013 | Breast | IDC | ribose phosphate biosynthetic process | 36/1434 | 190/18723 | 3.40e-07 | 1.73e-05 | 36 |
| GO:000926013 | Breast | IDC | ribonucleotide biosynthetic process | 35/1434 | 182/18723 | 3.40e-07 | 1.73e-05 | 35 |
| GO:000915014 | Breast | IDC | purine ribonucleotide metabolic process | 55/1434 | 368/18723 | 1.30e-06 | 5.72e-05 | 55 |
| GO:001969314 | Breast | IDC | ribose phosphate metabolic process | 58/1434 | 396/18723 | 1.31e-06 | 5.73e-05 | 58 |
| GO:000675313 | Breast | IDC | nucleoside phosphate metabolic process | 68/1434 | 497/18723 | 2.01e-06 | 8.23e-05 | 68 |
| GO:000911713 | Breast | IDC | nucleotide metabolic process | 67/1434 | 489/18723 | 2.28e-06 | 9.05e-05 | 67 |
| GO:000925914 | Breast | IDC | ribonucleotide metabolic process | 56/1434 | 385/18723 | 2.47e-06 | 9.63e-05 | 56 |
| GO:000616413 | Breast | IDC | purine nucleotide biosynthetic process | 34/1434 | 191/18723 | 3.11e-06 | 1.15e-04 | 34 |
| GO:190129313 | Breast | IDC | nucleoside phosphate biosynthetic process | 41/1434 | 256/18723 | 5.15e-06 | 1.73e-04 | 41 |
| GO:000616314 | Breast | IDC | purine nucleotide metabolic process | 56/1434 | 396/18723 | 5.90e-06 | 1.90e-04 | 56 |
| GO:004693913 | Breast | IDC | nucleotide phosphorylation | 22/1434 | 101/18723 | 6.31e-06 | 1.98e-04 | 22 |
| Page: 1 2 3 4 5 6 7 8 9 10 11 12 13 14 15 16 17 18 19 20 21 22 23 24 25 26 27 28 29 30 31 32 33 |
| Pathway ID | Tissue | Disease Stage | Description | Gene Ratio | Bg Ratio | pvalue | p.adjust | qvalue | Count |
| Page: 1 |
Top |
Cell-cell communication analysis |
| Identification of potential cell-cell interactions between two cell types and their ligand-receptor pairs for different disease states |
| Ligand | Receptor | LRpair | Pathway | Tissue | Disease Stage |
| Page: 1 |
Top |
Single-cell gene regulatory network inference analysis |
| Find out the significant the regulons (TFs) and the target genes of each regulon across cell types for different disease states |
| TF | Cell Type | Tissue | Disease Stage | Target Gene | RSS | Regulon Activity |
| ∗The dot plots of a searched regulon are shown for all cell subpopulations in each disease state of each tissue based on the regulon specific score inferred using pySCENIC and by calculating the average expression. |
| Page: 1 |
Top |
Somatic mutation of malignant transformation related genes |
| Annotation of somatic variants for genes involved in malignant transformation |
| Hugo Symbol | Variant Class | Variant Classification | dbSNP RS | HGVSc | HGVSp | HGVSp Short | SWISSPROT | BIOTYPE | SIFT | PolyPhen | Tumor Sample Barcode | Tissue | Histology | Sex | Age | Stage | Therapy Types | Drugs | Outcome |
| ME3 | SNV | Missense_Mutation | novel | c.990N>A | p.His330Gln | p.H330Q | Q16798 | protein_coding | tolerated(0.5) | possibly_damaging(0.552) | TCGA-AN-A046-01 | Breast | breast invasive carcinoma | Female | >=65 | I/II | Unknown | Unknown | SD |
| ME3 | SNV | Missense_Mutation | c.121N>A | p.Ala41Thr | p.A41T | Q16798 | protein_coding | tolerated(0.53) | benign(0.003) | TCGA-BH-A0DG-01 | Breast | breast invasive carcinoma | Female | <65 | I/II | Chemotherapy | taxotere | CR | |
| ME3 | SNV | Missense_Mutation | novel | c.1081G>A | p.Glu361Lys | p.E361K | Q16798 | protein_coding | deleterious(0.04) | benign(0.162) | TCGA-C8-A12Q-01 | Breast | breast invasive carcinoma | Female | >=65 | III/IV | Unknown | Unknown | PD |
| ME3 | SNV | Missense_Mutation | c.724N>G | p.Leu242Val | p.L242V | Q16798 | protein_coding | deleterious(0.01) | benign(0.255) | TCGA-D8-A1JA-01 | Breast | breast invasive carcinoma | Female | <65 | III/IV | Chemotherapy | adriamycin | PD | |
| ME3 | SNV | Missense_Mutation | c.431N>T | p.Ala144Val | p.A144V | Q16798 | protein_coding | deleterious(0.01) | possibly_damaging(0.855) | TCGA-D8-A1XC-01 | Breast | breast invasive carcinoma | Female | >=65 | III/IV | Unknown | Unknown | PD | |
| ME3 | insertion | Nonsense_Mutation | novel | c.682_683insAGAGAAATGTTAAAAATAAGATATCAGCCACATAACAAGCACTAAT | p.Leu228GlnfsTer12 | p.L228Qfs*12 | Q16798 | protein_coding | TCGA-AN-A049-01 | Breast | breast invasive carcinoma | Female | <65 | I/II | Unknown | Unknown | SD | ||
| ME3 | SNV | Missense_Mutation | novel | c.1108N>A | p.Asp370Asn | p.D370N | Q16798 | protein_coding | deleterious(0.03) | possibly_damaging(0.654) | TCGA-HM-A4S6-01 | Cervix | cervical & endocervical cancer | Female | <65 | III/IV | Chemotherapy | cisplatin | CR |
| ME3 | SNV | Missense_Mutation | rs369256814 | c.590N>C | p.Leu197Pro | p.L197P | Q16798 | protein_coding | deleterious(0) | probably_damaging(1) | TCGA-A6-6138-01 | Colorectum | colon adenocarcinoma | Male | <65 | I/II | Unknown | Unknown | SD |
| ME3 | SNV | Missense_Mutation | c.446G>A | p.Gly149Asp | p.G149D | Q16798 | protein_coding | deleterious(0) | probably_damaging(0.995) | TCGA-AA-3819-01 | Colorectum | colon adenocarcinoma | Female | <65 | I/II | Unknown | Unknown | SD | |
| ME3 | SNV | Missense_Mutation | c.988C>A | p.His330Asn | p.H330N | Q16798 | protein_coding | tolerated(0.45) | benign(0.076) | TCGA-AA-3977-01 | Colorectum | colon adenocarcinoma | Male | >=65 | I/II | Unknown | Unknown | SD |
| Page: 1 2 3 4 5 6 7 8 |
Top |
Related drugs of malignant transformation related genes |
| Identification of chemicals and drugs interact with genes involved in malignant transfromation |
| (DGIdb 4.0) |
| Entrez ID | Symbol | Category | Interaction Types | Drug Claim Name | Drug Name | PMIDs |
| 10873 | ME3 | ENZYME | DHT | ANDROSTANOLONE | 1811987 | |
| 10873 | ME3 | ENZYME | ASPIRIN | ASPIRIN | 8611656 | |
| 10873 | ME3 | ENZYME | GLUTACONATE | GLUTACONATE | 19595601 | |
| 10873 | ME3 | ENZYME | MALEIC ACID | MALEIC ACID | 19595601 | |
| 10873 | ME3 | ENZYME | MALONIC ACID | MALONIC ACID | 19595601 |
| Page: 1 |

Copyright 2023-Present -The University of Texas Health Science Center at Houston |