
|
|||||
|
 | |
| |
| |
| |
| |
| |
|
Gene: ME2 |
Gene summary for ME2 |
| Gene information | Species | Human | Gene symbol | ME2 | Gene ID | 4200 |
| Gene name | malic enzyme 2 | |
| Gene Alias | ODS1 | |
| Cytomap | 18q21.2 | |
| Gene Type | protein-coding | GO ID | GO:0006082 | UniProtAcc | P23368 |
Top |
Malignant transformation analysis |
| Identification of the aberrant gene expression in precancerous and cancerous lesions by comparing the gene expression of stem-like cells in diseased tissues with normal stem cells |
| Entrez ID | Symbol | Replicates | Species | Organ | Tissue | Adj P-value | Log2FC | Malignancy |
| 4200 | ME2 | HTA11_347_2000001011 | Human | Colorectum | AD | 7.06e-05 | 3.20e-01 | -0.1954 |
| 4200 | ME2 | HTA11_696_2000001011 | Human | Colorectum | AD | 4.68e-02 | -1.89e-01 | -0.1464 |
| 4200 | ME2 | A002-C-010 | Human | Colorectum | FAP | 2.99e-02 | -1.63e-01 | 0.242 |
| 4200 | ME2 | A001-C-207 | Human | Colorectum | FAP | 8.50e-04 | -3.23e-01 | 0.1278 |
| 4200 | ME2 | A015-C-203 | Human | Colorectum | FAP | 6.11e-16 | -2.57e-01 | -0.1294 |
| 4200 | ME2 | A002-C-201 | Human | Colorectum | FAP | 3.19e-09 | -3.41e-01 | 0.0324 |
| 4200 | ME2 | A002-C-203 | Human | Colorectum | FAP | 1.78e-04 | -2.28e-01 | 0.2786 |
| 4200 | ME2 | A001-C-119 | Human | Colorectum | FAP | 1.50e-02 | -2.75e-01 | -0.1557 |
| 4200 | ME2 | A001-C-108 | Human | Colorectum | FAP | 2.45e-14 | -2.82e-01 | -0.0272 |
| 4200 | ME2 | A002-C-205 | Human | Colorectum | FAP | 6.00e-11 | -3.55e-01 | -0.1236 |
| 4200 | ME2 | A015-C-005 | Human | Colorectum | FAP | 2.20e-03 | -2.89e-01 | -0.0336 |
| 4200 | ME2 | A015-C-006 | Human | Colorectum | FAP | 1.79e-06 | -3.20e-01 | -0.0994 |
| 4200 | ME2 | A015-C-106 | Human | Colorectum | FAP | 7.19e-04 | -1.77e-01 | -0.0511 |
| 4200 | ME2 | A002-C-114 | Human | Colorectum | FAP | 7.03e-09 | -3.07e-01 | -0.1561 |
| 4200 | ME2 | A015-C-104 | Human | Colorectum | FAP | 5.39e-18 | -3.47e-01 | -0.1899 |
| 4200 | ME2 | A001-C-014 | Human | Colorectum | FAP | 1.05e-06 | -3.08e-01 | 0.0135 |
| 4200 | ME2 | A002-C-016 | Human | Colorectum | FAP | 1.31e-13 | -2.37e-01 | 0.0521 |
| 4200 | ME2 | A015-C-002 | Human | Colorectum | FAP | 4.21e-07 | -4.38e-01 | -0.0763 |
| 4200 | ME2 | A001-C-203 | Human | Colorectum | FAP | 4.24e-05 | -2.15e-01 | -0.0481 |
| 4200 | ME2 | A002-C-116 | Human | Colorectum | FAP | 5.46e-12 | -2.56e-01 | -0.0452 |
| Page: 1 2 3 4 5 6 |
| Tissue | Expression Dynamics | Abbreviation |
| Colorectum (GSE201348) |  | FAP: Familial adenomatous polyposis |
| CRC: Colorectal cancer | ||
| Colorectum (HTA11) |  | AD: Adenomas |
| SER: Sessile serrated lesions | ||
| MSI-H: Microsatellite-high colorectal cancer | ||
| MSS: Microsatellite stable colorectal cancer | ||
| Esophagus | 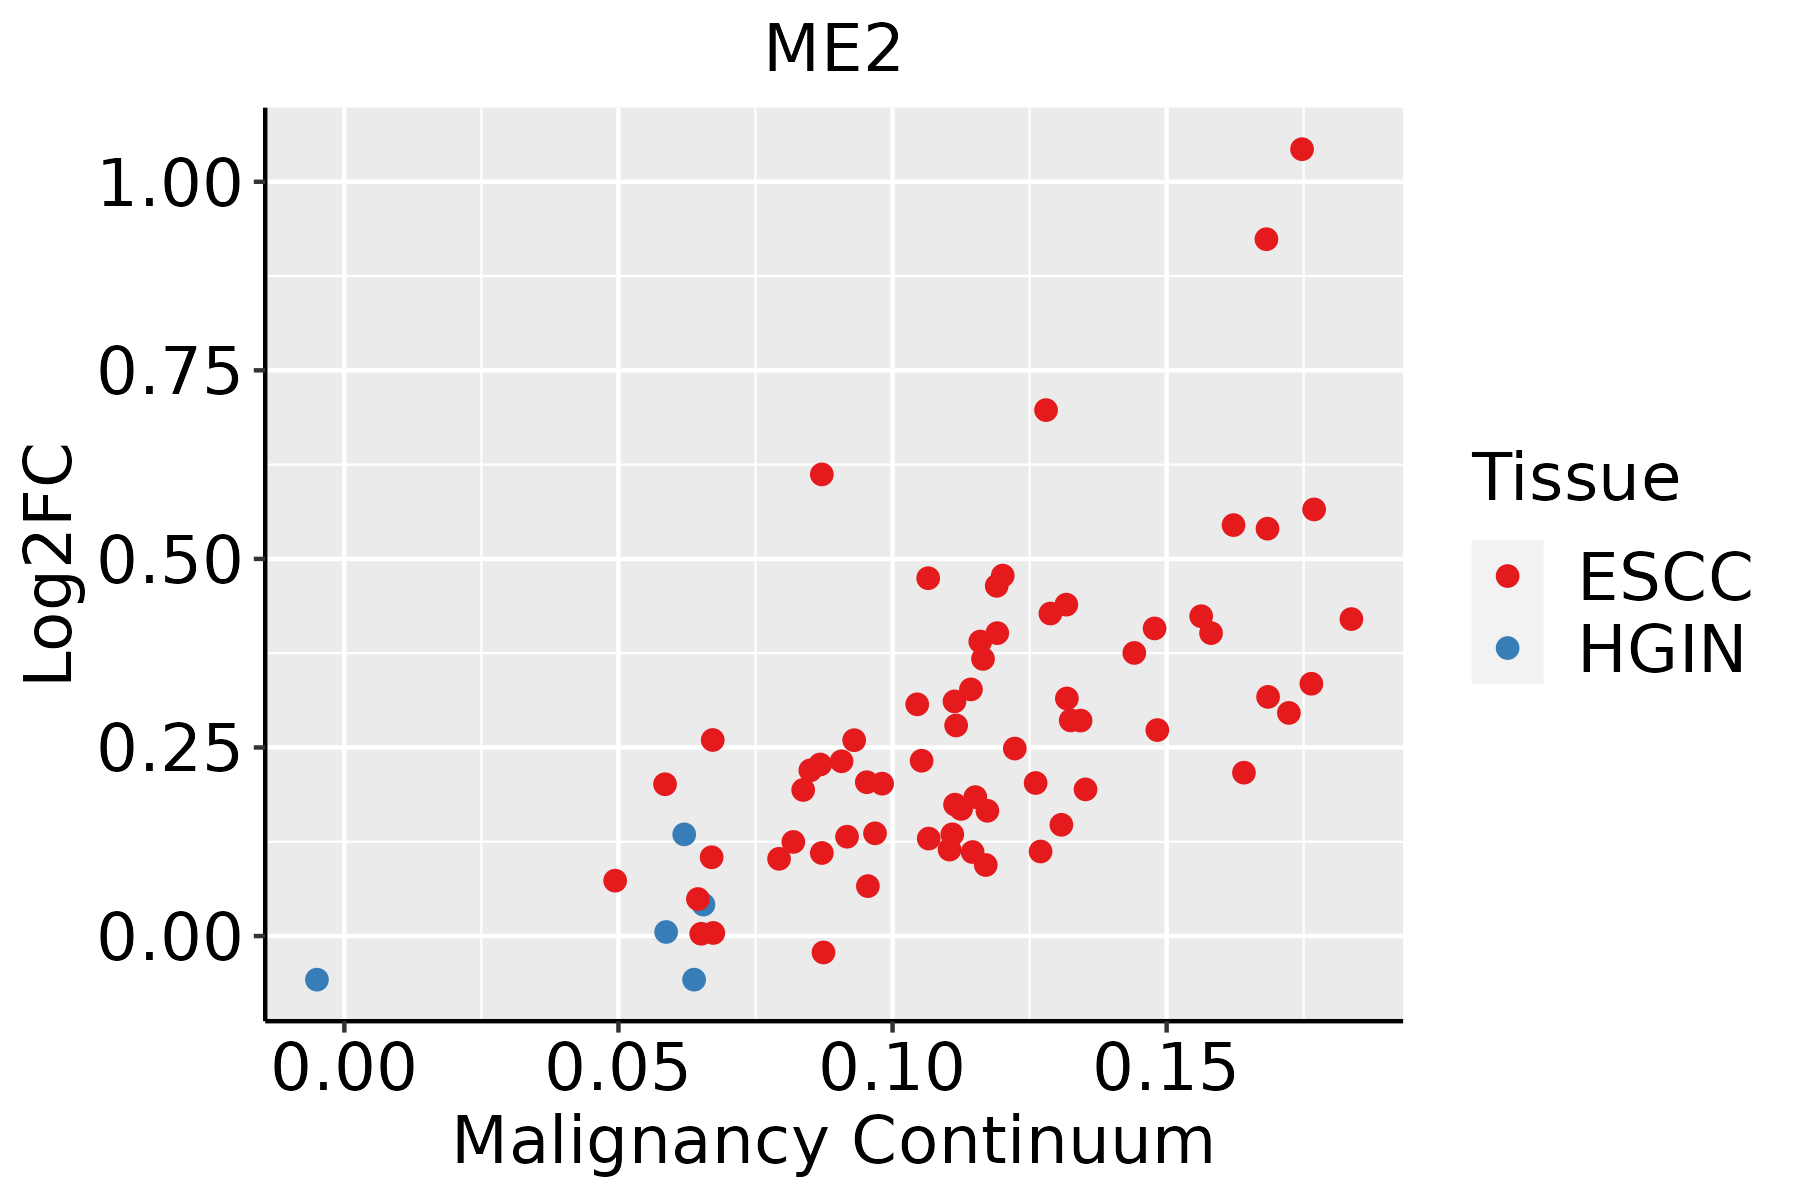 | ESCC: Esophageal squamous cell carcinoma |
| HGIN: High-grade intraepithelial neoplasias | ||
| LGIN: Low-grade intraepithelial neoplasias | ||
| Liver |  | HCC: Hepatocellular carcinoma |
| NAFLD: Non-alcoholic fatty liver disease | ||
| Oral Cavity |  | EOLP: Erosive Oral lichen planus |
| LP: leukoplakia | ||
| NEOLP: Non-erosive oral lichen planus | ||
| OSCC: Oral squamous cell carcinoma | ||
| Thyroid |  | ATC: Anaplastic thyroid cancer |
| HT: Hashimoto's thyroiditis | ||
| PTC: Papillary thyroid cancer |
| ∗log2FC in expression of this searched gene in stem-like cells from each diseased tissue sample relative to stem-like cells in normal samples in each tissue plotted against the malignancy continuum. Samples are colored based on if they are from different disease stage. |
Top |
Malignant transformation related pathway analysis |
| Find out the enriched GO biological processes and KEGG pathways involved in transition from healthy to precancer to cancer |
| Tissue | Disease Stage | Enriched GO biological Processes |
| Colorectum | AD |  |
| Colorectum | SER |  |
| Colorectum | MSS |  |
| Colorectum | MSI-H |  |
| Colorectum | FAP |  |
| ∗Top 15 enriched GO BP terms are showed in the bar plot of each disease state in each tissue. Each row represents a significant GO biological process which is colored according to the -log10(p.adjust). |
| Page: 1 2 3 4 5 6 7 8 9 |
| GO ID | Tissue | Disease Stage | Description | Gene Ratio | Bg Ratio | pvalue | p.adjust | Count |
| GO:00525479 | Breast | Precancer | regulation of peptidase activity | 71/1080 | 461/18723 | 2.72e-14 | 6.94e-12 | 71 |
| GO:00525489 | Breast | Precancer | regulation of endopeptidase activity | 67/1080 | 432/18723 | 1.06e-13 | 2.36e-11 | 67 |
| GO:00458629 | Breast | Precancer | positive regulation of proteolysis | 51/1080 | 372/18723 | 7.77e-09 | 5.70e-07 | 51 |
| GO:00109529 | Breast | Precancer | positive regulation of peptidase activity | 33/1080 | 197/18723 | 3.01e-08 | 1.89e-06 | 33 |
| GO:00104989 | Breast | Precancer | proteasomal protein catabolic process | 58/1080 | 490/18723 | 1.54e-07 | 8.05e-06 | 58 |
| GO:00109509 | Breast | Precancer | positive regulation of endopeptidase activity | 29/1080 | 179/18723 | 4.23e-07 | 1.90e-05 | 29 |
| GO:19033629 | Breast | Precancer | regulation of cellular protein catabolic process | 36/1080 | 255/18723 | 6.03e-07 | 2.55e-05 | 36 |
| GO:00421769 | Breast | Precancer | regulation of protein catabolic process | 47/1080 | 391/18723 | 1.50e-06 | 5.58e-05 | 47 |
| GO:19030509 | Breast | Precancer | regulation of proteolysis involved in cellular protein catabolic process | 31/1080 | 221/18723 | 4.10e-06 | 1.27e-04 | 31 |
| GO:00611369 | Breast | Precancer | regulation of proteasomal protein catabolic process | 24/1080 | 187/18723 | 1.99e-04 | 3.14e-03 | 24 |
| GO:005254714 | Breast | IDC | regulation of peptidase activity | 96/1434 | 461/18723 | 7.58e-20 | 6.15e-17 | 96 |
| GO:005254814 | Breast | IDC | regulation of endopeptidase activity | 88/1434 | 432/18723 | 1.20e-17 | 4.85e-15 | 88 |
| GO:004586214 | Breast | IDC | positive regulation of proteolysis | 66/1434 | 372/18723 | 9.76e-11 | 1.29e-08 | 66 |
| GO:001049814 | Breast | IDC | proteasomal protein catabolic process | 75/1434 | 490/18723 | 5.59e-09 | 4.41e-07 | 75 |
| GO:001095214 | Breast | IDC | positive regulation of peptidase activity | 40/1434 | 197/18723 | 1.04e-08 | 7.67e-07 | 40 |
| GO:004217614 | Breast | IDC | regulation of protein catabolic process | 63/1434 | 391/18723 | 1.32e-08 | 9.61e-07 | 63 |
| GO:190336214 | Breast | IDC | regulation of cellular protein catabolic process | 46/1434 | 255/18723 | 4.00e-08 | 2.68e-06 | 46 |
| GO:190305014 | Breast | IDC | regulation of proteolysis involved in cellular protein catabolic process | 41/1434 | 221/18723 | 9.77e-08 | 5.84e-06 | 41 |
| GO:001095013 | Breast | IDC | positive regulation of endopeptidase activity | 35/1434 | 179/18723 | 2.24e-07 | 1.17e-05 | 35 |
| GO:006113614 | Breast | IDC | regulation of proteasomal protein catabolic process | 33/1434 | 187/18723 | 5.24e-06 | 1.75e-04 | 33 |
| Page: 1 2 3 4 5 6 7 8 9 10 11 12 13 14 15 16 17 18 19 20 21 22 23 24 25 26 27 28 29 30 31 32 33 34 35 36 37 38 39 40 41 42 43 44 45 46 47 48 49 50 51 52 53 54 55 56 57 58 59 60 61 62 63 64 65 66 67 68 69 70 71 72 73 74 75 76 77 78 79 80 81 82 83 84 85 86 87 88 89 90 91 92 93 |
| Pathway ID | Tissue | Disease Stage | Description | Gene Ratio | Bg Ratio | pvalue | p.adjust | qvalue | Count |
| hsa01200 | Colorectum | AD | Carbon metabolism | 55/2092 | 115/8465 | 5.53e-08 | 8.42e-07 | 5.37e-07 | 55 |
| hsa00620 | Colorectum | AD | Pyruvate metabolism | 28/2092 | 47/8465 | 3.71e-07 | 5.41e-06 | 3.45e-06 | 28 |
| hsa012001 | Colorectum | AD | Carbon metabolism | 55/2092 | 115/8465 | 5.53e-08 | 8.42e-07 | 5.37e-07 | 55 |
| hsa006201 | Colorectum | AD | Pyruvate metabolism | 28/2092 | 47/8465 | 3.71e-07 | 5.41e-06 | 3.45e-06 | 28 |
| hsa012006 | Colorectum | FAP | Carbon metabolism | 38/1404 | 115/8465 | 1.04e-05 | 1.44e-04 | 8.76e-05 | 38 |
| hsa006206 | Colorectum | FAP | Pyruvate metabolism | 17/1404 | 47/8465 | 9.18e-04 | 5.20e-03 | 3.16e-03 | 17 |
| hsa012007 | Colorectum | FAP | Carbon metabolism | 38/1404 | 115/8465 | 1.04e-05 | 1.44e-04 | 8.76e-05 | 38 |
| hsa006207 | Colorectum | FAP | Pyruvate metabolism | 17/1404 | 47/8465 | 9.18e-04 | 5.20e-03 | 3.16e-03 | 17 |
| hsa012008 | Colorectum | CRC | Carbon metabolism | 28/1091 | 115/8465 | 5.43e-04 | 5.48e-03 | 3.72e-03 | 28 |
| hsa012009 | Colorectum | CRC | Carbon metabolism | 28/1091 | 115/8465 | 5.43e-04 | 5.48e-03 | 3.72e-03 | 28 |
| hsa0120023 | Esophagus | ESCC | Carbon metabolism | 79/4205 | 115/8465 | 2.50e-05 | 1.21e-04 | 6.22e-05 | 79 |
| hsa0062023 | Esophagus | ESCC | Pyruvate metabolism | 32/4205 | 47/8465 | 8.11e-03 | 1.94e-02 | 9.94e-03 | 32 |
| hsa0120033 | Esophagus | ESCC | Carbon metabolism | 79/4205 | 115/8465 | 2.50e-05 | 1.21e-04 | 6.22e-05 | 79 |
| hsa0062033 | Esophagus | ESCC | Pyruvate metabolism | 32/4205 | 47/8465 | 8.11e-03 | 1.94e-02 | 9.94e-03 | 32 |
| hsa0120041 | Liver | HCC | Carbon metabolism | 89/4020 | 115/8465 | 3.92e-11 | 6.56e-10 | 3.65e-10 | 89 |
| hsa0062021 | Liver | HCC | Pyruvate metabolism | 37/4020 | 47/8465 | 1.10e-05 | 8.03e-05 | 4.46e-05 | 37 |
| hsa0120051 | Liver | HCC | Carbon metabolism | 89/4020 | 115/8465 | 3.92e-11 | 6.56e-10 | 3.65e-10 | 89 |
| hsa0062031 | Liver | HCC | Pyruvate metabolism | 37/4020 | 47/8465 | 1.10e-05 | 8.03e-05 | 4.46e-05 | 37 |
| hsa0120014 | Oral cavity | OSCC | Carbon metabolism | 74/3704 | 115/8465 | 6.10e-06 | 3.05e-05 | 1.55e-05 | 74 |
| hsa006209 | Oral cavity | OSCC | Pyruvate metabolism | 31/3704 | 47/8465 | 1.74e-03 | 4.73e-03 | 2.41e-03 | 31 |
| Page: 1 2 |
Top |
Cell-cell communication analysis |
| Identification of potential cell-cell interactions between two cell types and their ligand-receptor pairs for different disease states |
| Ligand | Receptor | LRpair | Pathway | Tissue | Disease Stage |
| Page: 1 |
Top |
Single-cell gene regulatory network inference analysis |
| Find out the significant the regulons (TFs) and the target genes of each regulon across cell types for different disease states |
| TF | Cell Type | Tissue | Disease Stage | Target Gene | RSS | Regulon Activity |
| ∗The dot plots of a searched regulon are shown for all cell subpopulations in each disease state of each tissue based on the regulon specific score inferred using pySCENIC and by calculating the average expression. |
| Page: 1 |
Top |
Somatic mutation of malignant transformation related genes |
| Annotation of somatic variants for genes involved in malignant transformation |
| Hugo Symbol | Variant Class | Variant Classification | dbSNP RS | HGVSc | HGVSp | HGVSp Short | SWISSPROT | BIOTYPE | SIFT | PolyPhen | Tumor Sample Barcode | Tissue | Histology | Sex | Age | Stage | Therapy Types | Drugs | Outcome |
| ME2 | SNV | Missense_Mutation | c.985G>C | p.Glu329Gln | p.E329Q | P23368 | protein_coding | tolerated(0.24) | benign(0.045) | TCGA-AR-A0TT-01 | Breast | breast invasive carcinoma | Female | <65 | III/IV | Chemotherapy | doxorubicin | SD | |
| ME2 | SNV | Missense_Mutation | c.1312G>C | p.Glu438Gln | p.E438Q | P23368 | protein_coding | tolerated(0.34) | benign(0.009) | TCGA-BH-A18P-01 | Breast | breast invasive carcinoma | Female | <65 | I/II | Unknown | Unknown | PD | |
| ME2 | SNV | Missense_Mutation | c.1722A>T | p.Glu574Asp | p.E574D | P23368 | protein_coding | tolerated(0.15) | benign(0.006) | TCGA-D8-A1J8-01 | Breast | breast invasive carcinoma | Female | >=65 | I/II | Hormone Therapy | nolvadex | SD | |
| ME2 | SNV | Missense_Mutation | rs777347174 | c.437N>C | p.Ile146Thr | p.I146T | P23368 | protein_coding | deleterious(0) | probably_damaging(0.969) | TCGA-DG-A2KL-01 | Cervix | cervical & endocervical cancer | Female | <65 | I/II | Chemotherapy | cisplatin | SD |
| ME2 | SNV | Missense_Mutation | c.1099C>T | p.His367Tyr | p.H367Y | P23368 | protein_coding | deleterious(0.04) | probably_damaging(0.987) | TCGA-EK-A2PL-01 | Cervix | cervical & endocervical cancer | Female | <65 | III/IV | Unknown | Unknown | SD | |
| ME2 | SNV | Missense_Mutation | rs766432811 | c.763G>A | p.Glu255Lys | p.E255K | P23368 | protein_coding | deleterious(0) | probably_damaging(1) | TCGA-FU-A3HZ-01 | Cervix | cervical & endocervical cancer | Female | <65 | I/II | Chemotherapy | cisplatin | CR |
| ME2 | SNV | Missense_Mutation | c.1222N>A | p.Ala408Thr | p.A408T | P23368 | protein_coding | deleterious(0.05) | possibly_damaging(0.555) | TCGA-A6-3809-01 | Colorectum | colon adenocarcinoma | Female | >=65 | I/II | Unknown | Unknown | SD | |
| ME2 | SNV | Missense_Mutation | c.79N>T | p.Pro27Ser | p.P27S | P23368 | protein_coding | tolerated(0.56) | benign(0.003) | TCGA-AA-3864-01 | Colorectum | colon adenocarcinoma | Male | >=65 | I/II | Unknown | Unknown | SD | |
| ME2 | SNV | Missense_Mutation | novel | c.733N>G | p.Arg245Gly | p.R245G | P23368 | protein_coding | deleterious(0.01) | probably_damaging(0.963) | TCGA-AA-3950-01 | Colorectum | colon adenocarcinoma | Female | >=65 | I/II | Unknown | Unknown | SD |
| ME2 | SNV | Missense_Mutation | c.1014N>C | p.Gln338His | p.Q338H | P23368 | protein_coding | tolerated(0.49) | benign(0) | TCGA-AA-3977-01 | Colorectum | colon adenocarcinoma | Male | >=65 | I/II | Unknown | Unknown | SD |
| Page: 1 2 3 4 5 6 7 |
Top |
Related drugs of malignant transformation related genes |
| Identification of chemicals and drugs interact with genes involved in malignant transfromation |
| (DGIdb 4.0) |
| Entrez ID | Symbol | Category | Interaction Types | Drug Claim Name | Drug Name | PMIDs |
| Page: 1 |

Copyright 2023-Present -The University of Texas Health Science Center at Houston |