
|
|||||
|
 | |
| |
| |
| |
| |
| |
|
Gene: MDM4 |
Gene summary for MDM4 |
| Gene information | Species | Human | Gene symbol | MDM4 | Gene ID | 4194 |
| Gene name | MDM4 regulator of p53 | |
| Gene Alias | BMFS6 | |
| Cytomap | 1q32.1 | |
| Gene Type | protein-coding | GO ID | GO:0000122 | UniProtAcc | O15151 |
Top |
Malignant transformation analysis |
| Identification of the aberrant gene expression in precancerous and cancerous lesions by comparing the gene expression of stem-like cells in diseased tissues with normal stem cells |
| Entrez ID | Symbol | Replicates | Species | Organ | Tissue | Adj P-value | Log2FC | Malignancy |
| 4194 | MDM4 | HTA11_3410_2000001011 | Human | Colorectum | AD | 2.40e-09 | -3.86e-01 | 0.0155 |
| 4194 | MDM4 | HTA11_696_2000001011 | Human | Colorectum | AD | 3.76e-03 | -2.83e-01 | -0.1464 |
| 4194 | MDM4 | HTA11_866_2000001011 | Human | Colorectum | AD | 6.84e-03 | -2.63e-01 | -0.1001 |
| 4194 | MDM4 | HTA11_9408_2000001011 | Human | Colorectum | AD | 2.92e-03 | -7.15e-01 | 0.0451 |
| 4194 | MDM4 | HTA11_10711_2000001011 | Human | Colorectum | AD | 3.47e-03 | -3.19e-01 | 0.0338 |
| 4194 | MDM4 | HTA11_7696_3000711011 | Human | Colorectum | AD | 1.45e-07 | -3.73e-01 | 0.0674 |
| 4194 | MDM4 | HTA11_99999973899_84307 | Human | Colorectum | MSS | 4.32e-02 | -4.88e-01 | 0.2585 |
| 4194 | MDM4 | HTA11_99999974143_84620 | Human | Colorectum | MSS | 2.00e-10 | -3.61e-01 | 0.3005 |
| 4194 | MDM4 | A001-C-207 | Human | Colorectum | FAP | 1.06e-03 | -1.67e-01 | 0.1278 |
| 4194 | MDM4 | A015-C-203 | Human | Colorectum | FAP | 3.83e-24 | -1.35e-02 | -0.1294 |
| 4194 | MDM4 | A015-C-204 | Human | Colorectum | FAP | 1.78e-04 | -2.87e-02 | -0.0228 |
| 4194 | MDM4 | A014-C-040 | Human | Colorectum | FAP | 1.62e-02 | -3.89e-02 | -0.1184 |
| 4194 | MDM4 | A002-C-201 | Human | Colorectum | FAP | 5.09e-11 | -6.20e-02 | 0.0324 |
| 4194 | MDM4 | A001-C-119 | Human | Colorectum | FAP | 4.92e-17 | 4.75e-01 | -0.1557 |
| 4194 | MDM4 | A001-C-108 | Human | Colorectum | FAP | 2.40e-11 | 2.53e-02 | -0.0272 |
| 4194 | MDM4 | A002-C-205 | Human | Colorectum | FAP | 8.47e-24 | 1.57e-01 | -0.1236 |
| 4194 | MDM4 | A001-C-104 | Human | Colorectum | FAP | 3.98e-02 | 5.90e-02 | 0.0184 |
| 4194 | MDM4 | A015-C-006 | Human | Colorectum | FAP | 6.21e-14 | 1.02e-01 | -0.0994 |
| 4194 | MDM4 | A015-C-106 | Human | Colorectum | FAP | 2.48e-09 | -9.06e-02 | -0.0511 |
| 4194 | MDM4 | A002-C-114 | Human | Colorectum | FAP | 1.68e-17 | -9.09e-02 | -0.1561 |
| Page: 1 2 3 4 5 6 7 8 |
| Tissue | Expression Dynamics | Abbreviation |
| Colorectum (GSE201348) | 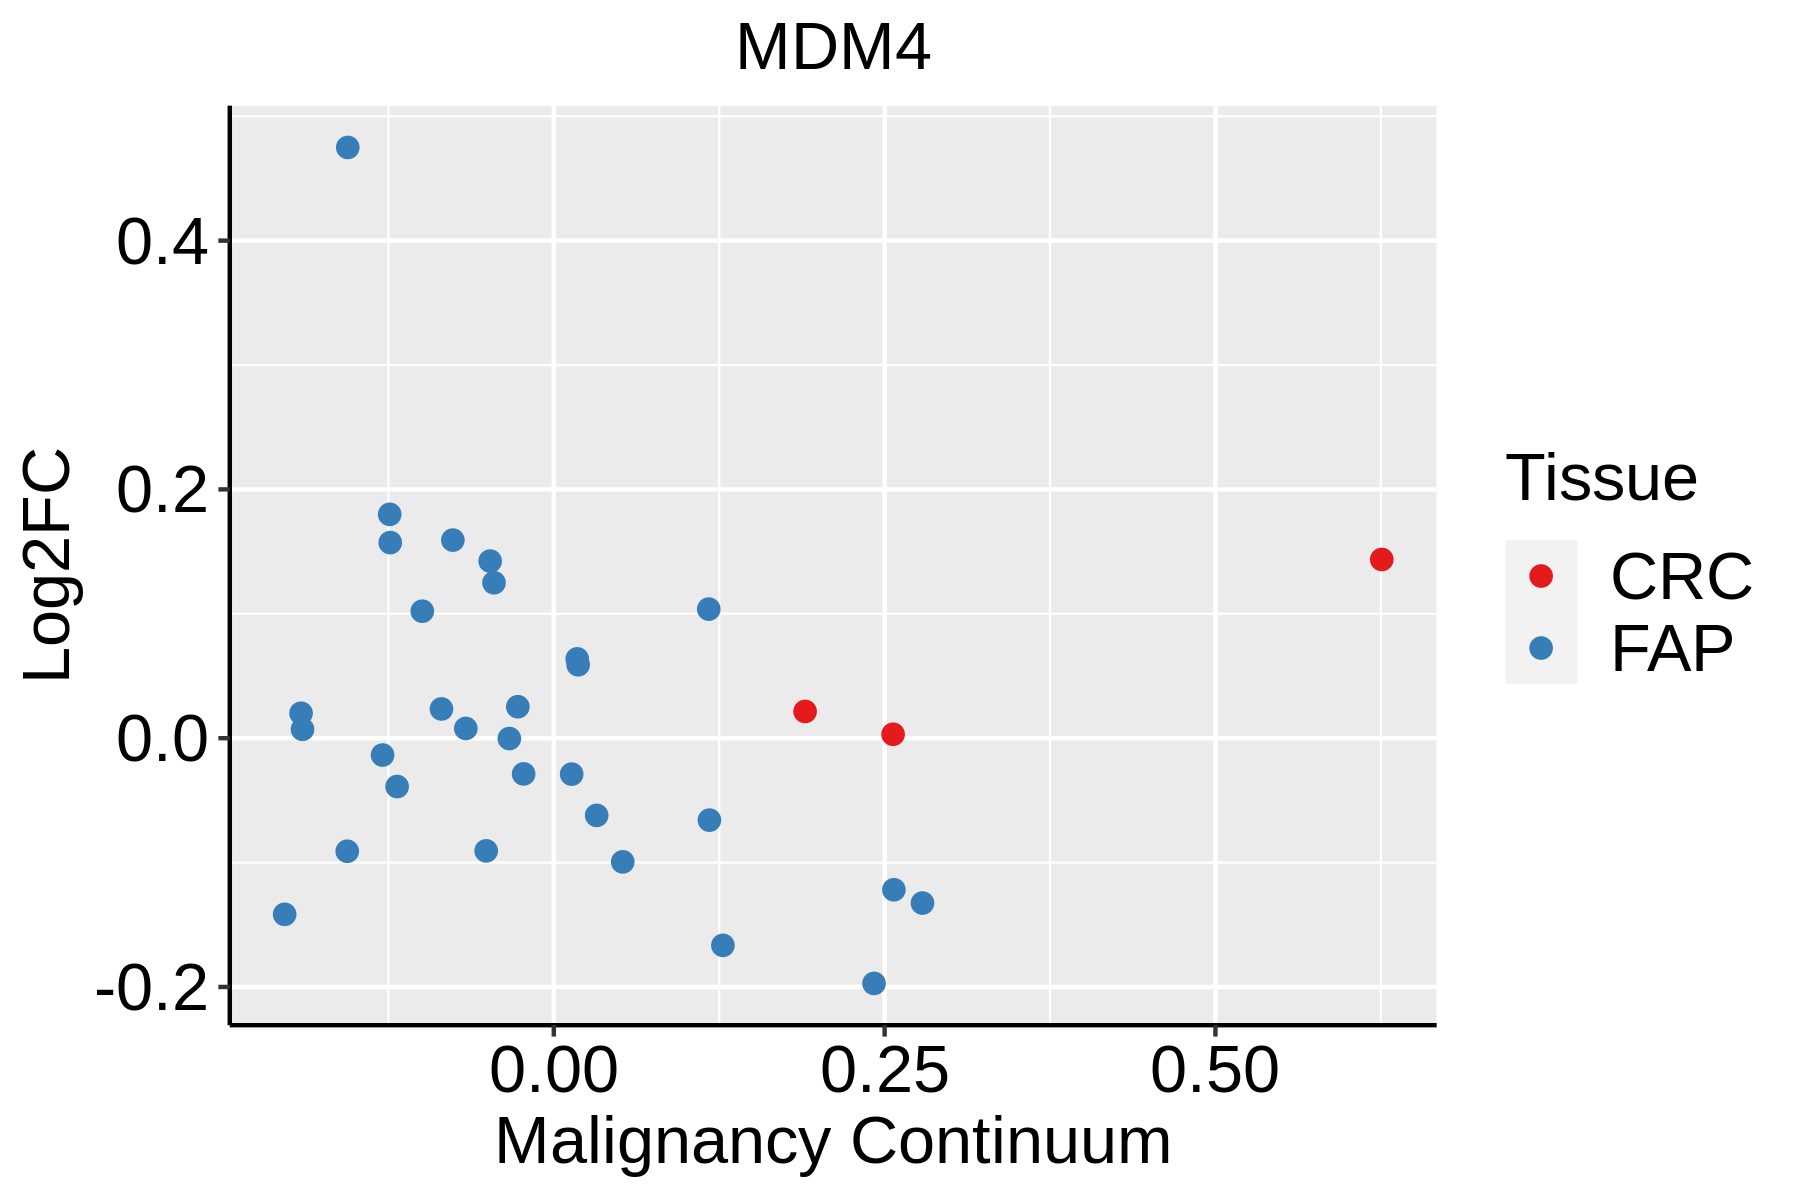 | FAP: Familial adenomatous polyposis |
| CRC: Colorectal cancer | ||
| Colorectum (HTA11) | 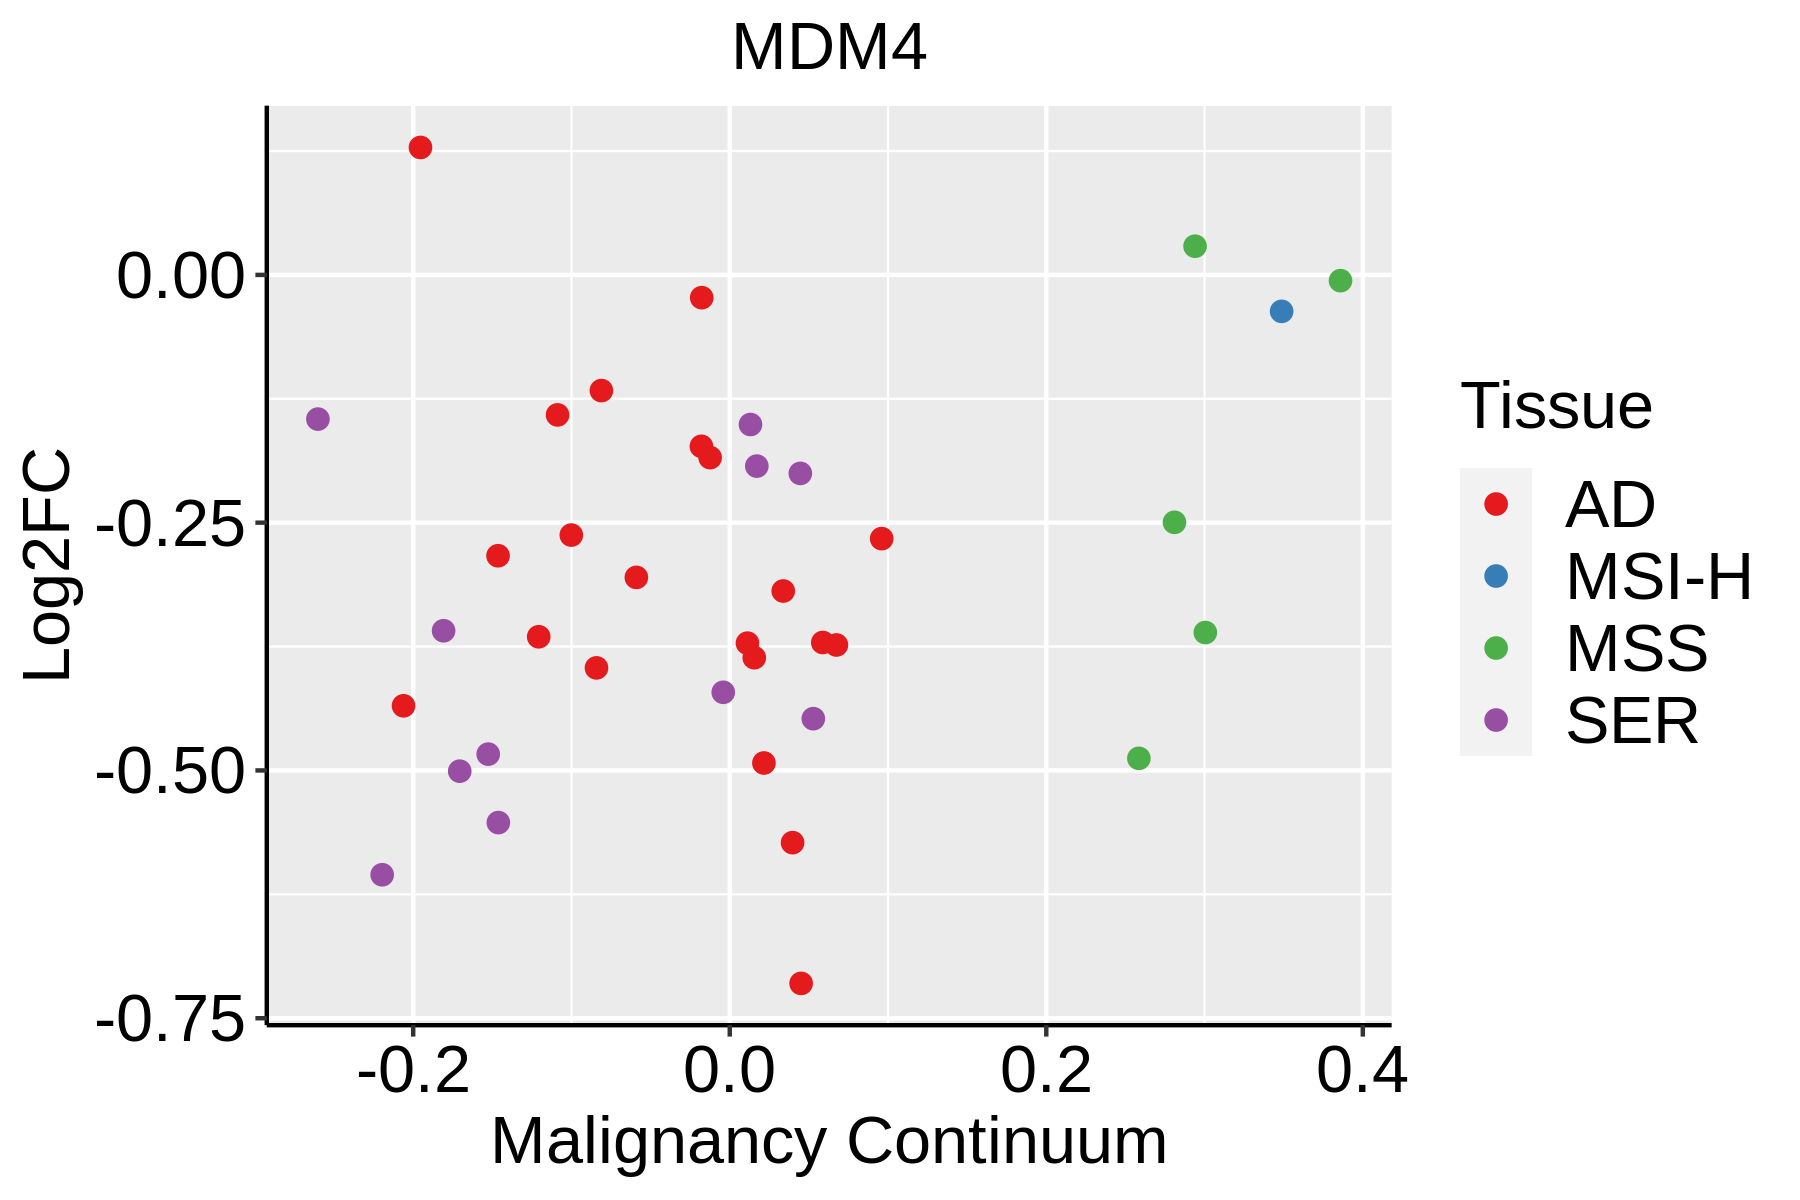 | AD: Adenomas |
| SER: Sessile serrated lesions | ||
| MSI-H: Microsatellite-high colorectal cancer | ||
| MSS: Microsatellite stable colorectal cancer | ||
| Esophagus | 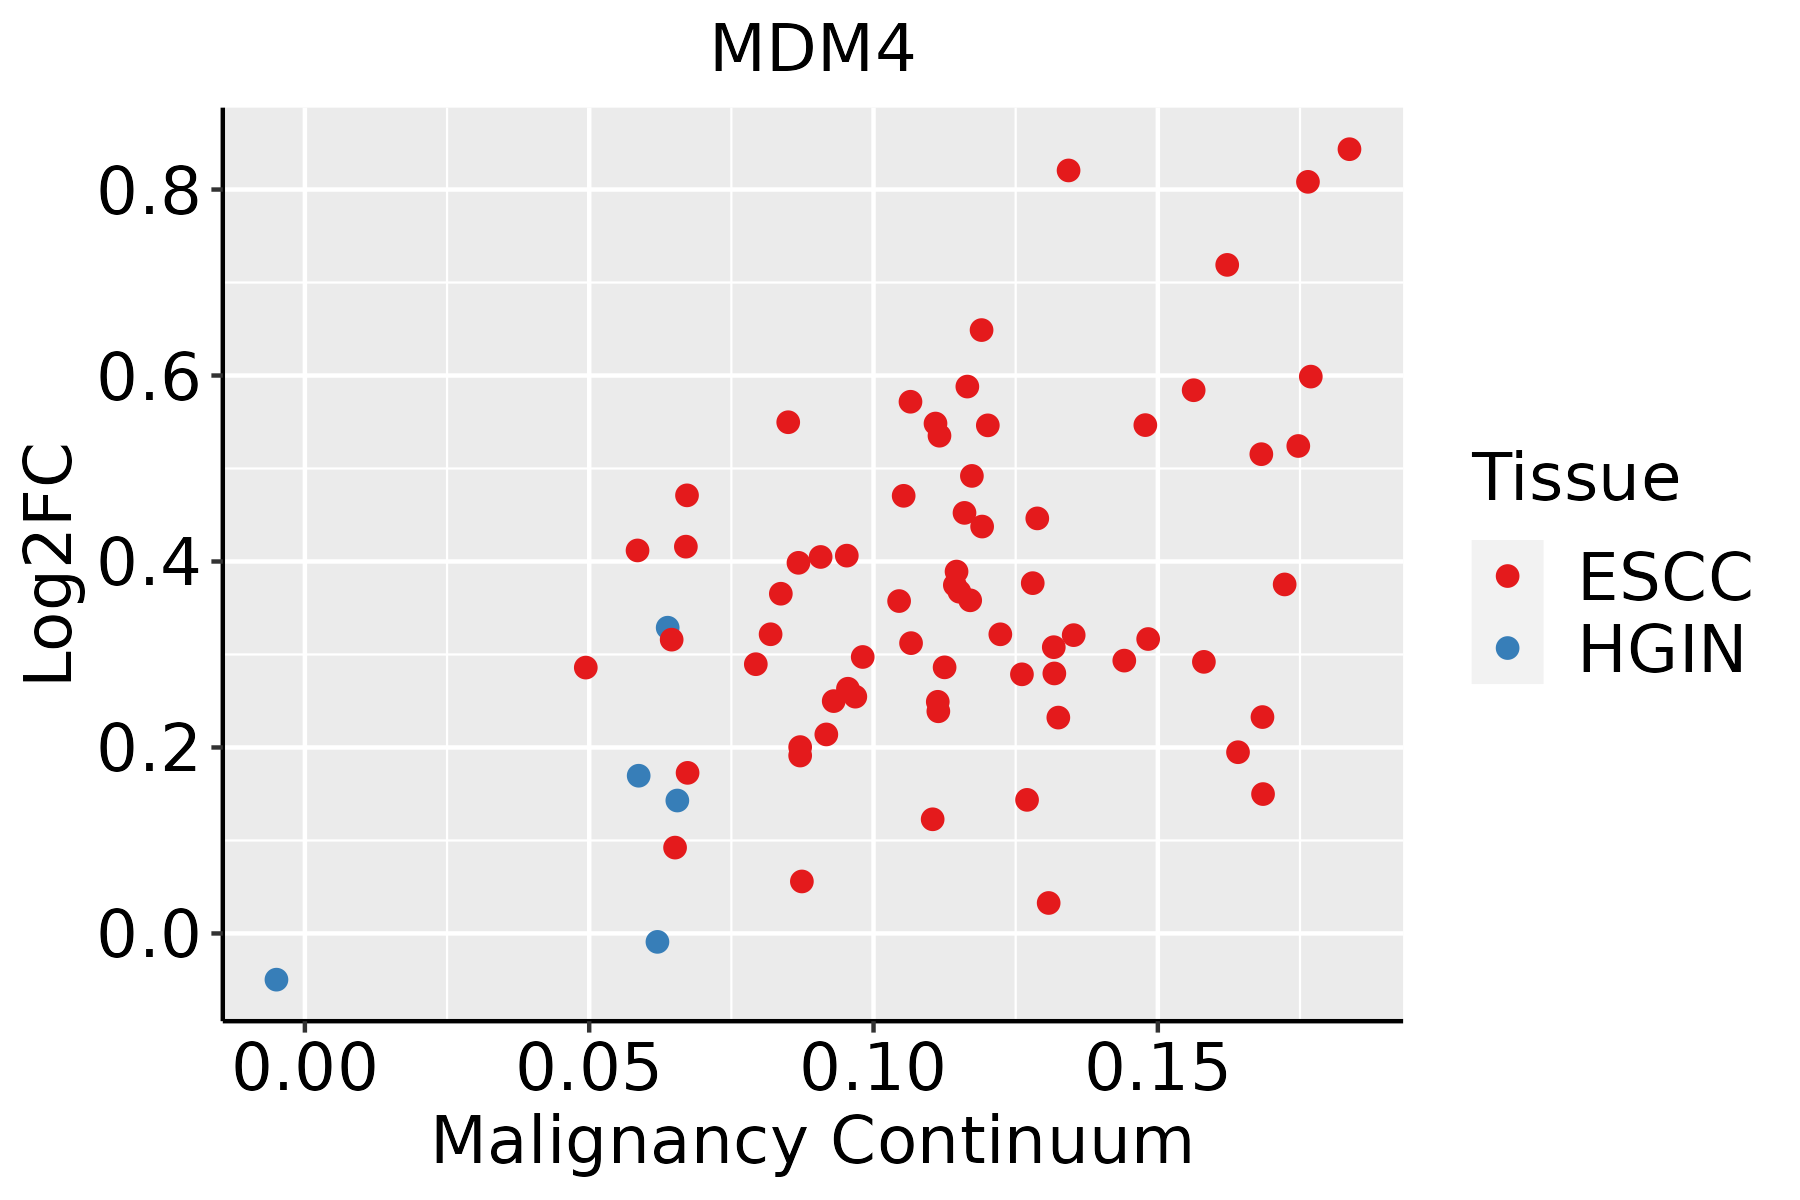 | ESCC: Esophageal squamous cell carcinoma |
| HGIN: High-grade intraepithelial neoplasias | ||
| LGIN: Low-grade intraepithelial neoplasias | ||
| Liver | 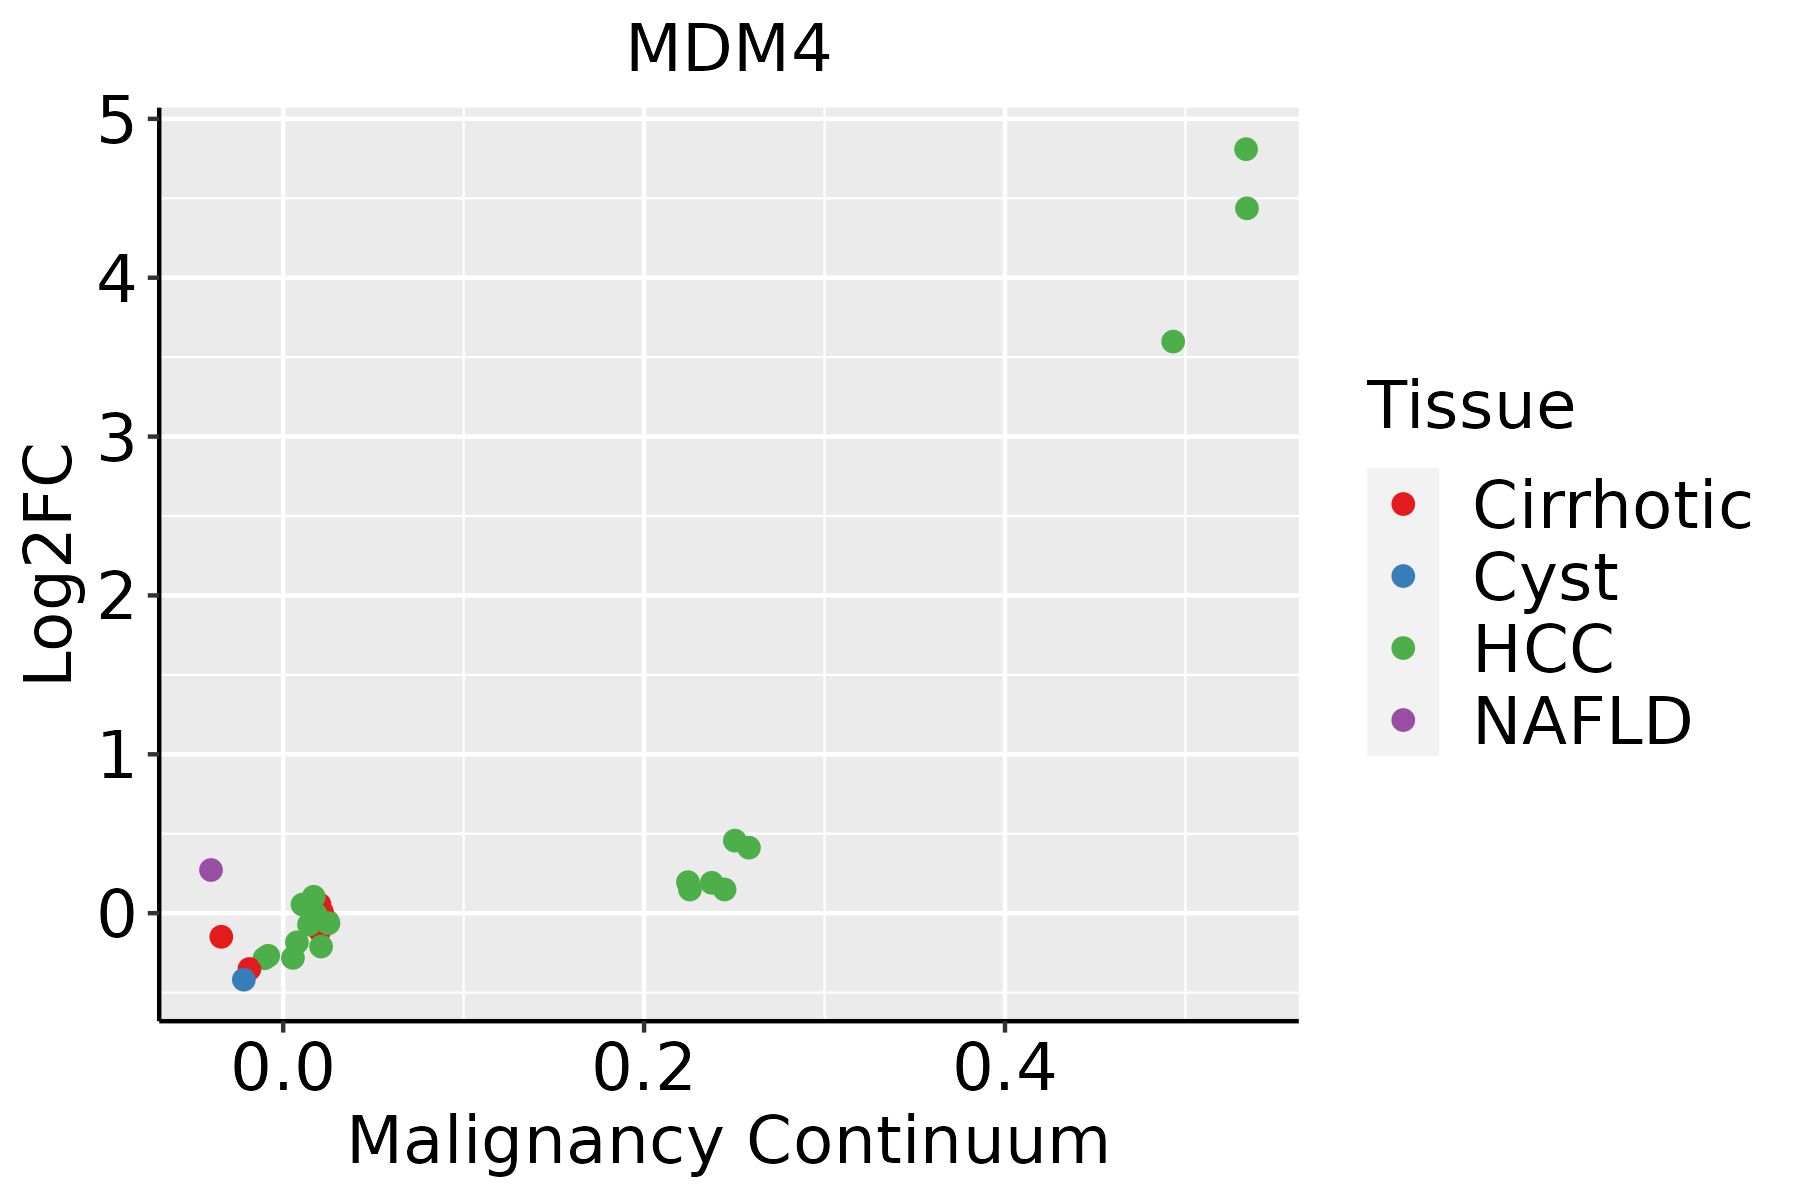 | HCC: Hepatocellular carcinoma |
| NAFLD: Non-alcoholic fatty liver disease | ||
| Lung |  | AAH: Atypical adenomatous hyperplasia |
| AIS: Adenocarcinoma in situ | ||
| IAC: Invasive lung adenocarcinoma | ||
| MIA: Minimally invasive adenocarcinoma | ||
| Oral Cavity | 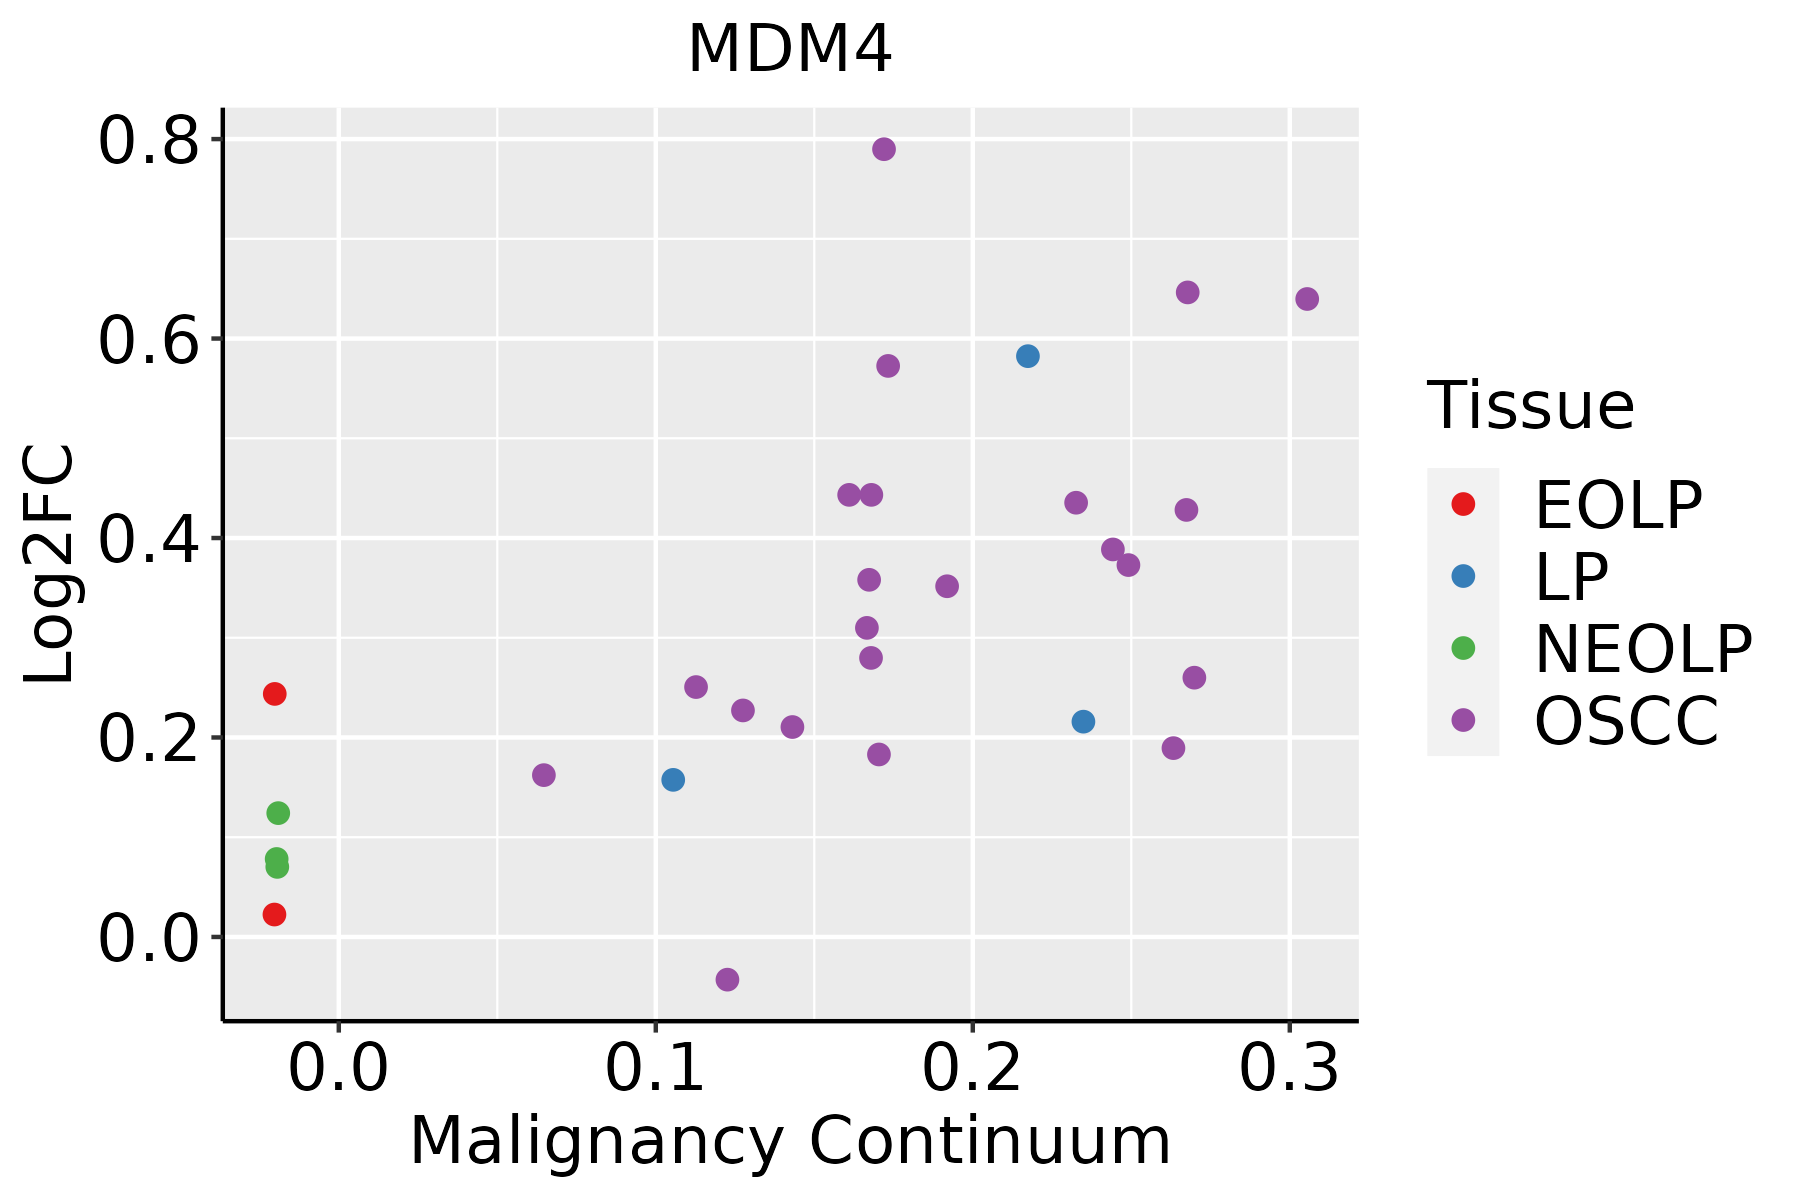 | EOLP: Erosive Oral lichen planus |
| LP: leukoplakia | ||
| NEOLP: Non-erosive oral lichen planus | ||
| OSCC: Oral squamous cell carcinoma | ||
| Prostate |  | BPH: Benign Prostatic Hyperplasia |
| Skin | 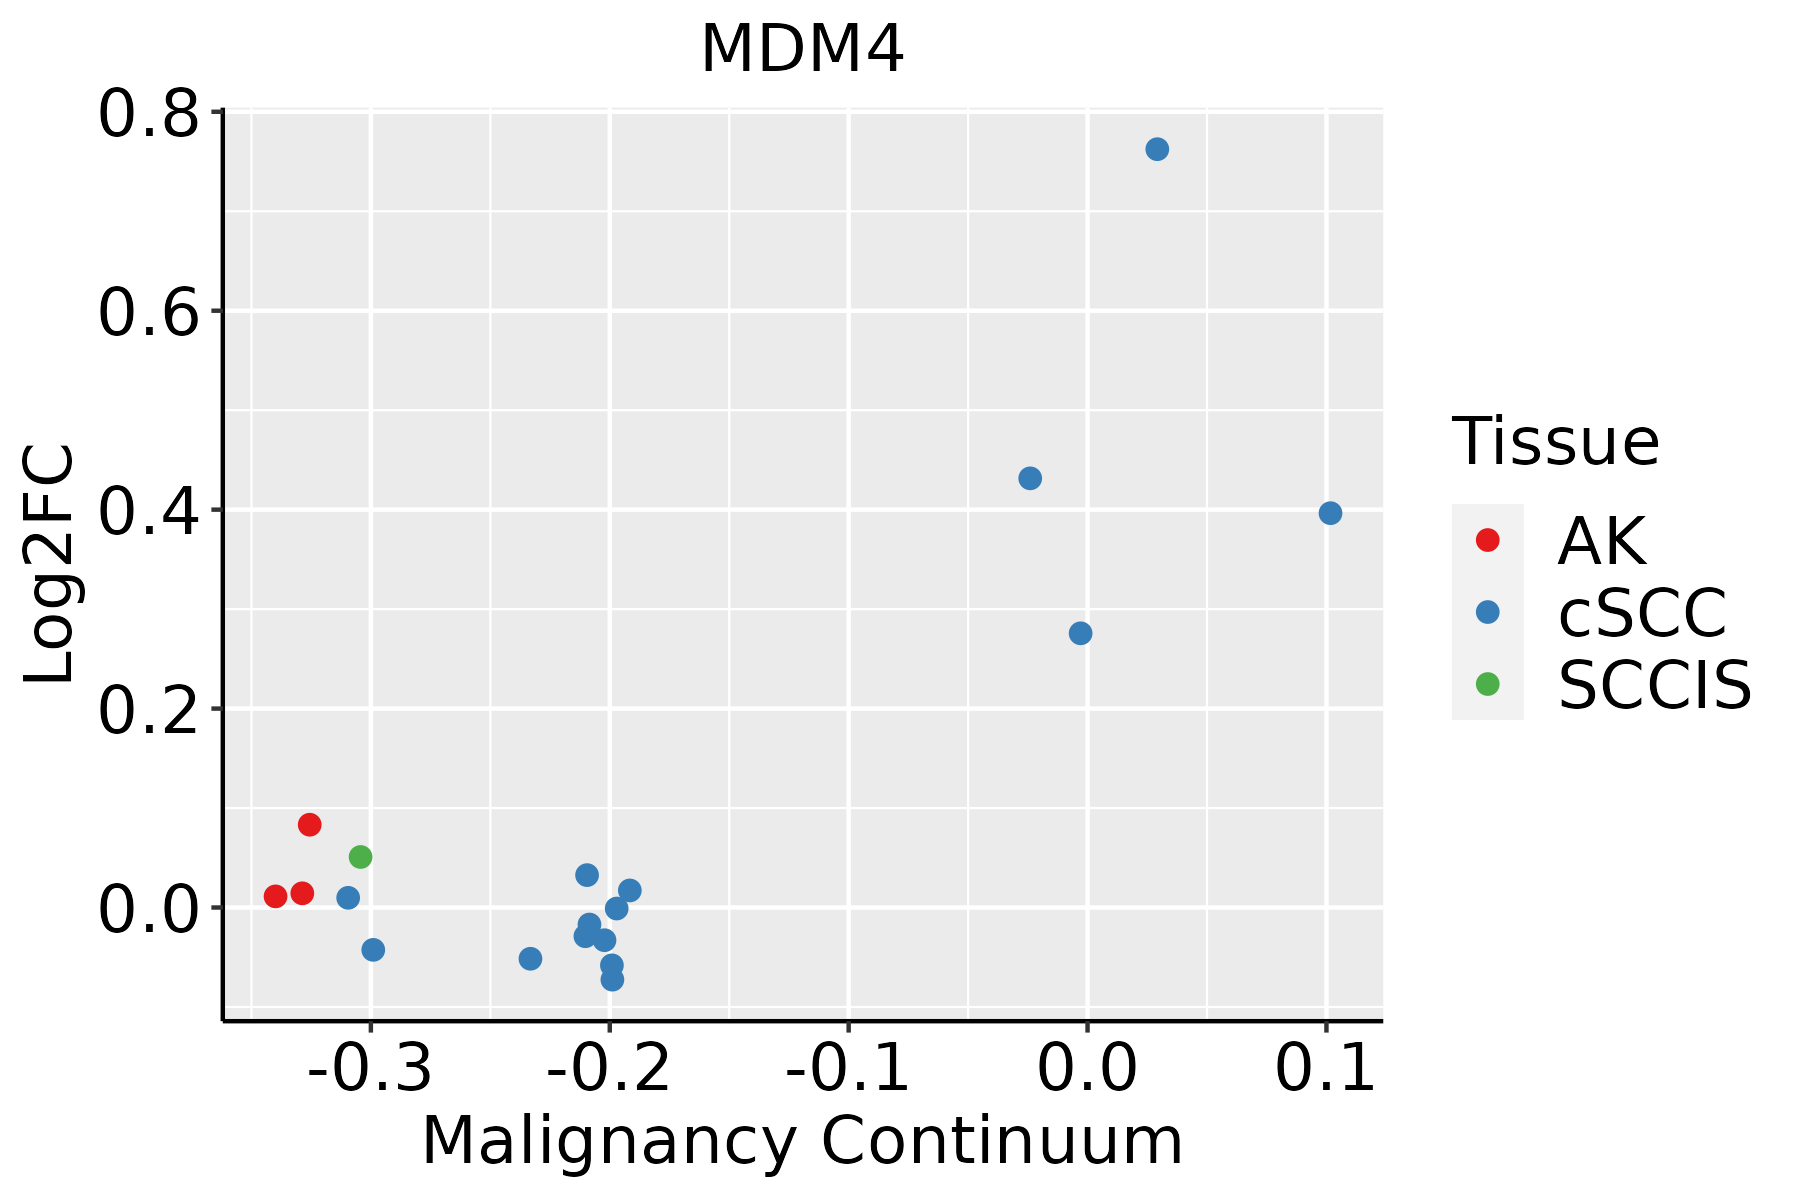 | AK: Actinic keratosis |
| cSCC: Cutaneous squamous cell carcinoma | ||
| SCCIS:squamous cell carcinoma in situ | ||
| Thyroid | 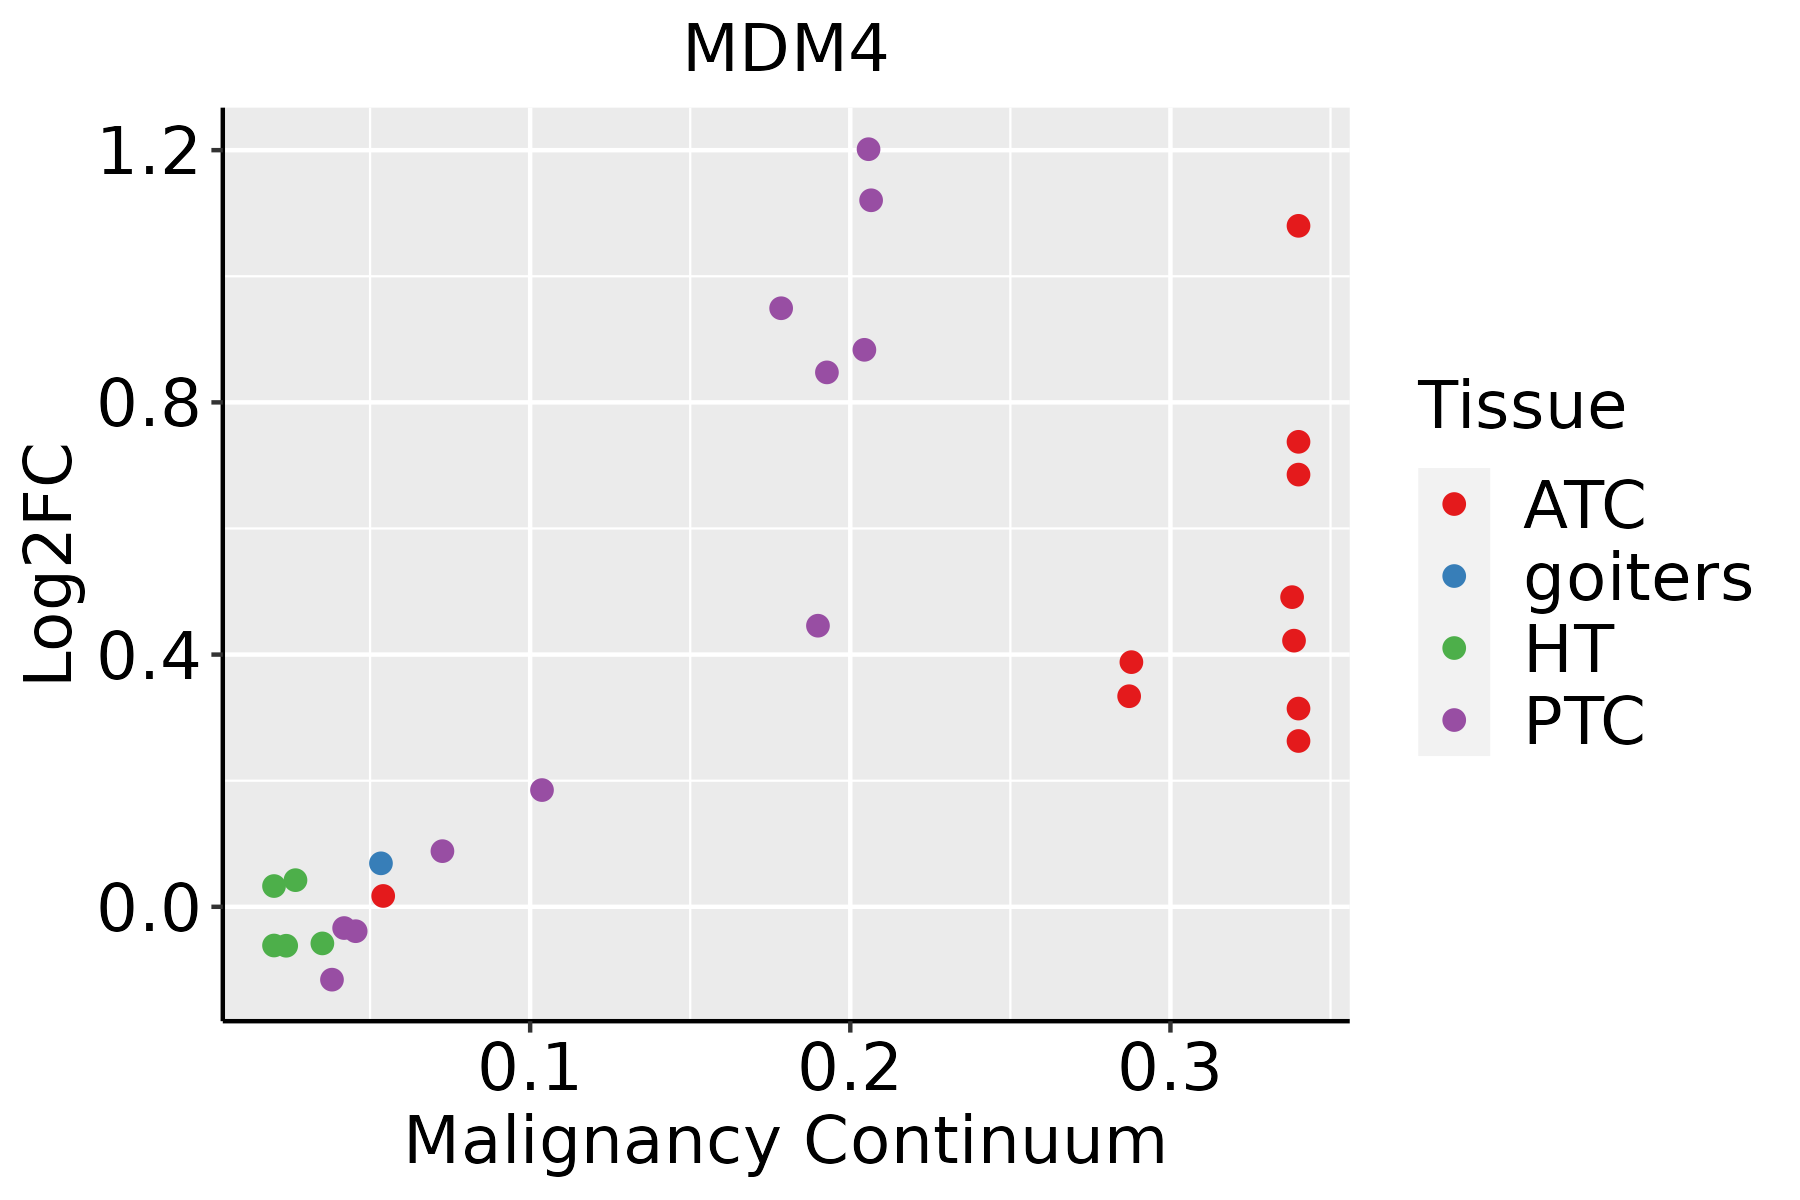 | ATC: Anaplastic thyroid cancer |
| HT: Hashimoto's thyroiditis | ||
| PTC: Papillary thyroid cancer |
| ∗log2FC in expression of this searched gene in stem-like cells from each diseased tissue sample relative to stem-like cells in normal samples in each tissue plotted against the malignancy continuum. Samples are colored based on if they are from different disease stage. |
Top |
Malignant transformation related pathway analysis |
| Find out the enriched GO biological processes and KEGG pathways involved in transition from healthy to precancer to cancer |
| Tissue | Disease Stage | Enriched GO biological Processes |
| Colorectum | AD |  |
| Colorectum | SER |  |
| Colorectum | MSS |  |
| Colorectum | MSI-H |  |
| Colorectum | FAP |  |
| ∗Top 15 enriched GO BP terms are showed in the bar plot of each disease state in each tissue. Each row represents a significant GO biological process which is colored according to the -log10(p.adjust). |
| Page: 1 2 3 4 5 6 7 8 9 |
| GO ID | Tissue | Disease Stage | Description | Gene Ratio | Bg Ratio | pvalue | p.adjust | Count |
| GO:0042176 | Colorectum | AD | regulation of protein catabolic process | 160/3918 | 391/18723 | 1.06e-19 | 7.34e-17 | 160 |
| GO:0009895 | Colorectum | AD | negative regulation of catabolic process | 124/3918 | 320/18723 | 1.66e-13 | 3.35e-11 | 124 |
| GO:0031647 | Colorectum | AD | regulation of protein stability | 108/3918 | 298/18723 | 6.33e-10 | 5.08e-08 | 108 |
| GO:0042177 | Colorectum | AD | negative regulation of protein catabolic process | 55/3918 | 121/18723 | 1.19e-09 | 8.85e-08 | 55 |
| GO:0050821 | Colorectum | AD | protein stabilization | 73/3918 | 191/18723 | 3.02e-08 | 1.64e-06 | 73 |
| GO:0072331 | Colorectum | AD | signal transduction by p53 class mediator | 58/3918 | 163/18723 | 1.04e-05 | 2.40e-04 | 58 |
| GO:0070482 | Colorectum | AD | response to oxygen levels | 99/3918 | 347/18723 | 4.29e-04 | 4.82e-03 | 99 |
| GO:0071453 | Colorectum | AD | cellular response to oxygen levels | 55/3918 | 177/18723 | 9.48e-04 | 8.96e-03 | 55 |
| GO:0001666 | Colorectum | AD | response to hypoxia | 86/3918 | 307/18723 | 1.77e-03 | 1.46e-02 | 86 |
| GO:0036293 | Colorectum | AD | response to decreased oxygen levels | 88/3918 | 322/18723 | 3.42e-03 | 2.49e-02 | 88 |
| GO:0030330 | Colorectum | AD | DNA damage response, signal transduction by p53 class mediator | 25/3918 | 72/18723 | 4.65e-03 | 3.16e-02 | 25 |
| GO:00421762 | Colorectum | MSS | regulation of protein catabolic process | 145/3467 | 391/18723 | 2.03e-18 | 1.17e-15 | 145 |
| GO:00098952 | Colorectum | MSS | negative regulation of catabolic process | 110/3467 | 320/18723 | 7.88e-12 | 1.20e-09 | 110 |
| GO:00316472 | Colorectum | MSS | regulation of protein stability | 103/3467 | 298/18723 | 2.52e-11 | 3.49e-09 | 103 |
| GO:00508212 | Colorectum | MSS | protein stabilization | 68/3467 | 191/18723 | 1.53e-08 | 8.81e-07 | 68 |
| GO:00421772 | Colorectum | MSS | negative regulation of protein catabolic process | 47/3467 | 121/18723 | 1.28e-07 | 6.01e-06 | 47 |
| GO:00723312 | Colorectum | MSS | signal transduction by p53 class mediator | 49/3467 | 163/18723 | 2.30e-04 | 3.19e-03 | 49 |
| GO:00704822 | Colorectum | MSS | response to oxygen levels | 85/3467 | 347/18723 | 3.08e-03 | 2.34e-02 | 85 |
| GO:00714532 | Colorectum | MSS | cellular response to oxygen levels | 47/3467 | 177/18723 | 5.13e-03 | 3.52e-02 | 47 |
| GO:00016662 | Colorectum | MSS | response to hypoxia | 75/3467 | 307/18723 | 5.56e-03 | 3.78e-02 | 75 |
| Page: 1 2 3 4 5 6 7 8 9 10 11 12 13 14 15 |
| Pathway ID | Tissue | Disease Stage | Description | Gene Ratio | Bg Ratio | pvalue | p.adjust | qvalue | Count |
| hsa0411510 | Esophagus | HGIN | p53 signaling pathway | 21/1383 | 74/8465 | 6.25e-03 | 4.25e-02 | 3.37e-02 | 21 |
| hsa0411515 | Esophagus | HGIN | p53 signaling pathway | 21/1383 | 74/8465 | 6.25e-03 | 4.25e-02 | 3.37e-02 | 21 |
| hsa0411524 | Esophagus | ESCC | p53 signaling pathway | 65/4205 | 74/8465 | 3.88e-12 | 6.50e-11 | 3.33e-11 | 65 |
| hsa0411534 | Esophagus | ESCC | p53 signaling pathway | 65/4205 | 74/8465 | 3.88e-12 | 6.50e-11 | 3.33e-11 | 65 |
| hsa041156 | Liver | HCC | p53 signaling pathway | 46/4020 | 74/8465 | 7.64e-03 | 2.08e-02 | 1.16e-02 | 46 |
| hsa0411511 | Liver | HCC | p53 signaling pathway | 46/4020 | 74/8465 | 7.64e-03 | 2.08e-02 | 1.16e-02 | 46 |
| hsa041159 | Oral cavity | OSCC | p53 signaling pathway | 57/3704 | 74/8465 | 4.99e-09 | 5.07e-08 | 2.58e-08 | 57 |
| hsa0411514 | Oral cavity | OSCC | p53 signaling pathway | 57/3704 | 74/8465 | 4.99e-09 | 5.07e-08 | 2.58e-08 | 57 |
| hsa041158 | Prostate | BPH | p53 signaling pathway | 30/1718 | 74/8465 | 5.15e-05 | 3.40e-04 | 2.10e-04 | 30 |
| hsa0411513 | Prostate | BPH | p53 signaling pathway | 30/1718 | 74/8465 | 5.15e-05 | 3.40e-04 | 2.10e-04 | 30 |
| hsa0411522 | Prostate | Tumor | p53 signaling pathway | 29/1791 | 74/8465 | 2.99e-04 | 1.65e-03 | 1.02e-03 | 29 |
| hsa0411532 | Prostate | Tumor | p53 signaling pathway | 29/1791 | 74/8465 | 2.99e-04 | 1.65e-03 | 1.02e-03 | 29 |
| Page: 1 |
Top |
Cell-cell communication analysis |
| Identification of potential cell-cell interactions between two cell types and their ligand-receptor pairs for different disease states |
| Ligand | Receptor | LRpair | Pathway | Tissue | Disease Stage |
| Page: 1 |
Top |
Single-cell gene regulatory network inference analysis |
| Find out the significant the regulons (TFs) and the target genes of each regulon across cell types for different disease states |
| TF | Cell Type | Tissue | Disease Stage | Target Gene | RSS | Regulon Activity |
| ∗The dot plots of a searched regulon are shown for all cell subpopulations in each disease state of each tissue based on the regulon specific score inferred using pySCENIC and by calculating the average expression. |
| Page: 1 |
Top |
Somatic mutation of malignant transformation related genes |
| Annotation of somatic variants for genes involved in malignant transformation |
| Hugo Symbol | Variant Class | Variant Classification | dbSNP RS | HGVSc | HGVSp | HGVSp Short | SWISSPROT | BIOTYPE | SIFT | PolyPhen | Tumor Sample Barcode | Tissue | Histology | Sex | Age | Stage | Therapy Types | Drugs | Outcome |
| MDM4 | SNV | Missense_Mutation | c.421N>A | p.Glu141Lys | p.E141K | O15151 | protein_coding | tolerated(0.41) | benign(0.003) | TCGA-E9-A1N4-01 | Breast | breast invasive carcinoma | Female | <65 | III/IV | Chemotherapy | doxorubicin | SD | |
| MDM4 | SNV | Missense_Mutation | c.394A>T | p.Ser132Cys | p.S132C | O15151 | protein_coding | deleterious(0.03) | possibly_damaging(0.695) | TCGA-GI-A2C8-01 | Breast | breast invasive carcinoma | Female | <65 | III/IV | Unspecific | Adriamycin | SD | |
| MDM4 | deletion | Frame_Shift_Del | c.143_144delCT | p.Thr48SerfsTer2 | p.T48Sfs*2 | O15151 | protein_coding | TCGA-D8-A1JK-01 | Breast | breast invasive carcinoma | Female | >=65 | I/II | Unknown | Unknown | SD | |||
| MDM4 | SNV | Missense_Mutation | c.607N>A | p.Leu203Ile | p.L203I | O15151 | protein_coding | tolerated(0.16) | benign(0.181) | TCGA-A6-6782-01 | Colorectum | colon adenocarcinoma | Male | >=65 | I/II | Unknown | Unknown | SD | |
| MDM4 | SNV | Missense_Mutation | c.851N>C | p.Leu284Pro | p.L284P | O15151 | protein_coding | tolerated(0.26) | benign(0.02) | TCGA-AA-3833-01 | Colorectum | colon adenocarcinoma | Female | <65 | I/II | Unknown | Unknown | SD | |
| MDM4 | SNV | Missense_Mutation | c.1111N>A | p.Val371Ile | p.V371I | O15151 | protein_coding | tolerated(0.79) | possibly_damaging(0.868) | TCGA-AA-A010-01 | Colorectum | colon adenocarcinoma | Female | <65 | I/II | Chemotherapy | folinic | CR | |
| MDM4 | SNV | Missense_Mutation | c.671A>T | p.Gln224Leu | p.Q224L | O15151 | protein_coding | deleterious(0) | probably_damaging(0.972) | TCGA-CK-4951-01 | Colorectum | colon adenocarcinoma | Female | >=65 | I/II | Unknown | Unknown | PD | |
| MDM4 | SNV | Missense_Mutation | c.467C>A | p.Pro156His | p.P156H | O15151 | protein_coding | tolerated(0.1) | benign(0.003) | TCGA-WS-AB45-01 | Colorectum | colon adenocarcinoma | Female | <65 | I/II | Unknown | Unknown | SD | |
| MDM4 | SNV | Missense_Mutation | novel | c.923A>C | p.Glu308Ala | p.E308A | O15151 | protein_coding | deleterious(0.01) | possibly_damaging(0.519) | TCGA-F5-6814-01 | Colorectum | rectum adenocarcinoma | Male | <65 | I/II | Unknown | Unknown | SD |
| MDM4 | deletion | Frame_Shift_Del | c.842delA | p.Asn281MetfsTer10 | p.N281Mfs*10 | O15151 | protein_coding | TCGA-A6-6781-01 | Colorectum | colon adenocarcinoma | Male | <65 | III/IV | Chemotherapy | oxaliplatin | SD |
| Page: 1 2 3 4 5 |
Top |
Related drugs of malignant transformation related genes |
| Identification of chemicals and drugs interact with genes involved in malignant transfromation |
| (DGIdb 4.0) |
| Entrez ID | Symbol | Category | Interaction Types | Drug Claim Name | Drug Name | PMIDs |
| 4194 | MDM4 | CLINICALLY ACTIONABLE, TUMOR SUPPRESSOR, DRUGGABLE GENOME | NIVOLUMAB | NIVOLUMAB | 28351930 | |
| 4194 | MDM4 | CLINICALLY ACTIONABLE, TUMOR SUPPRESSOR, DRUGGABLE GENOME | ALRN-6924 | |||
| 4194 | MDM4 | CLINICALLY ACTIONABLE, TUMOR SUPPRESSOR, DRUGGABLE GENOME | docetaxel | DOCETAXEL | 24958282 | |
| 4194 | MDM4 | CLINICALLY ACTIONABLE, TUMOR SUPPRESSOR, DRUGGABLE GENOME | epirubicin | EPIRUBICIN | 24958282 | |
| 4194 | MDM4 | CLINICALLY ACTIONABLE, TUMOR SUPPRESSOR, DRUGGABLE GENOME | PEMBROLIZUMAB | PEMBROLIZUMAB | 28351930 | |
| 4194 | MDM4 | CLINICALLY ACTIONABLE, TUMOR SUPPRESSOR, DRUGGABLE GENOME | ATEZOLIZUMAB | ATEZOLIZUMAB | 28351930 |
| Page: 1 |

Copyright 2023-Present -The University of Texas Health Science Center at Houston |