
|
|||||
|
 | |
| |
| |
| |
| |
| |
|
Gene: MDM2 |
Gene summary for MDM2 |
| Gene information | Species | Human | Gene symbol | MDM2 | Gene ID | 4193 |
| Gene name | MDM2 proto-oncogene | |
| Gene Alias | ACTFS | |
| Cytomap | 12q15 | |
| Gene Type | protein-coding | GO ID | GO:0000075 | UniProtAcc | A0A0A8KB75 |
Top |
Malignant transformation analysis |
| Identification of the aberrant gene expression in precancerous and cancerous lesions by comparing the gene expression of stem-like cells in diseased tissues with normal stem cells |
| Entrez ID | Symbol | Replicates | Species | Organ | Tissue | Adj P-value | Log2FC | Malignancy |
| 4193 | MDM2 | GSM4909291 | Human | Breast | IDC | 4.00e-35 | 1.02e+00 | 0.1753 |
| 4193 | MDM2 | GSM4909298 | Human | Breast | IDC | 1.99e-02 | 1.18e-01 | 0.1551 |
| 4193 | MDM2 | GSM4909319 | Human | Breast | IDC | 2.18e-03 | -9.07e-02 | 0.1563 |
| 4193 | MDM2 | GSM4909321 | Human | Breast | IDC | 7.69e-05 | 2.95e-01 | 0.1559 |
| 4193 | MDM2 | NCCBC2 | Human | Breast | DCIS | 1.34e-04 | 5.66e-01 | 0.1554 |
| 4193 | MDM2 | P3 | Human | Breast | IDC | 6.07e-08 | 8.21e-01 | 0.1542 |
| 4193 | MDM2 | DCIS2 | Human | Breast | DCIS | 3.34e-39 | 1.77e-01 | 0.0085 |
| 4193 | MDM2 | LZE4T | Human | Esophagus | ESCC | 1.15e-22 | 5.77e-01 | 0.0811 |
| 4193 | MDM2 | LZE7T | Human | Esophagus | ESCC | 3.46e-11 | 7.97e-01 | 0.0667 |
| 4193 | MDM2 | LZE8T | Human | Esophagus | ESCC | 3.13e-09 | 2.57e-01 | 0.067 |
| 4193 | MDM2 | LZE20T | Human | Esophagus | ESCC | 2.15e-04 | 1.80e-01 | 0.0662 |
| 4193 | MDM2 | LZE22D1 | Human | Esophagus | HGIN | 3.08e-03 | 2.49e-01 | 0.0595 |
| 4193 | MDM2 | LZE24T | Human | Esophagus | ESCC | 2.94e-15 | 5.07e-01 | 0.0596 |
| 4193 | MDM2 | LZE21T | Human | Esophagus | ESCC | 7.88e-03 | 4.10e-01 | 0.0655 |
| 4193 | MDM2 | LZE6T | Human | Esophagus | ESCC | 1.11e-02 | 2.06e-01 | 0.0845 |
| 4193 | MDM2 | P1T-E | Human | Esophagus | ESCC | 7.82e-08 | 5.82e-01 | 0.0875 |
| 4193 | MDM2 | P2T-E | Human | Esophagus | ESCC | 5.41e-56 | 1.09e+00 | 0.1177 |
| 4193 | MDM2 | P4T-E | Human | Esophagus | ESCC | 2.97e-18 | 4.90e-01 | 0.1323 |
| 4193 | MDM2 | P5T-E | Human | Esophagus | ESCC | 1.44e-16 | 3.41e-01 | 0.1327 |
| 4193 | MDM2 | P8T-E | Human | Esophagus | ESCC | 1.74e-21 | 4.87e-01 | 0.0889 |
| Page: 1 2 3 4 5 6 7 |
| Tissue | Expression Dynamics | Abbreviation |
| Breast |  | IDC: Invasive ductal carcinoma |
| DCIS: Ductal carcinoma in situ | ||
| Precancer(BRCA1-mut): Precancerous lesion from BRCA1 mutation carriers | ||
| Esophagus | 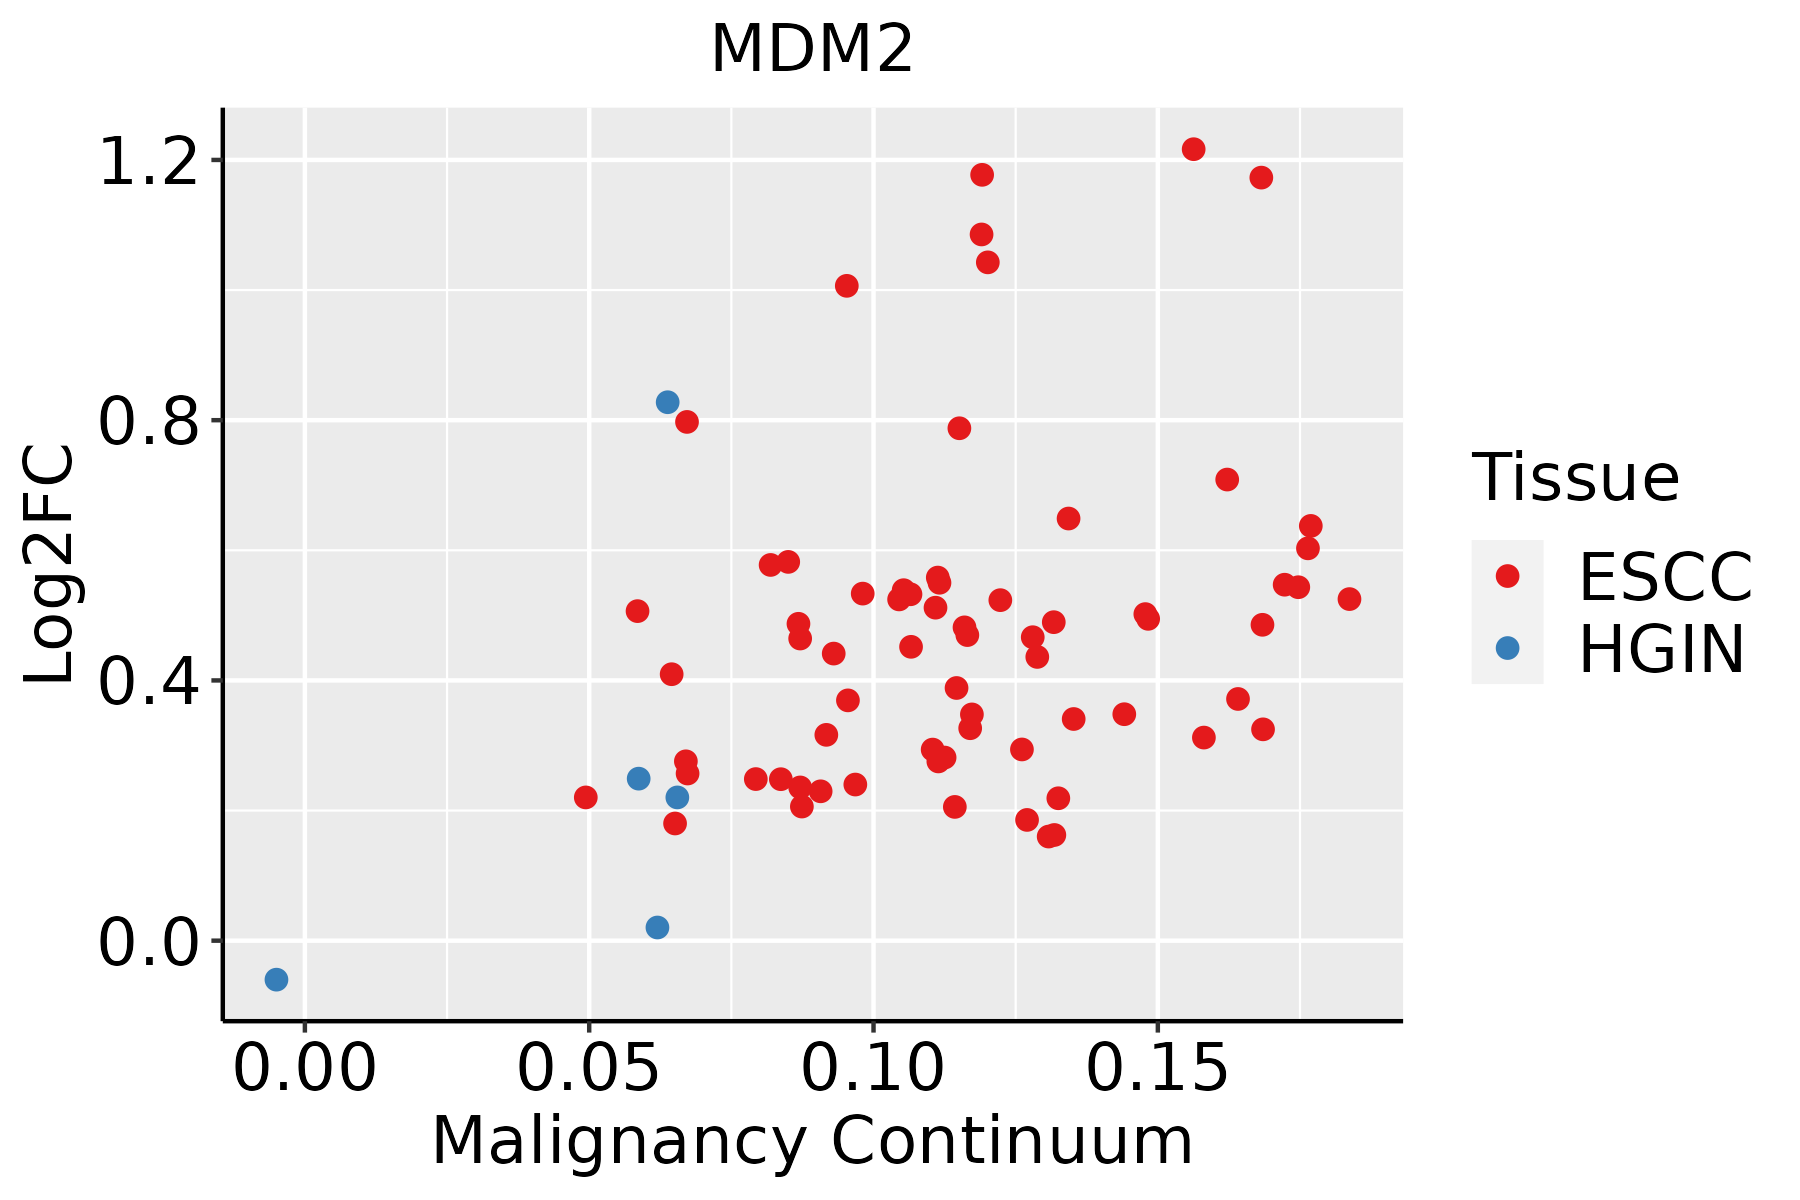 | ESCC: Esophageal squamous cell carcinoma |
| HGIN: High-grade intraepithelial neoplasias | ||
| LGIN: Low-grade intraepithelial neoplasias | ||
| Liver | 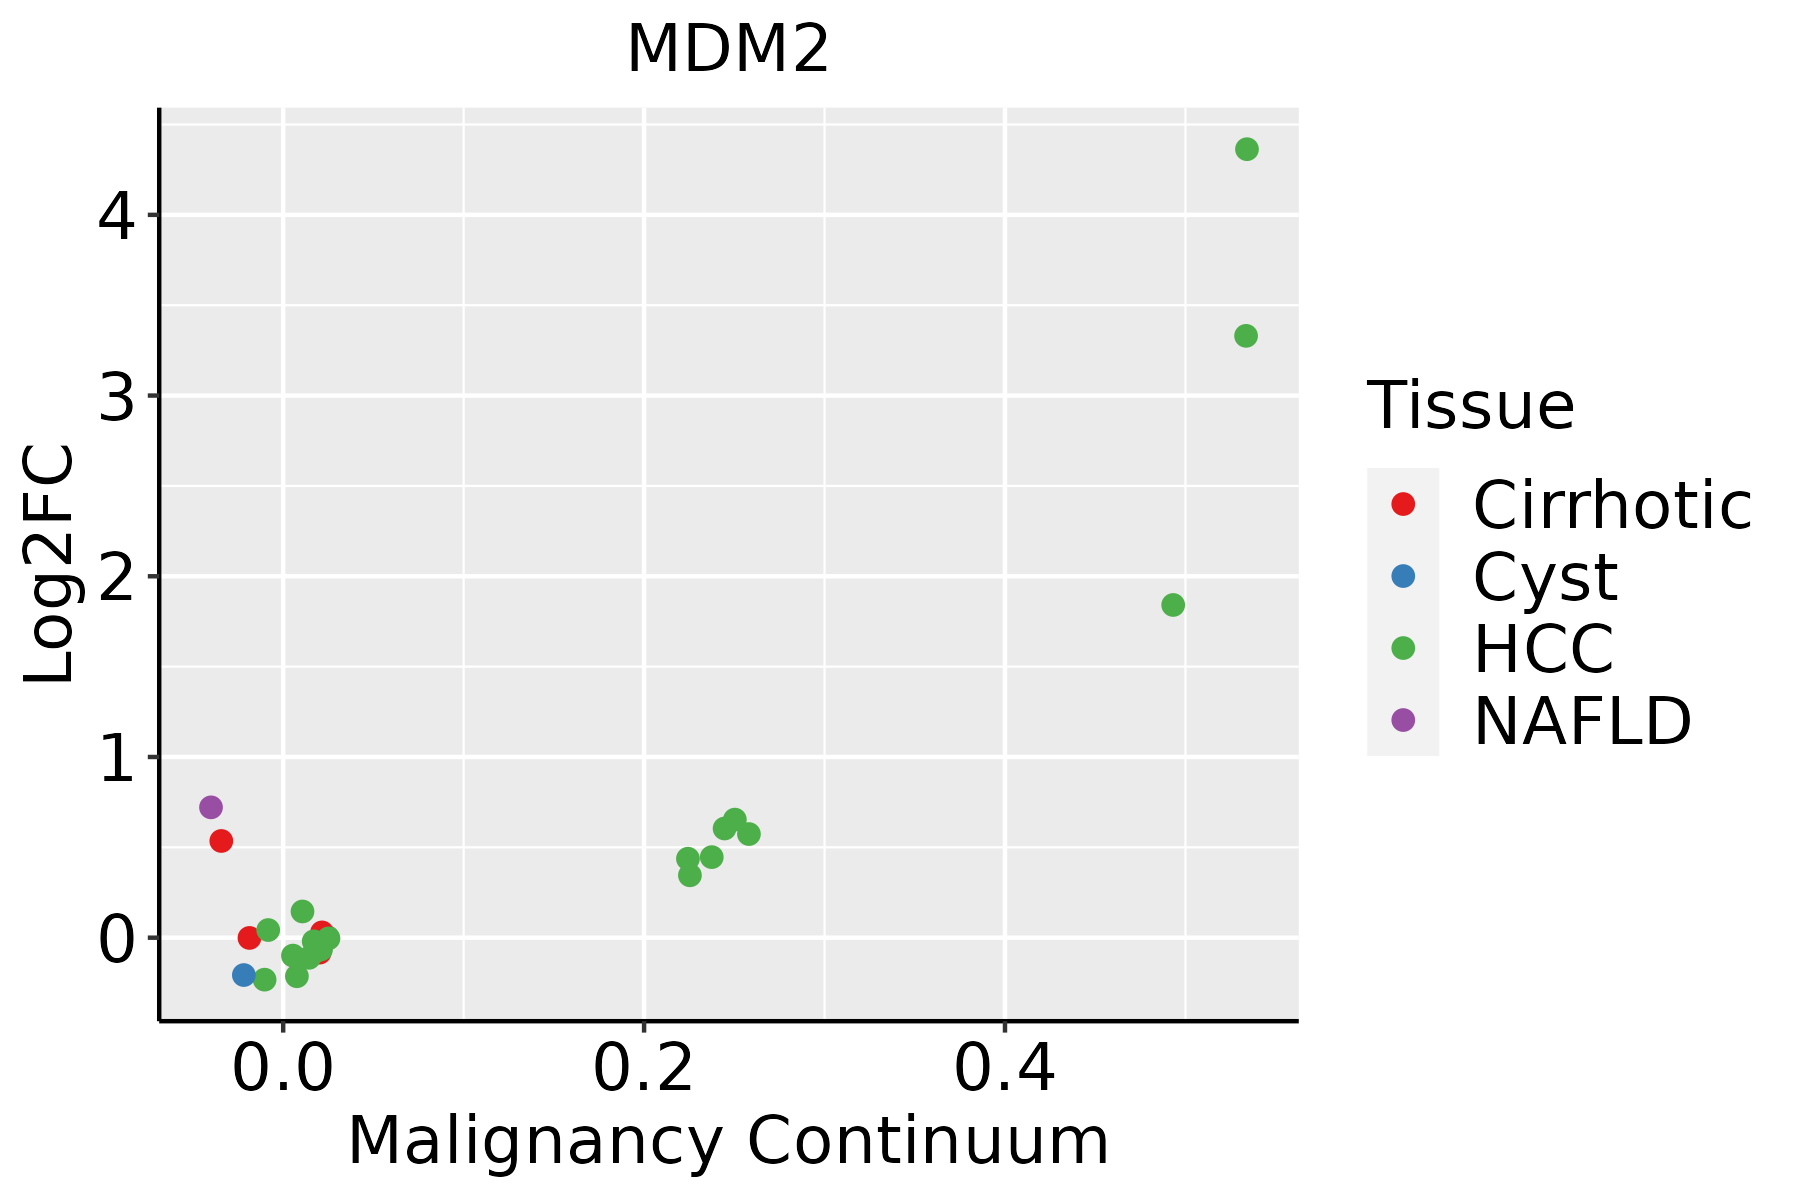 | HCC: Hepatocellular carcinoma |
| NAFLD: Non-alcoholic fatty liver disease | ||
| Lung | 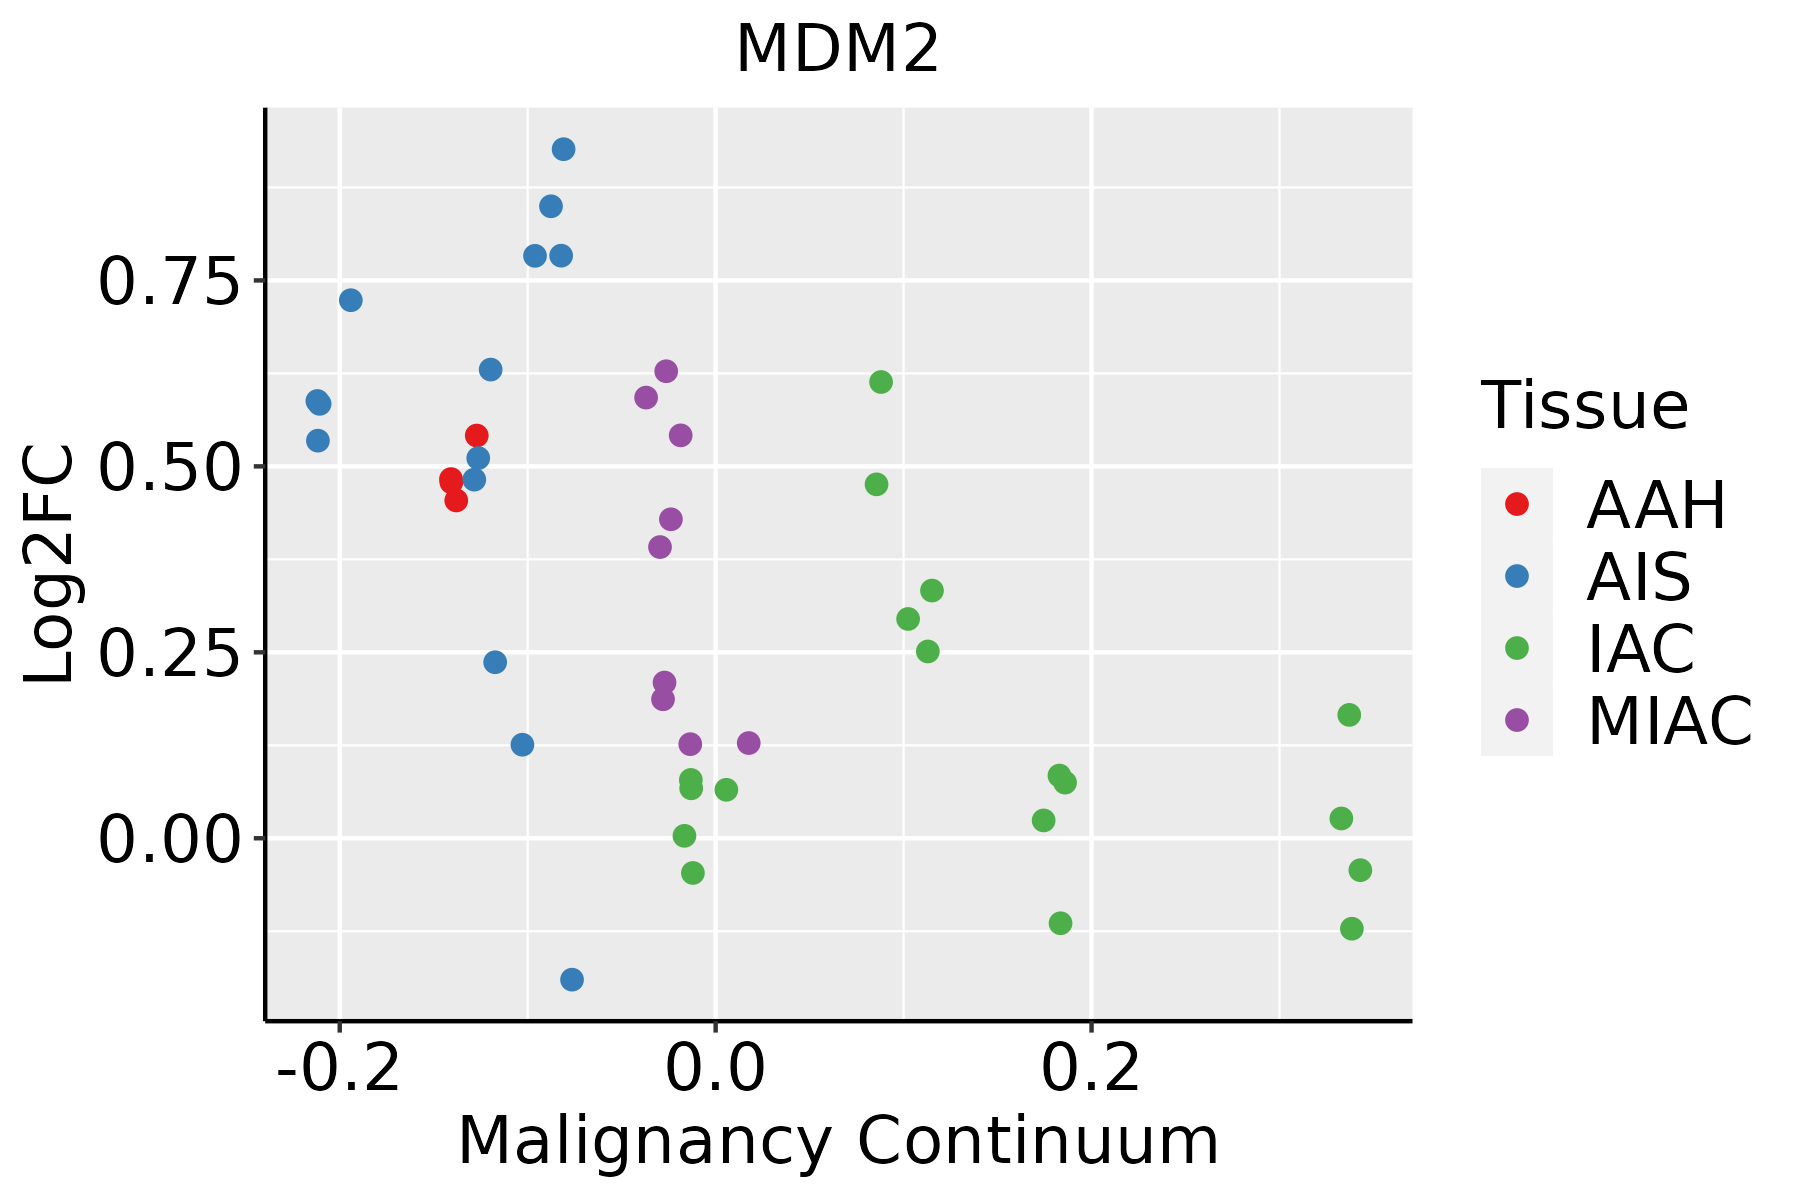 | AAH: Atypical adenomatous hyperplasia |
| AIS: Adenocarcinoma in situ | ||
| IAC: Invasive lung adenocarcinoma | ||
| MIA: Minimally invasive adenocarcinoma | ||
| Oral Cavity |  | EOLP: Erosive Oral lichen planus |
| LP: leukoplakia | ||
| NEOLP: Non-erosive oral lichen planus | ||
| OSCC: Oral squamous cell carcinoma | ||
| Prostate | 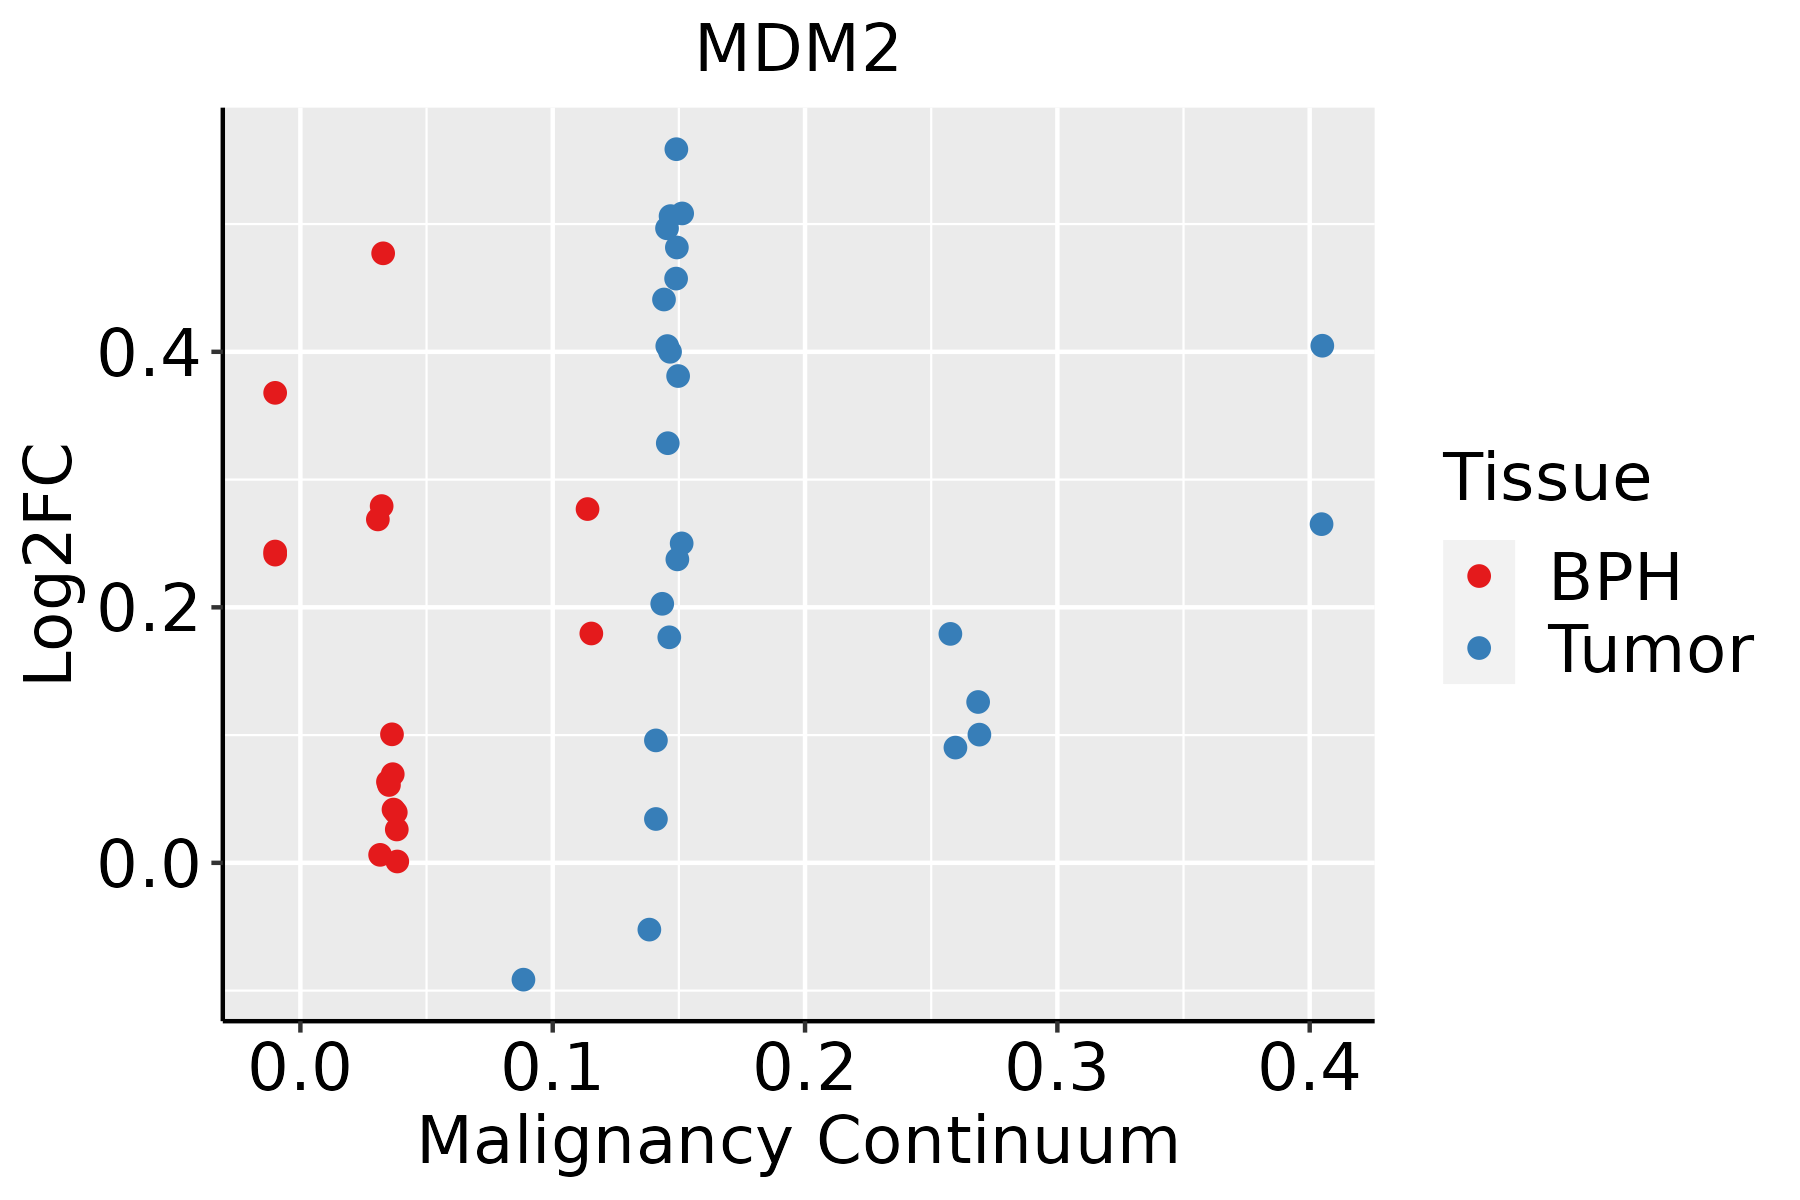 | BPH: Benign Prostatic Hyperplasia |
| Thyroid | 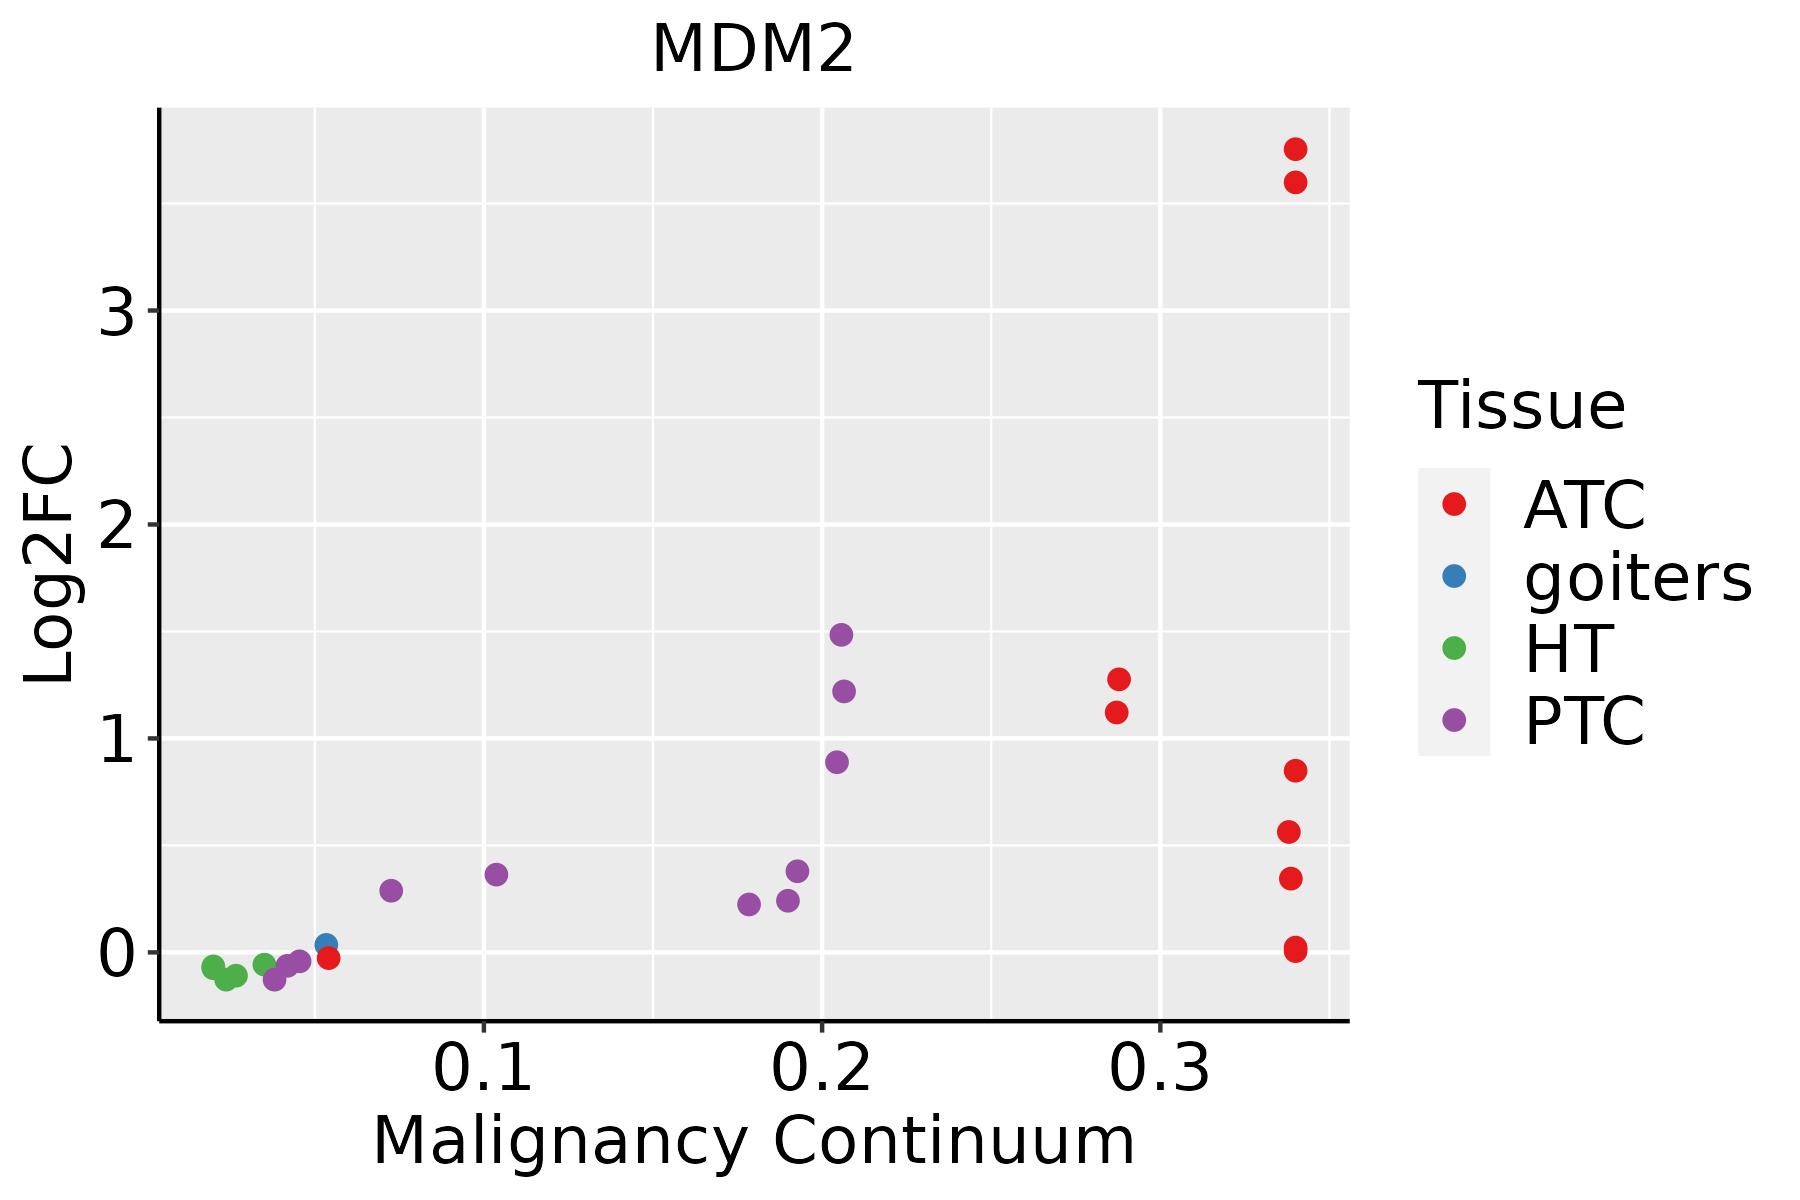 | ATC: Anaplastic thyroid cancer |
| HT: Hashimoto's thyroiditis | ||
| PTC: Papillary thyroid cancer |
| ∗log2FC in expression of this searched gene in stem-like cells from each diseased tissue sample relative to stem-like cells in normal samples in each tissue plotted against the malignancy continuum. Samples are colored based on if they are from different disease stage. |
Top |
Malignant transformation related pathway analysis |
| Find out the enriched GO biological processes and KEGG pathways involved in transition from healthy to precancer to cancer |
| Tissue | Disease Stage | Enriched GO biological Processes |
| Colorectum | AD |  |
| Colorectum | SER |  |
| Colorectum | MSS |  |
| Colorectum | MSI-H |  |
| Colorectum | FAP |  |
| ∗Top 15 enriched GO BP terms are showed in the bar plot of each disease state in each tissue. Each row represents a significant GO biological process which is colored according to the -log10(p.adjust). |
| Page: 1 2 3 4 5 6 7 8 9 |
| GO ID | Tissue | Disease Stage | Description | Gene Ratio | Bg Ratio | pvalue | p.adjust | Count |
| GO:200123314 | Breast | IDC | regulation of apoptotic signaling pathway | 82/1434 | 356/18723 | 6.27e-20 | 5.93e-17 | 82 |
| GO:005254714 | Breast | IDC | regulation of peptidase activity | 96/1434 | 461/18723 | 7.58e-20 | 6.15e-17 | 96 |
| GO:009719314 | Breast | IDC | intrinsic apoptotic signaling pathway | 69/1434 | 288/18723 | 6.32e-18 | 2.99e-15 | 69 |
| GO:005254814 | Breast | IDC | regulation of endopeptidase activity | 88/1434 | 432/18723 | 1.20e-17 | 4.85e-15 | 88 |
| GO:200124214 | Breast | IDC | regulation of intrinsic apoptotic signaling pathway | 47/1434 | 164/18723 | 8.25e-16 | 2.93e-13 | 47 |
| GO:004854514 | Breast | IDC | response to steroid hormone | 70/1434 | 339/18723 | 1.34e-14 | 4.23e-12 | 70 |
| GO:000697914 | Breast | IDC | response to oxidative stress | 83/1434 | 446/18723 | 2.36e-14 | 7.06e-12 | 83 |
| GO:200011614 | Breast | IDC | regulation of cysteine-type endopeptidase activity | 55/1434 | 235/18723 | 4.25e-14 | 1.21e-11 | 55 |
| GO:004586114 | Breast | IDC | negative regulation of proteolysis | 70/1434 | 351/18723 | 8.21e-14 | 2.22e-11 | 70 |
| GO:004328114 | Breast | IDC | regulation of cysteine-type endopeptidase activity involved in apoptotic process | 50/1434 | 209/18723 | 2.49e-13 | 6.14e-11 | 50 |
| GO:005134613 | Breast | IDC | negative regulation of hydrolase activity | 71/1434 | 379/18723 | 1.33e-12 | 2.90e-10 | 71 |
| GO:001046613 | Breast | IDC | negative regulation of peptidase activity | 56/1434 | 262/18723 | 1.39e-12 | 2.92e-10 | 56 |
| GO:200123414 | Breast | IDC | negative regulation of apoptotic signaling pathway | 49/1434 | 224/18723 | 1.45e-11 | 2.58e-09 | 49 |
| GO:007048214 | Breast | IDC | response to oxygen levels | 64/1434 | 347/18723 | 3.45e-11 | 5.57e-09 | 64 |
| GO:001095112 | Breast | IDC | negative regulation of endopeptidase activity | 52/1434 | 252/18723 | 3.53e-11 | 5.57e-09 | 52 |
| GO:003629314 | Breast | IDC | response to decreased oxygen levels | 60/1434 | 322/18723 | 9.26e-11 | 1.25e-08 | 60 |
| GO:004586214 | Breast | IDC | positive regulation of proteolysis | 66/1434 | 372/18723 | 9.76e-11 | 1.29e-08 | 66 |
| GO:000166614 | Breast | IDC | response to hypoxia | 58/1434 | 307/18723 | 1.09e-10 | 1.38e-08 | 58 |
| GO:001003814 | Breast | IDC | response to metal ion | 65/1434 | 373/18723 | 2.95e-10 | 3.42e-08 | 65 |
| GO:000030214 | Breast | IDC | response to reactive oxygen species | 46/1434 | 222/18723 | 4.12e-10 | 4.59e-08 | 46 |
| Page: 1 2 3 4 5 6 7 8 9 10 11 12 13 14 15 16 17 18 19 20 21 22 23 24 25 26 27 28 29 30 31 32 33 34 35 36 37 38 39 40 41 42 43 44 45 46 47 48 49 50 51 52 53 54 55 56 57 58 59 60 61 62 63 64 65 66 67 68 69 70 71 72 73 74 75 76 77 78 79 80 81 82 83 84 85 86 87 88 89 90 91 92 93 94 95 96 |
| Pathway ID | Tissue | Disease Stage | Description | Gene Ratio | Bg Ratio | pvalue | p.adjust | qvalue | Count |
| hsa0516922 | Breast | IDC | Epstein-Barr virus infection | 45/867 | 202/8465 | 3.16e-07 | 6.05e-06 | 4.52e-06 | 45 |
| hsa0421824 | Breast | IDC | Cellular senescence | 35/867 | 156/8465 | 5.49e-06 | 7.43e-05 | 5.56e-05 | 35 |
| hsa0520523 | Breast | IDC | Proteoglycans in cancer | 42/867 | 205/8465 | 7.69e-06 | 9.99e-05 | 7.48e-05 | 42 |
| hsa0513124 | Breast | IDC | Shigellosis | 47/867 | 247/8465 | 1.78e-05 | 2.00e-04 | 1.49e-04 | 47 |
| hsa0516324 | Breast | IDC | Human cytomegalovirus infection | 39/867 | 225/8465 | 6.66e-04 | 5.41e-03 | 4.05e-03 | 39 |
| hsa0491916 | Breast | IDC | Thyroid hormone signaling pathway | 23/867 | 121/8465 | 2.45e-03 | 1.69e-02 | 1.27e-02 | 23 |
| hsa0520322 | Breast | IDC | Viral carcinogenesis | 34/867 | 204/8465 | 2.82e-03 | 1.86e-02 | 1.39e-02 | 34 |
| hsa052147 | Breast | IDC | Glioma | 16/867 | 75/8465 | 3.30e-03 | 2.10e-02 | 1.57e-02 | 16 |
| hsa0521921 | Breast | IDC | Bladder cancer | 10/867 | 41/8465 | 7.07e-03 | 3.54e-02 | 2.65e-02 | 10 |
| hsa0522010 | Breast | IDC | Chronic myeloid leukemia | 15/867 | 76/8465 | 9.24e-03 | 4.37e-02 | 3.27e-02 | 15 |
| hsa0516932 | Breast | IDC | Epstein-Barr virus infection | 45/867 | 202/8465 | 3.16e-07 | 6.05e-06 | 4.52e-06 | 45 |
| hsa0421834 | Breast | IDC | Cellular senescence | 35/867 | 156/8465 | 5.49e-06 | 7.43e-05 | 5.56e-05 | 35 |
| hsa0520533 | Breast | IDC | Proteoglycans in cancer | 42/867 | 205/8465 | 7.69e-06 | 9.99e-05 | 7.48e-05 | 42 |
| hsa0513134 | Breast | IDC | Shigellosis | 47/867 | 247/8465 | 1.78e-05 | 2.00e-04 | 1.49e-04 | 47 |
| hsa0516334 | Breast | IDC | Human cytomegalovirus infection | 39/867 | 225/8465 | 6.66e-04 | 5.41e-03 | 4.05e-03 | 39 |
| hsa0491917 | Breast | IDC | Thyroid hormone signaling pathway | 23/867 | 121/8465 | 2.45e-03 | 1.69e-02 | 1.27e-02 | 23 |
| hsa0520332 | Breast | IDC | Viral carcinogenesis | 34/867 | 204/8465 | 2.82e-03 | 1.86e-02 | 1.39e-02 | 34 |
| hsa0521413 | Breast | IDC | Glioma | 16/867 | 75/8465 | 3.30e-03 | 2.10e-02 | 1.57e-02 | 16 |
| hsa0521931 | Breast | IDC | Bladder cancer | 10/867 | 41/8465 | 7.07e-03 | 3.54e-02 | 2.65e-02 | 10 |
| hsa0522013 | Breast | IDC | Chronic myeloid leukemia | 15/867 | 76/8465 | 9.24e-03 | 4.37e-02 | 3.27e-02 | 15 |
| Page: 1 2 3 4 5 6 7 8 9 10 11 12 13 14 15 16 17 18 19 20 |
Top |
Cell-cell communication analysis |
| Identification of potential cell-cell interactions between two cell types and their ligand-receptor pairs for different disease states |
| Ligand | Receptor | LRpair | Pathway | Tissue | Disease Stage |
| Page: 1 |
Top |
Single-cell gene regulatory network inference analysis |
| Find out the significant the regulons (TFs) and the target genes of each regulon across cell types for different disease states |
| TF | Cell Type | Tissue | Disease Stage | Target Gene | RSS | Regulon Activity |
| MDM2 | PERI | Skin | ADJ | DIP2A,ZMAT3,LYPD1, etc. | 4.86e-01 |  |
| MDM2 | PERI | Skin | AK | DIP2A,ZMAT3,LYPD1, etc. | 1.31e-01 |  |
| MDM2 | PERI | Skin | cSCC | DIP2A,ZMAT3,LYPD1, etc. | 3.80e-01 |  |
| MDM2 | PERI | Skin | SCCIS | DIP2A,ZMAT3,LYPD1, etc. | 4.07e-01 |  |
| ∗The dot plots of a searched regulon are shown for all cell subpopulations in each disease state of each tissue based on the regulon specific score inferred using pySCENIC and by calculating the average expression. |
| Page: 1 |
Top |
Somatic mutation of malignant transformation related genes |
| Annotation of somatic variants for genes involved in malignant transformation |
| Hugo Symbol | Variant Class | Variant Classification | dbSNP RS | HGVSc | HGVSp | HGVSp Short | SWISSPROT | BIOTYPE | SIFT | PolyPhen | Tumor Sample Barcode | Tissue | Histology | Sex | Age | Stage | Therapy Types | Drugs | Outcome |
| MDM2 | SNV | Missense_Mutation | novel | c.892G>A | p.Glu298Lys | p.E298K | Q00987 | protein_coding | deleterious(0.01) | benign(0.295) | TCGA-5L-AAT1-01 | Breast | breast invasive carcinoma | Female | <65 | III/IV | Hormone Therapy | letrozol | SD |
| MDM2 | SNV | Missense_Mutation | rs773519801 | c.994C>T | p.Arg332Cys | p.R332C | Q00987 | protein_coding | deleterious(0) | probably_damaging(0.999) | TCGA-A2-A0CL-01 | Breast | breast invasive carcinoma | Female | <65 | III/IV | Chemotherapy | cytoxan | SD |
| MDM2 | SNV | Missense_Mutation | c.4N>C | p.Val2Leu | p.V2L | Q00987 | protein_coding | tolerated_low_confidence(0.33) | benign(0.176) | TCGA-E2-A158-01 | Breast | breast invasive carcinoma | Female | <65 | I/II | Chemotherapy | arimidex | SD | |
| MDM2 | SNV | Missense_Mutation | c.271T>G | p.Leu91Val | p.L91V | Q00987 | protein_coding | tolerated(0.65) | benign(0.013) | TCGA-FU-A3HZ-01 | Cervix | cervical & endocervical cancer | Female | <65 | I/II | Chemotherapy | cisplatin | CR | |
| MDM2 | SNV | Missense_Mutation | c.1038N>C | p.Glu346Asp | p.E346D | Q00987 | protein_coding | tolerated(0.51) | benign(0) | TCGA-AA-A00N-01 | Colorectum | colon adenocarcinoma | Male | >=65 | I/II | Unknown | Unknown | PD | |
| MDM2 | SNV | Missense_Mutation | c.1483N>C | p.Tyr495His | p.Y495H | Q00987 | protein_coding | deleterious(0) | probably_damaging(0.999) | TCGA-AA-A00N-01 | Colorectum | colon adenocarcinoma | Male | >=65 | I/II | Unknown | Unknown | PD | |
| MDM2 | SNV | Missense_Mutation | c.630N>T | p.Glu210Asp | p.E210D | Q00987 | protein_coding | tolerated(0.3) | possibly_damaging(0.718) | TCGA-AA-A010-01 | Colorectum | colon adenocarcinoma | Female | <65 | I/II | Chemotherapy | folinic | CR | |
| MDM2 | SNV | Missense_Mutation | c.1370N>C | p.Val457Ala | p.V457A | Q00987 | protein_coding | deleterious(0) | possibly_damaging(0.616) | TCGA-AA-A010-01 | Colorectum | colon adenocarcinoma | Female | <65 | I/II | Chemotherapy | folinic | CR | |
| MDM2 | SNV | Missense_Mutation | rs549965230 | c.781N>A | p.Asp261Asn | p.D261N | Q00987 | protein_coding | tolerated(0.52) | possibly_damaging(0.726) | TCGA-CA-6717-01 | Colorectum | colon adenocarcinoma | Male | <65 | I/II | Chemotherapy | oxaliplatin | CR |
| MDM2 | SNV | Missense_Mutation | c.1027G>A | p.Asp343Asn | p.D343N | Q00987 | protein_coding | tolerated(0.12) | benign(0.07) | TCGA-CM-5861-01 | Colorectum | colon adenocarcinoma | Female | <65 | I/II | Unknown | Unknown | PD |
| Page: 1 2 3 4 |
Top |
Related drugs of malignant transformation related genes |
| Identification of chemicals and drugs interact with genes involved in malignant transfromation |
| (DGIdb 4.0) |
| Entrez ID | Symbol | Category | Interaction Types | Drug Claim Name | Drug Name | PMIDs |
| 4193 | MDM2 | CLINICALLY ACTIONABLE, ENZYME, TUMOR SUPPRESSOR, DRUGGABLE GENOME | RG7388 | IDASANUTLIN | ||
| 4193 | MDM2 | CLINICALLY ACTIONABLE, ENZYME, TUMOR SUPPRESSOR, DRUGGABLE GENOME | PD-98059 | CHEMBL35482 | 15385570 | |
| 4193 | MDM2 | CLINICALLY ACTIONABLE, ENZYME, TUMOR SUPPRESSOR, DRUGGABLE GENOME | DNDI1417132 | CHEMBL1492017 | ||
| 4193 | MDM2 | CLINICALLY ACTIONABLE, ENZYME, TUMOR SUPPRESSOR, DRUGGABLE GENOME | Platinum compounds | 29662106 | ||
| 4193 | MDM2 | CLINICALLY ACTIONABLE, ENZYME, TUMOR SUPPRESSOR, DRUGGABLE GENOME | RO5045337 | RO-5045337 | ||
| 4193 | MDM2 | CLINICALLY ACTIONABLE, ENZYME, TUMOR SUPPRESSOR, DRUGGABLE GENOME | HELENALIN | HELENALIN | ||
| 4193 | MDM2 | CLINICALLY ACTIONABLE, ENZYME, TUMOR SUPPRESSOR, DRUGGABLE GENOME | TCDD | 15459018 | ||
| 4193 | MDM2 | CLINICALLY ACTIONABLE, ENZYME, TUMOR SUPPRESSOR, DRUGGABLE GENOME | ANTIANGIOGENIC | 17138942 | ||
| 4193 | MDM2 | CLINICALLY ACTIONABLE, ENZYME, TUMOR SUPPRESSOR, DRUGGABLE GENOME | APG-115 | |||
| 4193 | MDM2 | CLINICALLY ACTIONABLE, ENZYME, TUMOR SUPPRESSOR, DRUGGABLE GENOME | PEMBROLIZUMAB | PEMBROLIZUMAB | 28351930 |
| Page: 1 2 3 |

Copyright 2023-Present -The University of Texas Health Science Center at Houston |