
|
|||||
|
 | |
| |
| |
| |
| |
| |
|
Gene: MDK |
Gene summary for MDK |
| Gene information | Species | Human | Gene symbol | MDK | Gene ID | 4192 |
| Gene name | midkine | |
| Gene Alias | ARAP | |
| Cytomap | 11p11.2 | |
| Gene Type | protein-coding | GO ID | GO:0000003 | UniProtAcc | P21741 |
Top |
Malignant transformation analysis |
| Identification of the aberrant gene expression in precancerous and cancerous lesions by comparing the gene expression of stem-like cells in diseased tissues with normal stem cells |
| Entrez ID | Symbol | Replicates | Species | Organ | Tissue | Adj P-value | Log2FC | Malignancy |
| 4192 | MDK | GSM4909281 | Human | Breast | IDC | 4.80e-102 | 1.26e+00 | 0.21 |
| 4192 | MDK | GSM4909285 | Human | Breast | IDC | 4.52e-53 | 8.65e-01 | 0.21 |
| 4192 | MDK | GSM4909286 | Human | Breast | IDC | 3.03e-52 | 8.61e-01 | 0.1081 |
| 4192 | MDK | GSM4909287 | Human | Breast | IDC | 1.70e-07 | 3.95e-01 | 0.2057 |
| 4192 | MDK | GSM4909290 | Human | Breast | IDC | 1.12e-17 | 6.38e-01 | 0.2096 |
| 4192 | MDK | GSM4909291 | Human | Breast | IDC | 7.59e-28 | 8.26e-01 | 0.1753 |
| 4192 | MDK | GSM4909293 | Human | Breast | IDC | 2.43e-19 | 6.29e-01 | 0.1581 |
| 4192 | MDK | GSM4909294 | Human | Breast | IDC | 1.64e-20 | 4.08e-01 | 0.2022 |
| 4192 | MDK | GSM4909295 | Human | Breast | IDC | 2.76e-05 | 4.75e-01 | 0.0898 |
| 4192 | MDK | GSM4909296 | Human | Breast | IDC | 8.04e-06 | -2.40e-01 | 0.1524 |
| 4192 | MDK | GSM4909297 | Human | Breast | IDC | 9.28e-13 | 5.18e-02 | 0.1517 |
| 4192 | MDK | GSM4909299 | Human | Breast | IDC | 7.24e-07 | 4.29e-01 | 0.035 |
| 4192 | MDK | GSM4909300 | Human | Breast | IDC | 9.53e-05 | 4.76e-01 | 0.0334 |
| 4192 | MDK | GSM4909301 | Human | Breast | IDC | 8.10e-10 | -4.06e-01 | 0.1577 |
| 4192 | MDK | GSM4909304 | Human | Breast | IDC | 1.09e-15 | -5.04e-01 | 0.1636 |
| 4192 | MDK | GSM4909309 | Human | Breast | IDC | 1.94e-21 | 6.05e-01 | 0.0483 |
| 4192 | MDK | GSM4909311 | Human | Breast | IDC | 3.80e-25 | -4.82e-01 | 0.1534 |
| 4192 | MDK | GSM4909312 | Human | Breast | IDC | 5.92e-23 | -5.41e-01 | 0.1552 |
| 4192 | MDK | GSM4909313 | Human | Breast | IDC | 7.38e-14 | 4.93e-01 | 0.0391 |
| 4192 | MDK | GSM4909315 | Human | Breast | IDC | 2.49e-04 | 3.66e-01 | 0.21 |
| Page: 1 2 3 4 5 6 7 8 9 10 11 12 13 14 15 16 |
| Tissue | Expression Dynamics | Abbreviation |
| Breast |  | IDC: Invasive ductal carcinoma |
| DCIS: Ductal carcinoma in situ | ||
| Precancer(BRCA1-mut): Precancerous lesion from BRCA1 mutation carriers | ||
| Cervix | 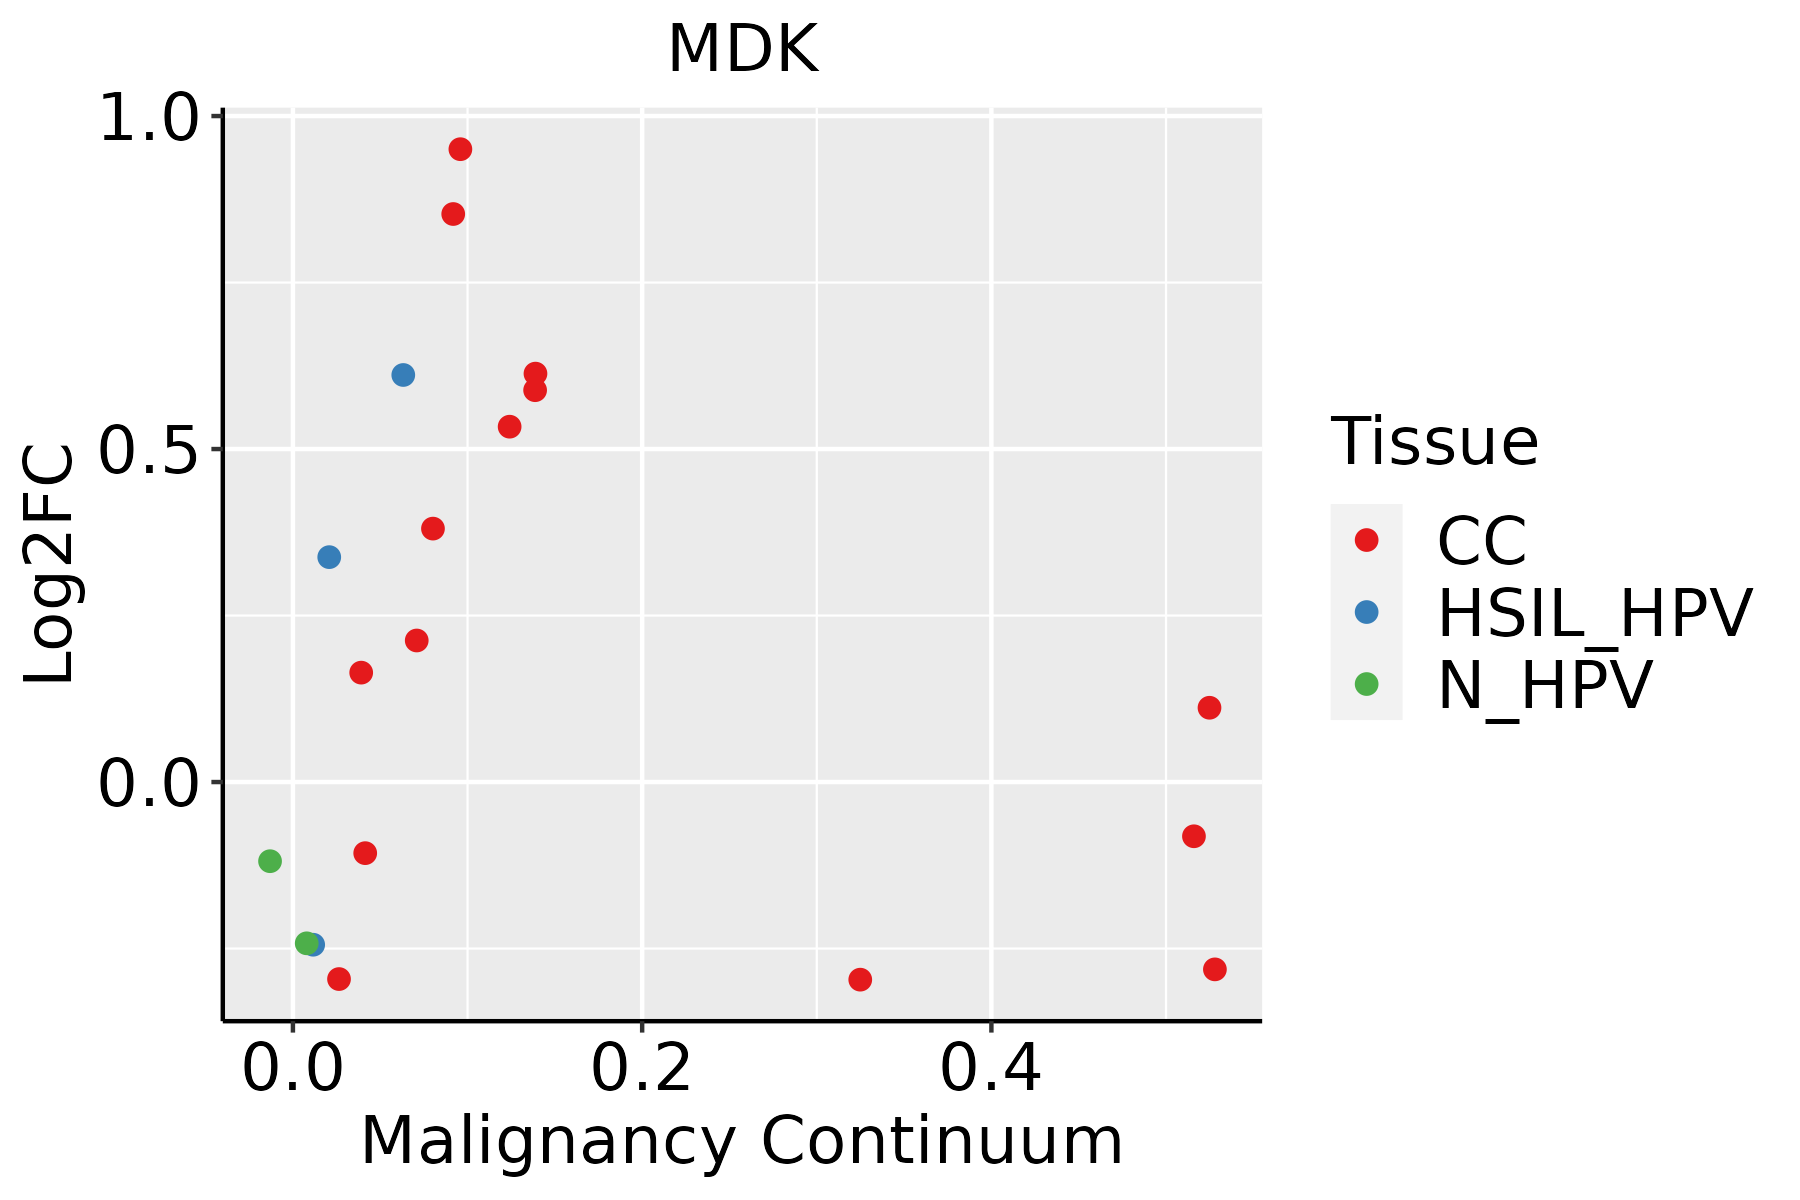 | CC: Cervix cancer |
| HSIL_HPV: HPV-infected high-grade squamous intraepithelial lesions | ||
| N_HPV: HPV-infected normal cervix | ||
| Colorectum (GSE201348) |  | FAP: Familial adenomatous polyposis |
| CRC: Colorectal cancer | ||
| Colorectum (HTA11) |  | AD: Adenomas |
| SER: Sessile serrated lesions | ||
| MSI-H: Microsatellite-high colorectal cancer | ||
| MSS: Microsatellite stable colorectal cancer | ||
| Endometrium |  | AEH: Atypical endometrial hyperplasia |
| EEC: Endometrioid Cancer | ||
| Esophagus | 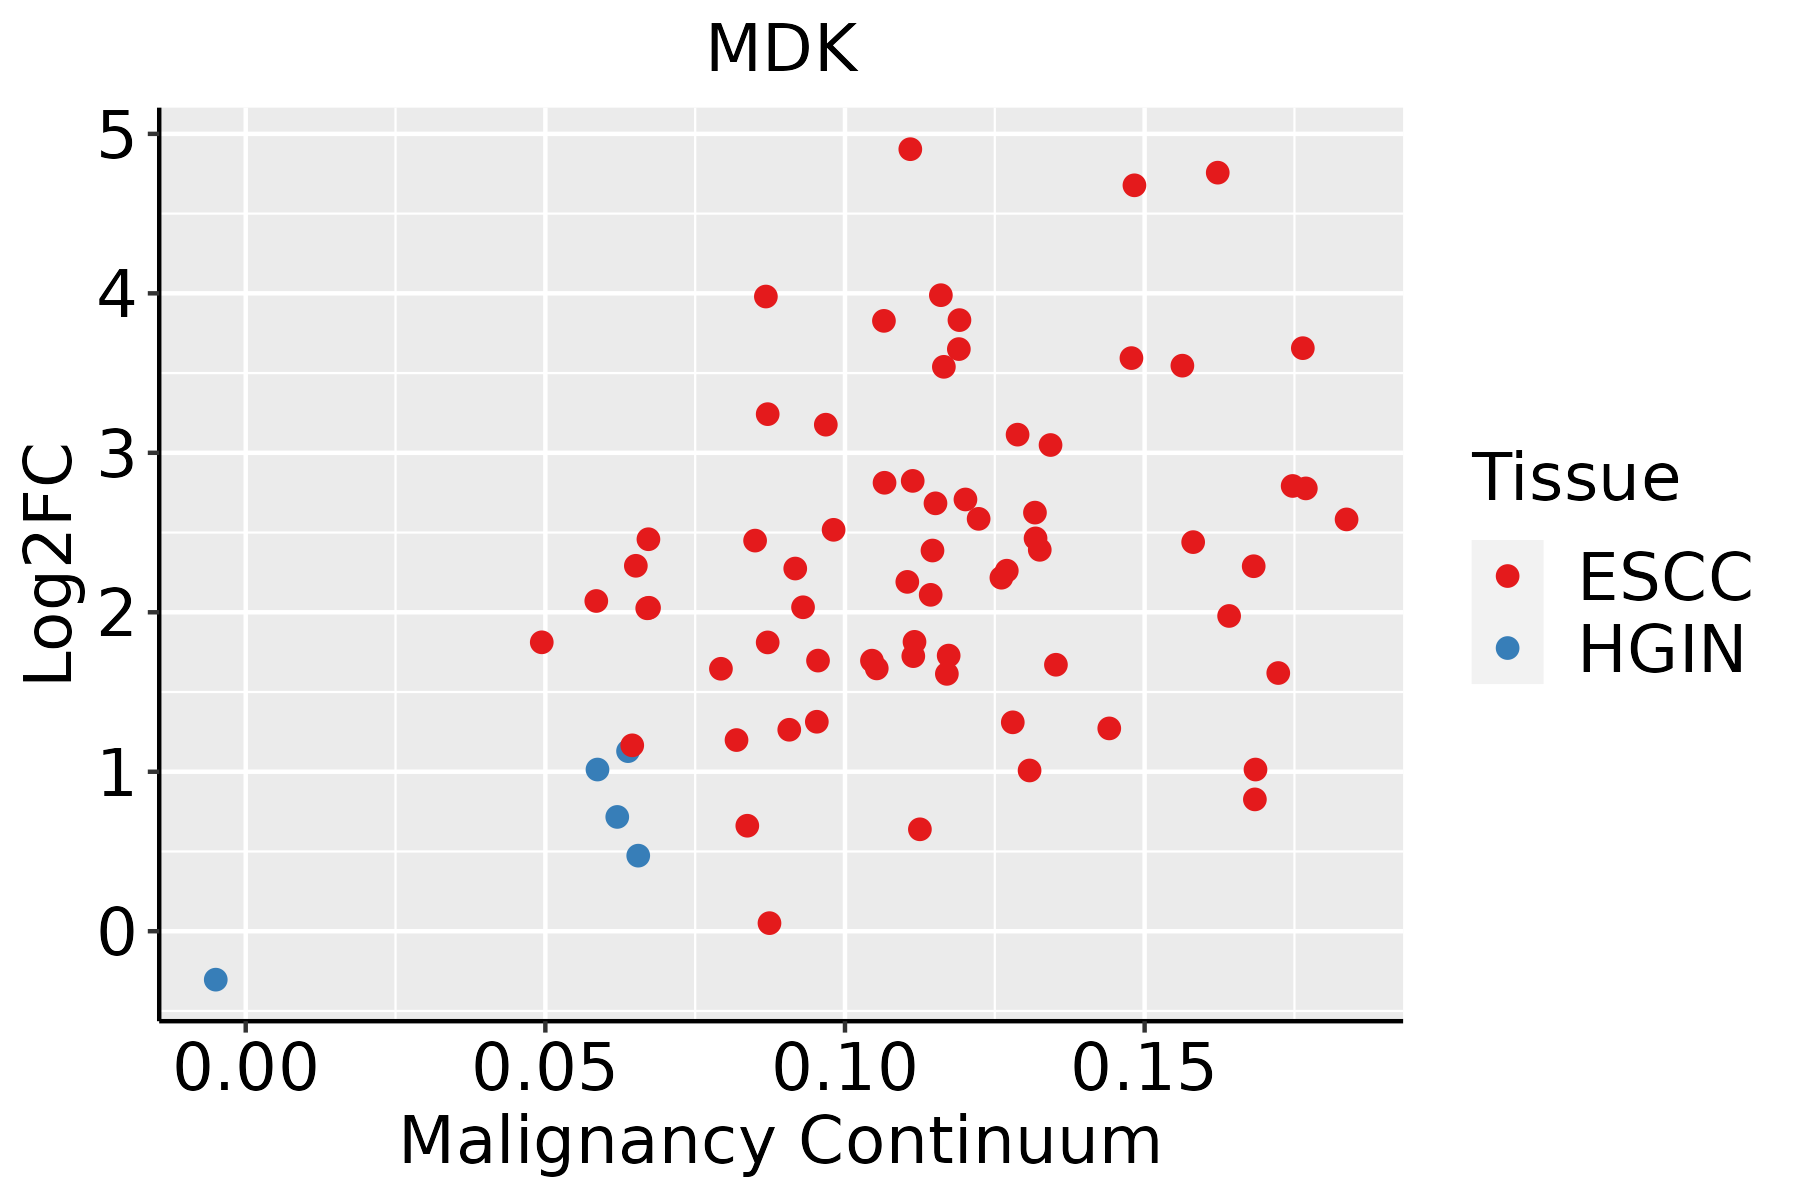 | ESCC: Esophageal squamous cell carcinoma |
| HGIN: High-grade intraepithelial neoplasias | ||
| LGIN: Low-grade intraepithelial neoplasias | ||
| GC |  | CAG: Chronic atrophic gastritis |
| CAG with IM: Chronic atrophic gastritis with intestinal metaplasia | ||
| CSG: Chronic superficial gastritis | ||
| GC: Gastric cancer | ||
| SIM: Severe intestinal metaplasia | ||
| WIM: Wild intestinal metaplasia | ||
| Liver |  | HCC: Hepatocellular carcinoma |
| NAFLD: Non-alcoholic fatty liver disease | ||
| Lung |  | AAH: Atypical adenomatous hyperplasia |
| AIS: Adenocarcinoma in situ | ||
| IAC: Invasive lung adenocarcinoma | ||
| MIA: Minimally invasive adenocarcinoma | ||
| Oral Cavity | 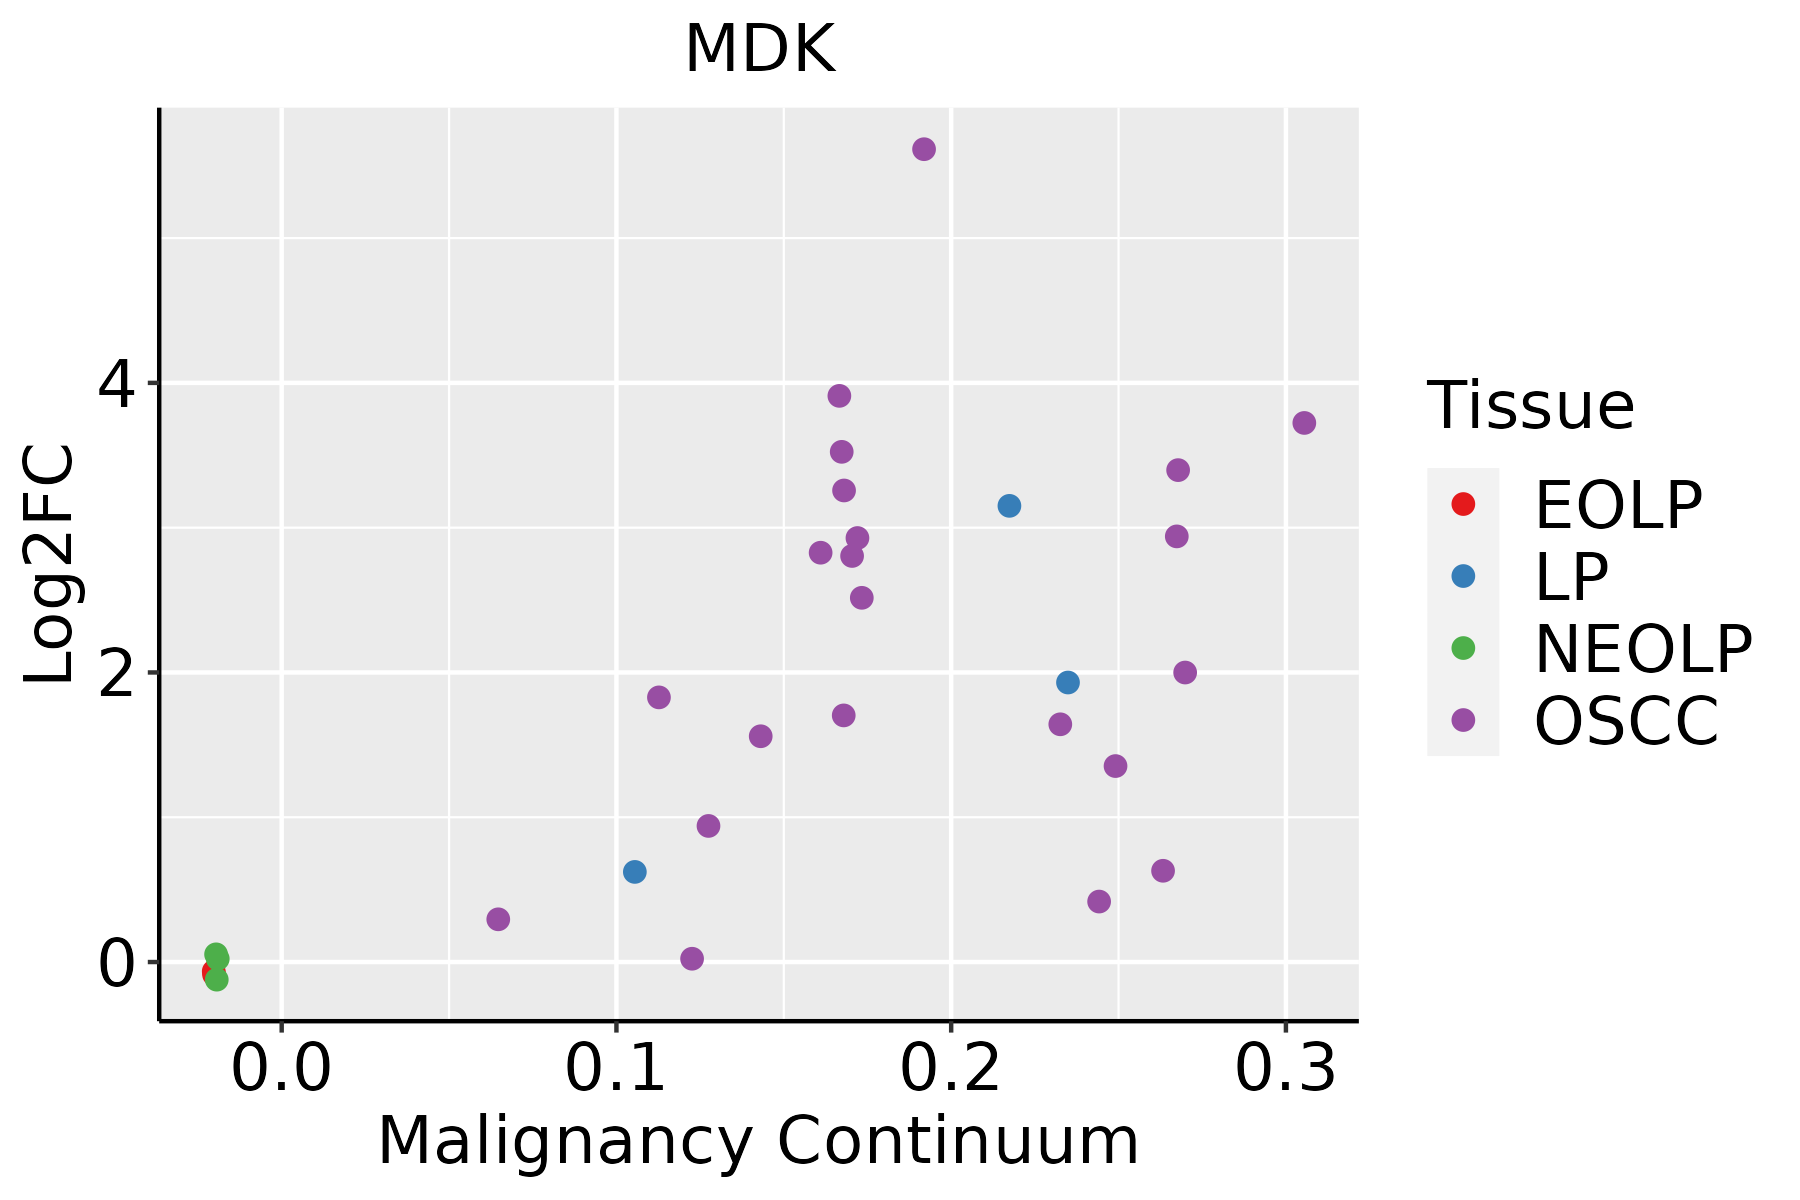 | EOLP: Erosive Oral lichen planus |
| LP: leukoplakia | ||
| NEOLP: Non-erosive oral lichen planus | ||
| OSCC: Oral squamous cell carcinoma | ||
| Prostate | 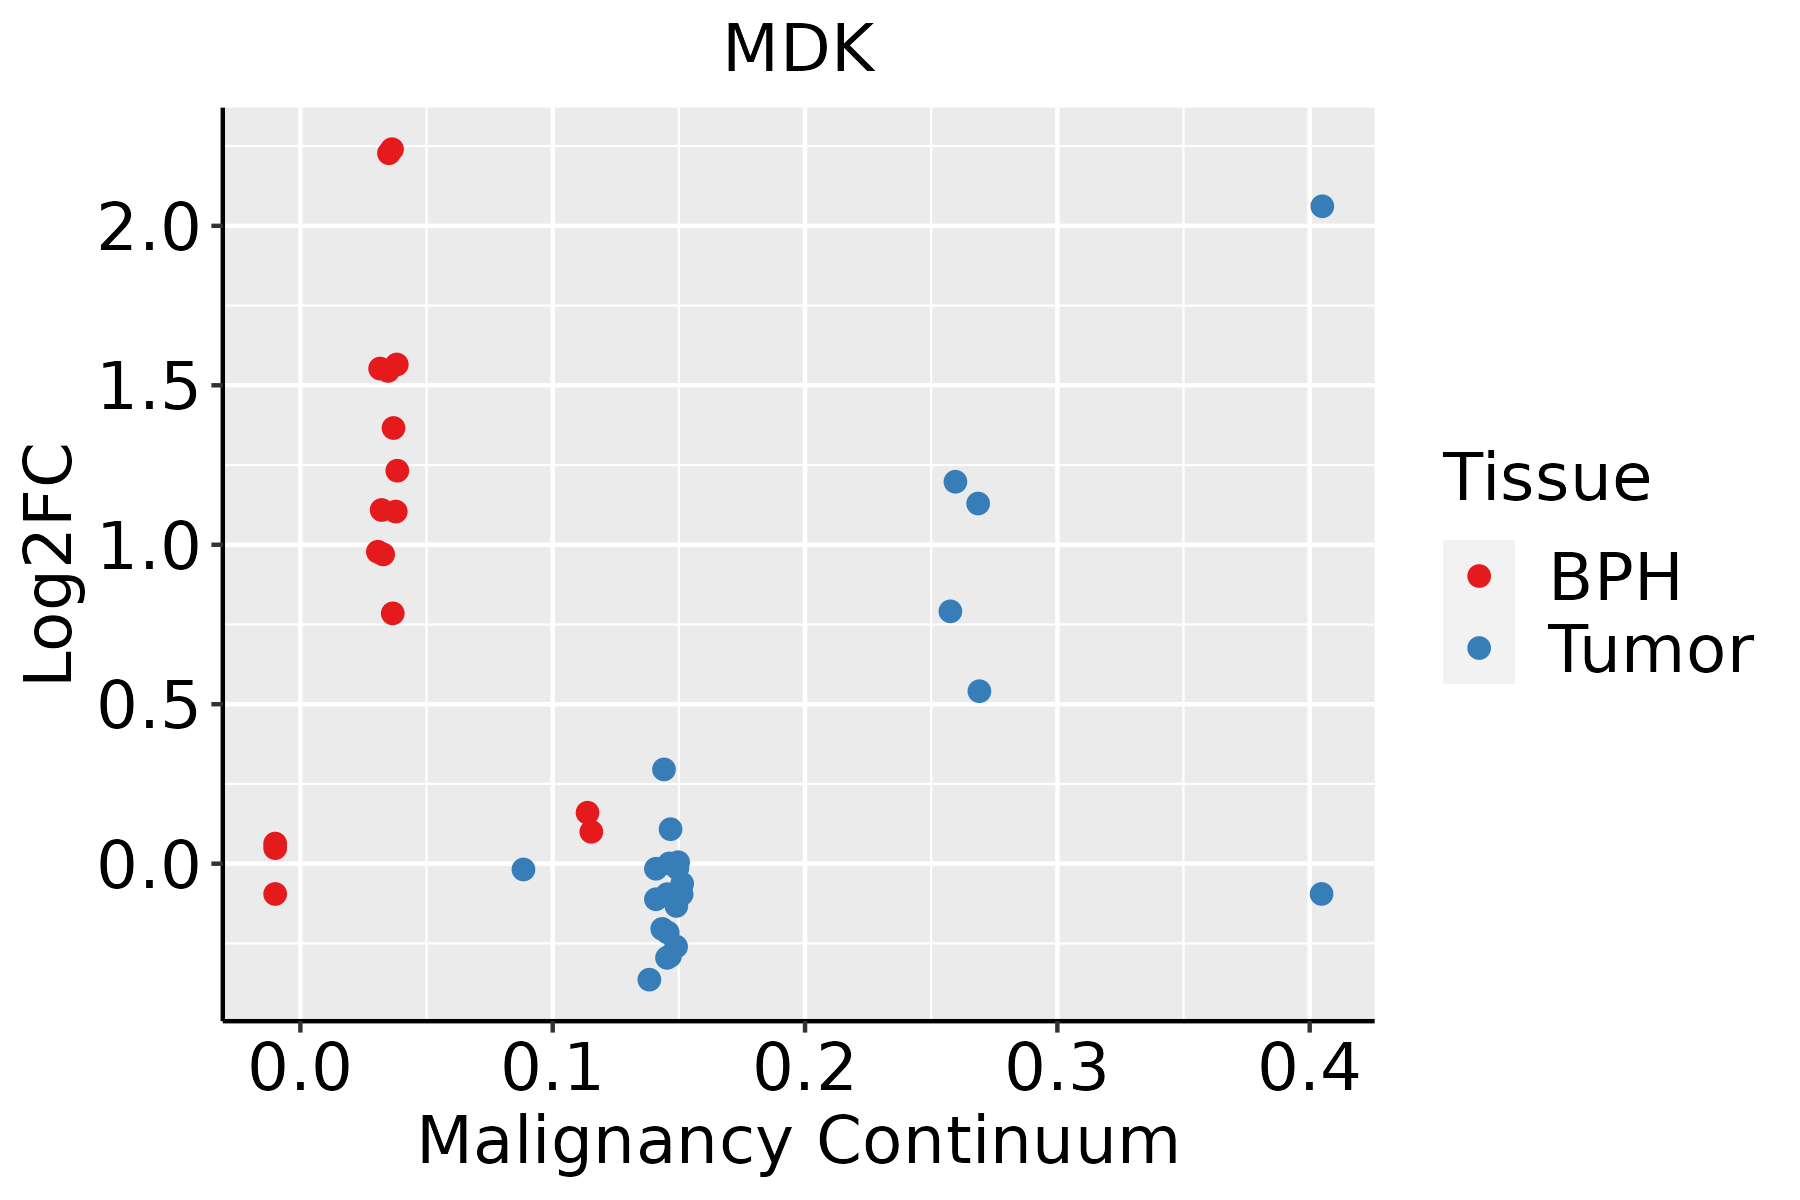 | BPH: Benign Prostatic Hyperplasia |
| Skin |  | AK: Actinic keratosis |
| cSCC: Cutaneous squamous cell carcinoma | ||
| SCCIS:squamous cell carcinoma in situ | ||
| Thyroid | 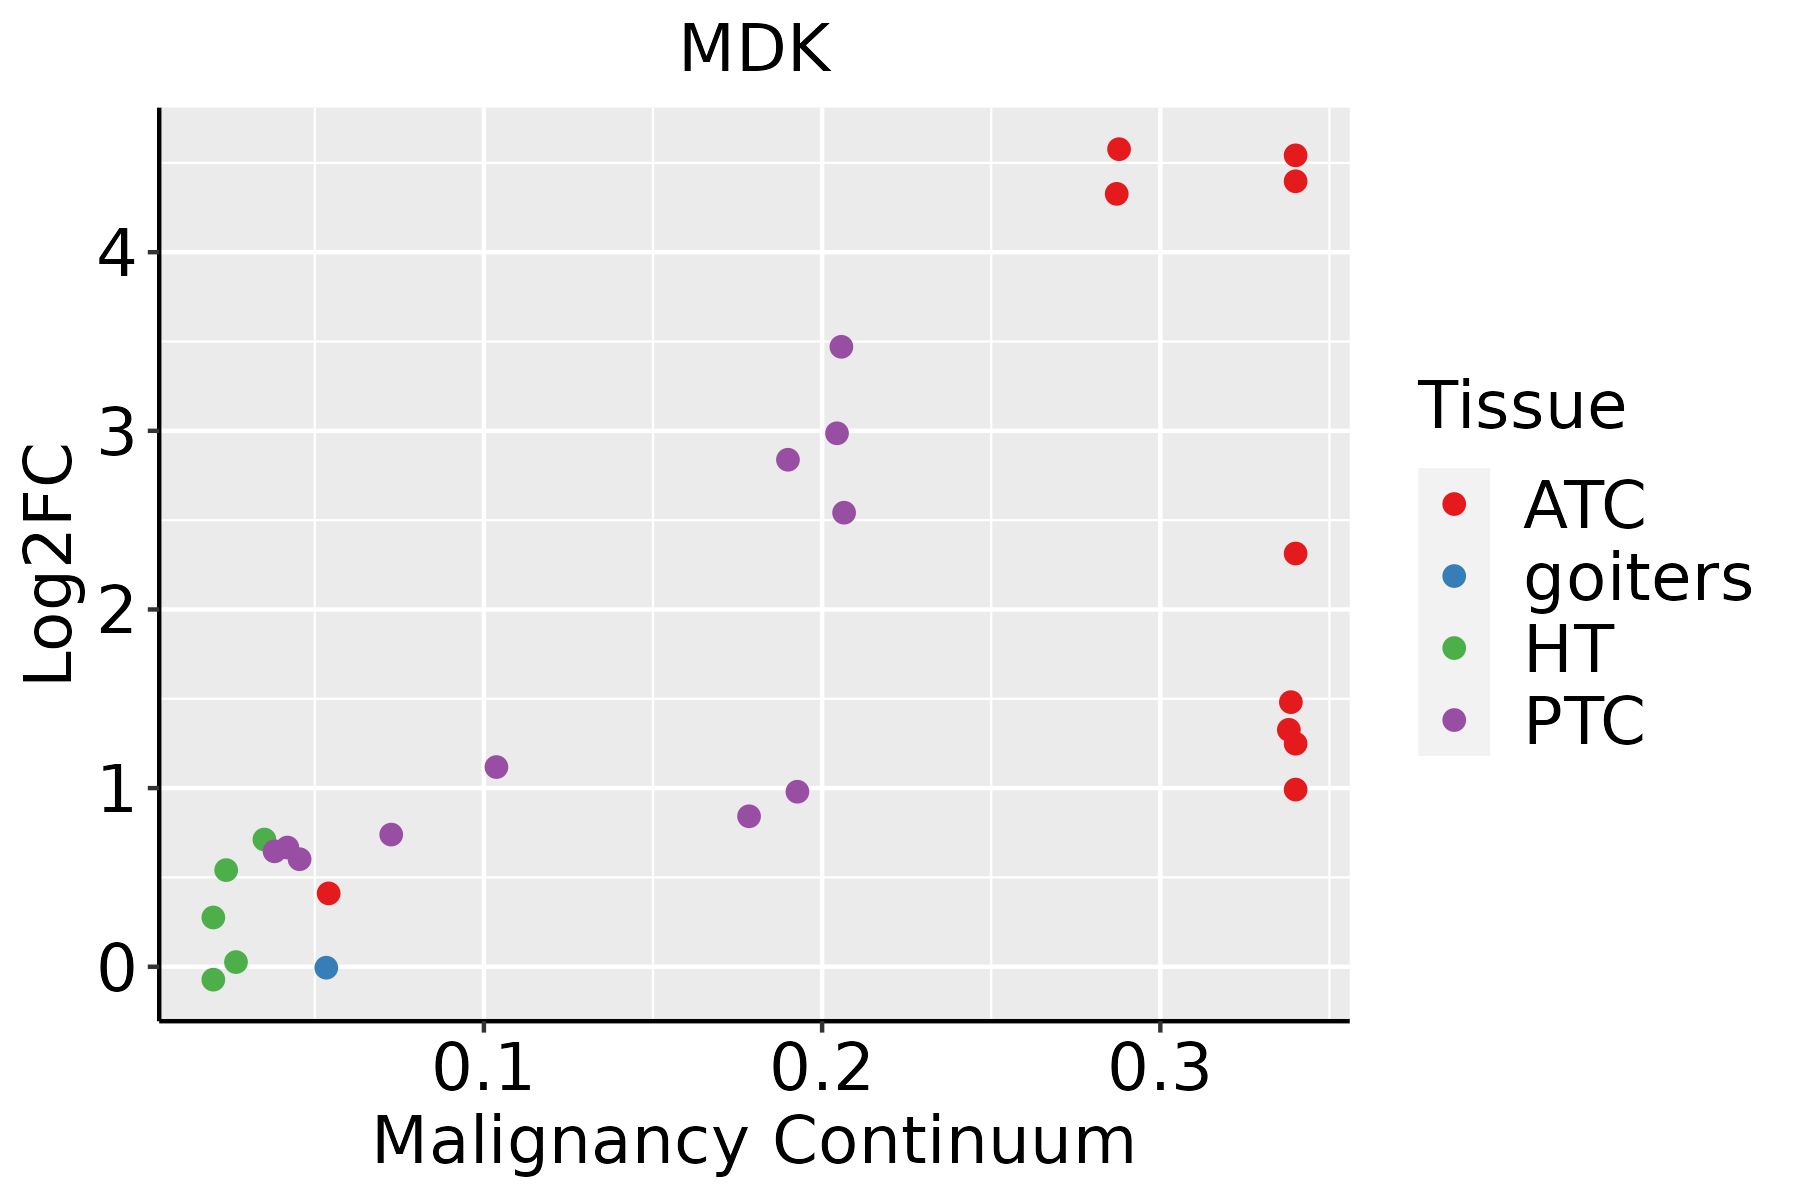 | ATC: Anaplastic thyroid cancer |
| HT: Hashimoto's thyroiditis | ||
| PTC: Papillary thyroid cancer |
| ∗log2FC in expression of this searched gene in stem-like cells from each diseased tissue sample relative to stem-like cells in normal samples in each tissue plotted against the malignancy continuum. Samples are colored based on if they are from different disease stage. |
Top |
Malignant transformation related pathway analysis |
| Find out the enriched GO biological processes and KEGG pathways involved in transition from healthy to precancer to cancer |
| Tissue | Disease Stage | Enriched GO biological Processes |
| Colorectum | AD |  |
| Colorectum | SER |  |
| Colorectum | MSS |  |
| Colorectum | MSI-H |  |
| Colorectum | FAP |  |
| ∗Top 15 enriched GO BP terms are showed in the bar plot of each disease state in each tissue. Each row represents a significant GO biological process which is colored according to the -log10(p.adjust). |
| Page: 1 2 3 4 5 6 7 8 9 |
| GO ID | Tissue | Disease Stage | Description | Gene Ratio | Bg Ratio | pvalue | p.adjust | Count |
| GO:00485459 | Breast | Precancer | response to steroid hormone | 53/1080 | 339/18723 | 3.07e-11 | 3.66e-09 | 53 |
| GO:00709979 | Breast | Precancer | neuron death | 50/1080 | 361/18723 | 7.75e-09 | 5.70e-07 | 50 |
| GO:00319608 | Breast | Precancer | response to corticosteroid | 30/1080 | 167/18723 | 2.50e-08 | 1.65e-06 | 30 |
| GO:00514029 | Breast | Precancer | neuron apoptotic process | 38/1080 | 246/18723 | 2.68e-08 | 1.75e-06 | 38 |
| GO:00975297 | Breast | Precancer | myeloid leukocyte migration | 34/1080 | 220/18723 | 1.42e-07 | 7.82e-06 | 34 |
| GO:00509006 | Breast | Precancer | leukocyte migration | 47/1080 | 369/18723 | 2.82e-07 | 1.39e-05 | 47 |
| GO:00513848 | Breast | Precancer | response to glucocorticoid | 26/1080 | 148/18723 | 3.32e-07 | 1.57e-05 | 26 |
| GO:00305956 | Breast | Precancer | leukocyte chemotaxis | 34/1080 | 230/18723 | 4.16e-07 | 1.89e-05 | 34 |
| GO:00457859 | Breast | Precancer | positive regulation of cell adhesion | 52/1080 | 437/18723 | 5.74e-07 | 2.49e-05 | 52 |
| GO:00603266 | Breast | Precancer | cell chemotaxis | 41/1080 | 310/18723 | 5.99e-07 | 2.55e-05 | 41 |
| GO:00716217 | Breast | Precancer | granulocyte chemotaxis | 23/1080 | 125/18723 | 6.73e-07 | 2.77e-05 | 23 |
| GO:19012149 | Breast | Precancer | regulation of neuron death | 41/1080 | 319/18723 | 1.27e-06 | 4.80e-05 | 41 |
| GO:00435237 | Breast | Precancer | regulation of neuron apoptotic process | 31/1080 | 212/18723 | 1.69e-06 | 6.08e-05 | 31 |
| GO:00975307 | Breast | Precancer | granulocyte migration | 24/1080 | 148/18723 | 4.04e-06 | 1.26e-04 | 24 |
| GO:00018196 | Breast | Precancer | positive regulation of cytokine production | 52/1080 | 467/18723 | 4.18e-06 | 1.29e-04 | 52 |
| GO:00305937 | Breast | Precancer | neutrophil chemotaxis | 19/1080 | 103/18723 | 5.94e-06 | 1.71e-04 | 19 |
| GO:00487329 | Breast | Precancer | gland development | 49/1080 | 436/18723 | 6.11e-06 | 1.73e-04 | 49 |
| GO:00507293 | Breast | Precancer | positive regulation of inflammatory response | 23/1080 | 142/18723 | 6.51e-06 | 1.81e-04 | 23 |
| GO:0050727 | Breast | Precancer | regulation of inflammatory response | 44/1080 | 386/18723 | 1.26e-05 | 3.22e-04 | 44 |
| GO:00421107 | Breast | Precancer | T cell activation | 52/1080 | 487/18723 | 1.37e-05 | 3.42e-04 | 52 |
| Page: 1 2 3 4 5 6 7 8 9 10 11 12 13 14 15 16 17 18 19 20 21 22 23 24 25 26 27 28 29 30 31 32 33 34 35 36 37 38 39 40 41 42 43 44 45 46 47 48 49 50 51 52 53 54 55 56 57 58 59 60 61 62 63 64 65 66 67 68 69 70 71 72 73 74 75 76 77 78 79 80 81 82 83 84 85 86 87 88 89 90 91 92 93 94 95 96 97 98 99 100 101 102 103 104 105 106 107 108 109 110 111 112 113 114 115 116 117 |
| Pathway ID | Tissue | Disease Stage | Description | Gene Ratio | Bg Ratio | pvalue | p.adjust | qvalue | Count |
| Page: 1 |
Top |
Cell-cell communication analysis |
| Identification of potential cell-cell interactions between two cell types and their ligand-receptor pairs for different disease states |
| Ligand | Receptor | LRpair | Pathway | Tissue | Disease Stage |
| MDK | SDC2 | MDK_SDC2 | MK | Breast | ADJ |
| MDK | SDC4 | MDK_SDC4 | MK | Breast | ADJ |
| MDK | ITGA4_ITGB1 | MDK_ITGA4_ITGB1 | MK | Breast | ADJ |
| MDK | NCL | MDK_NCL | MK | Breast | ADJ |
| MDK | SDC1 | MDK_SDC1 | MK | Breast | DCIS |
| MDK | SDC2 | MDK_SDC2 | MK | Breast | DCIS |
| MDK | SDC4 | MDK_SDC4 | MK | Breast | DCIS |
| MDK | ITGA4_ITGB1 | MDK_ITGA4_ITGB1 | MK | Breast | DCIS |
| MDK | ITGA6_ITGB1 | MDK_ITGA6_ITGB1 | MK | Breast | DCIS |
| MDK | LRP1 | MDK_LRP1 | MK | Breast | DCIS |
| MDK | NCL | MDK_NCL | MK | Breast | DCIS |
| MDK | SDC1 | MDK_SDC1 | MK | Breast | Healthy |
| MDK | SDC2 | MDK_SDC2 | MK | Breast | Healthy |
| MDK | SDC4 | MDK_SDC4 | MK | Breast | Healthy |
| MDK | ITGA4_ITGB1 | MDK_ITGA4_ITGB1 | MK | Breast | Healthy |
| MDK | ITGA6_ITGB1 | MDK_ITGA6_ITGB1 | MK | Breast | Healthy |
| MDK | LRP1 | MDK_LRP1 | MK | Breast | Healthy |
| MDK | NCL | MDK_NCL | MK | Breast | Healthy |
| MDK | SDC1 | MDK_SDC1 | MK | Breast | IDC |
| MDK | SDC2 | MDK_SDC2 | MK | Breast | IDC |
| Page: 1 2 3 4 5 6 7 8 9 10 11 12 13 14 15 16 |
Top |
Single-cell gene regulatory network inference analysis |
| Find out the significant the regulons (TFs) and the target genes of each regulon across cell types for different disease states |
| TF | Cell Type | Tissue | Disease Stage | Target Gene | RSS | Regulon Activity |
| ∗The dot plots of a searched regulon are shown for all cell subpopulations in each disease state of each tissue based on the regulon specific score inferred using pySCENIC and by calculating the average expression. |
| Page: 1 |
Top |
Somatic mutation of malignant transformation related genes |
| Annotation of somatic variants for genes involved in malignant transformation |
| Hugo Symbol | Variant Class | Variant Classification | dbSNP RS | HGVSc | HGVSp | HGVSp Short | SWISSPROT | BIOTYPE | SIFT | PolyPhen | Tumor Sample Barcode | Tissue | Histology | Sex | Age | Stage | Therapy Types | Drugs | Outcome |
| MDK | SNV | Missense_Mutation | c.41N>C | p.Leu14Pro | p.L14P | P21741 | protein_coding | deleterious(0) | possibly_damaging(0.894) | TCGA-B6-A0WZ-01 | Breast | breast invasive carcinoma | Female | <65 | I/II | Unknown | Unknown | PD | |
| MDK | SNV | Missense_Mutation | rs533427797 | c.106G>C | p.Glu36Gln | p.E36Q | P21741 | protein_coding | deleterious(0.05) | benign(0.023) | TCGA-C5-A1MJ-01 | Cervix | cervical & endocervical cancer | Female | <65 | I/II | Unknown | Unknown | SD |
| MDK | SNV | Missense_Mutation | c.411N>T | p.Lys137Asn | p.K137N | P21741 | protein_coding | tolerated(0.14) | possibly_damaging(0.812) | TCGA-AX-A05Z-01 | Endometrium | uterine corpus endometrioid carcinoma | Female | <65 | III/IV | Chemotherapy | adriamycin | SD | |
| MDK | SNV | Missense_Mutation | novel | c.269N>G | p.Asn90Ser | p.N90S | P21741 | protein_coding | tolerated(1) | benign(0) | TCGA-E6-A1LX-01 | Endometrium | uterine corpus endometrioid carcinoma | Female | <65 | I/II | Unknown | Unknown | SD |
| MDK | SNV | Missense_Mutation | novel | c.130C>T | p.Pro44Ser | p.P44S | P21741 | protein_coding | tolerated(0.77) | benign(0.062) | TCGA-FI-A2D5-01 | Endometrium | uterine corpus endometrioid carcinoma | Female | <65 | III/IV | Chemotherapy | carboplatinum | PD |
| MDK | SNV | Missense_Mutation | novel | c.37N>T | p.Ala13Ser | p.A13S | P21741 | protein_coding | tolerated(0.27) | benign(0.012) | TCGA-91-8499-01 | Lung | lung adenocarcinoma | Female | >=65 | I/II | Unknown | Unknown | SD |
| MDK | SNV | Missense_Mutation | novel | c.358N>G | p.Ile120Val | p.I120V | P21741 | protein_coding | tolerated(0.72) | benign(0.03) | TCGA-RD-A8NB-01 | Stomach | stomach adenocarcinoma | Female | >=65 | III/IV | Unknown | Unknown | PD |
| MDK | insertion | Frame_Shift_Ins | novel | c.124_125insG | p.Pro44AlafsTer46 | p.P44Afs*46 | P21741 | protein_coding | TCGA-D7-A4YY-01 | Stomach | stomach adenocarcinoma | Male | <65 | III/IV | Chemotherapy | 5-fluorouracil | SD |
| Page: 1 |
Top |
Related drugs of malignant transformation related genes |
| Identification of chemicals and drugs interact with genes involved in malignant transfromation |
| (DGIdb 4.0) |
| Entrez ID | Symbol | Category | Interaction Types | Drug Claim Name | Drug Name | PMIDs |
| 4192 | MDK | GROWTH FACTOR, DRUGGABLE GENOME, KINASE | RETINOIC ACID | 1819274 |
| Page: 1 |

Copyright 2023-Present -The University of Texas Health Science Center at Houston |