
|
|||||
|
 | |
| |
| |
| |
| |
| |
|
Gene: MDH1 |
Gene summary for MDH1 |
| Gene information | Species | Human | Gene symbol | MDH1 | Gene ID | 4190 |
| Gene name | malate dehydrogenase 1 | |
| Gene Alias | DEE88 | |
| Cytomap | 2p15 | |
| Gene Type | protein-coding | GO ID | GO:0005975 | UniProtAcc | P40925 |
Top |
Malignant transformation analysis |
| Identification of the aberrant gene expression in precancerous and cancerous lesions by comparing the gene expression of stem-like cells in diseased tissues with normal stem cells |
| Entrez ID | Symbol | Replicates | Species | Organ | Tissue | Adj P-value | Log2FC | Malignancy |
| 4190 | MDH1 | GSM4909281 | Human | Breast | IDC | 8.00e-07 | 4.13e-01 | 0.21 |
| 4190 | MDH1 | GSM4909282 | Human | Breast | IDC | 3.03e-14 | 5.08e-01 | -0.0288 |
| 4190 | MDH1 | GSM4909285 | Human | Breast | IDC | 1.26e-13 | 5.44e-01 | 0.21 |
| 4190 | MDH1 | GSM4909296 | Human | Breast | IDC | 3.74e-06 | -5.61e-02 | 0.1524 |
| 4190 | MDH1 | GSM4909297 | Human | Breast | IDC | 6.60e-11 | -7.24e-02 | 0.1517 |
| 4190 | MDH1 | GSM4909301 | Human | Breast | IDC | 2.33e-04 | -1.91e-01 | 0.1577 |
| 4190 | MDH1 | GSM4909311 | Human | Breast | IDC | 1.47e-25 | -3.11e-01 | 0.1534 |
| 4190 | MDH1 | GSM4909312 | Human | Breast | IDC | 2.55e-09 | -1.24e-01 | 0.1552 |
| 4190 | MDH1 | GSM4909319 | Human | Breast | IDC | 2.00e-30 | -2.76e-01 | 0.1563 |
| 4190 | MDH1 | GSM4909321 | Human | Breast | IDC | 2.32e-11 | -1.32e-01 | 0.1559 |
| 4190 | MDH1 | brca1 | Human | Breast | Precancer | 4.11e-03 | 3.39e-01 | -0.0338 |
| 4190 | MDH1 | brca2 | Human | Breast | Precancer | 8.54e-03 | 2.73e-01 | -0.024 |
| 4190 | MDH1 | M2 | Human | Breast | IDC | 1.91e-04 | 1.86e-01 | 0.21 |
| 4190 | MDH1 | NCCBC14 | Human | Breast | DCIS | 4.91e-05 | 6.29e-02 | 0.2021 |
| 4190 | MDH1 | NCCBC5 | Human | Breast | DCIS | 4.76e-10 | 1.05e-01 | 0.2046 |
| 4190 | MDH1 | P1 | Human | Breast | IDC | 2.65e-15 | -1.04e-01 | 0.1527 |
| 4190 | MDH1 | P2 | Human | Breast | IDC | 5.47e-03 | 2.01e-01 | 0.21 |
| 4190 | MDH1 | DCIS2 | Human | Breast | DCIS | 1.14e-54 | 1.81e-01 | 0.0085 |
| 4190 | MDH1 | HTA11_3410_2000001011 | Human | Colorectum | AD | 4.51e-11 | 3.79e-01 | 0.0155 |
| 4190 | MDH1 | HTA11_2487_2000001011 | Human | Colorectum | SER | 1.61e-02 | 3.25e-01 | -0.1808 |
| Page: 1 2 3 4 5 6 7 8 9 10 |
| Tissue | Expression Dynamics | Abbreviation |
| Breast |  | IDC: Invasive ductal carcinoma |
| DCIS: Ductal carcinoma in situ | ||
| Precancer(BRCA1-mut): Precancerous lesion from BRCA1 mutation carriers | ||
| Colorectum (GSE201348) |  | FAP: Familial adenomatous polyposis |
| CRC: Colorectal cancer | ||
| Colorectum (HTA11) |  | AD: Adenomas |
| SER: Sessile serrated lesions | ||
| MSI-H: Microsatellite-high colorectal cancer | ||
| MSS: Microsatellite stable colorectal cancer | ||
| Esophagus | 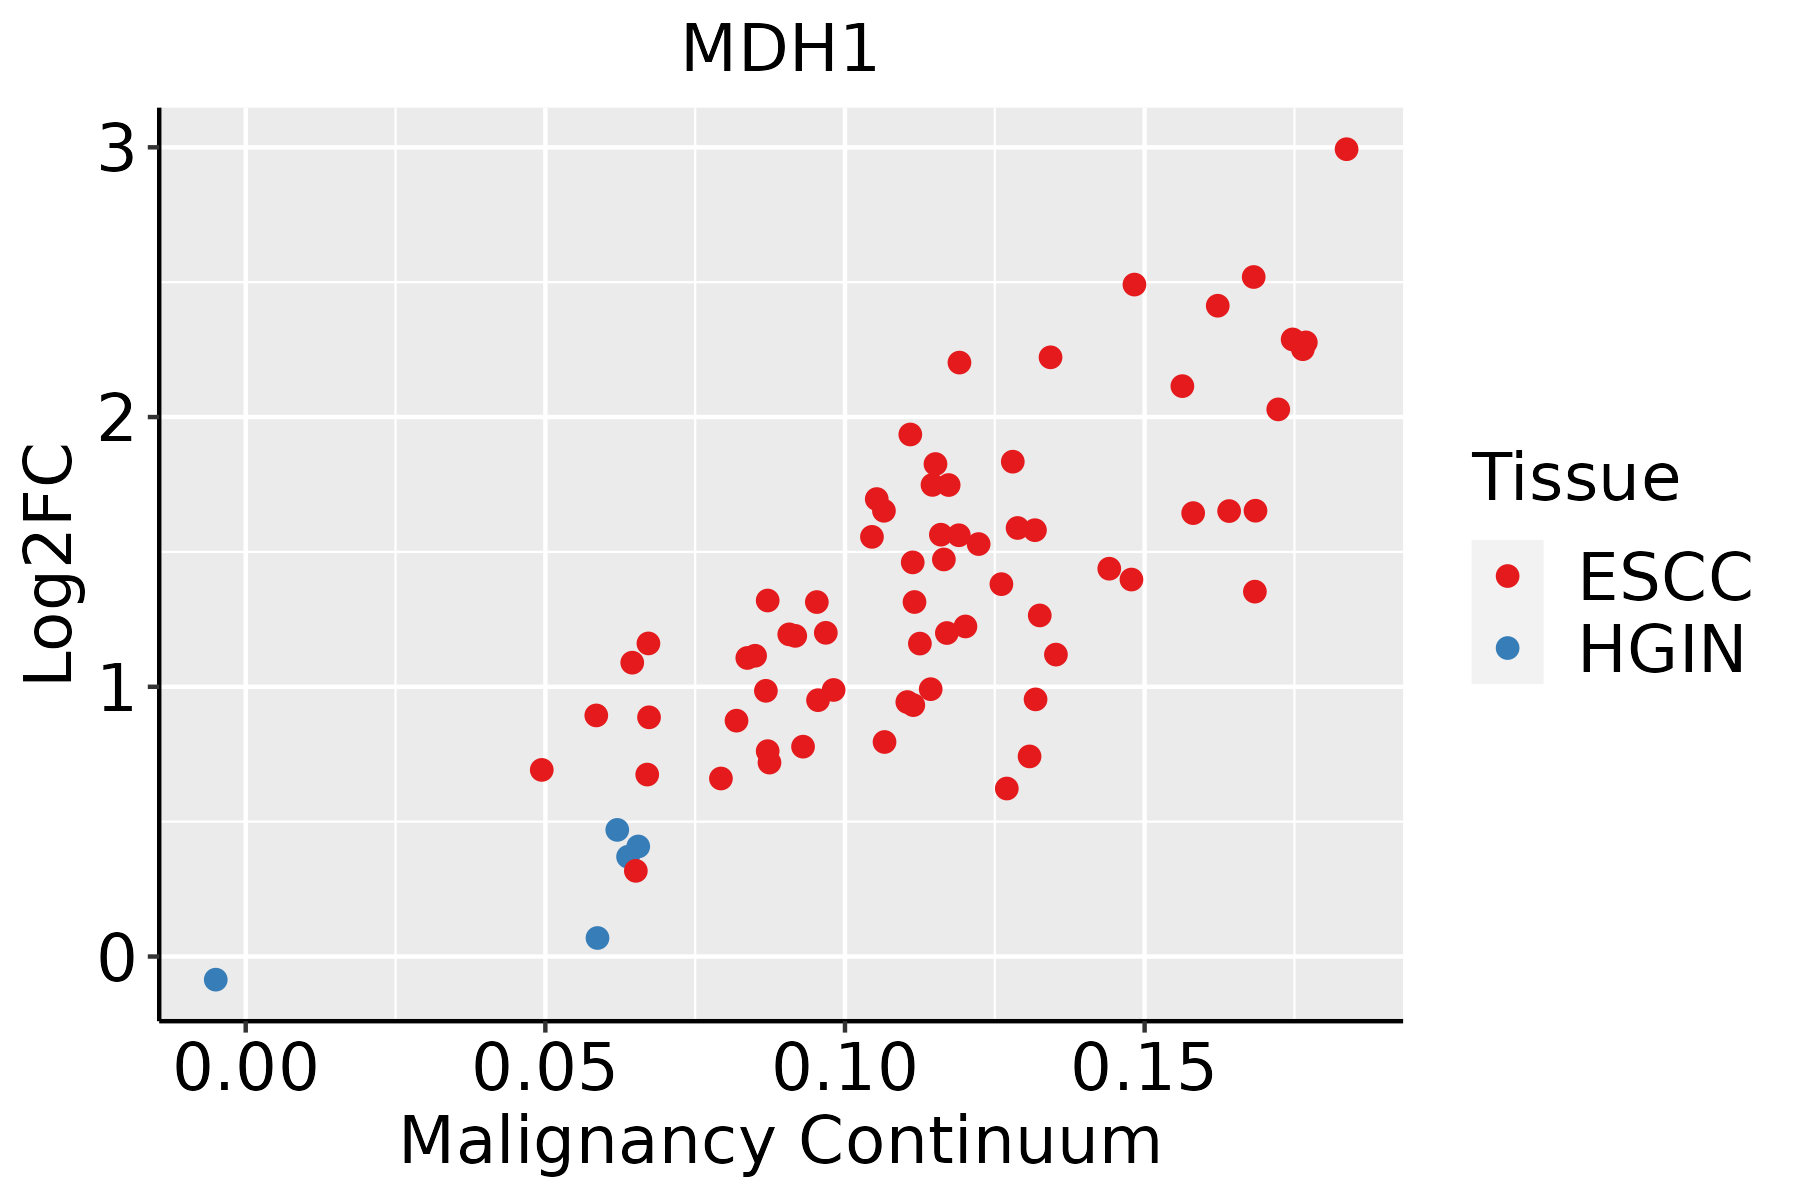 | ESCC: Esophageal squamous cell carcinoma |
| HGIN: High-grade intraepithelial neoplasias | ||
| LGIN: Low-grade intraepithelial neoplasias | ||
| Liver | 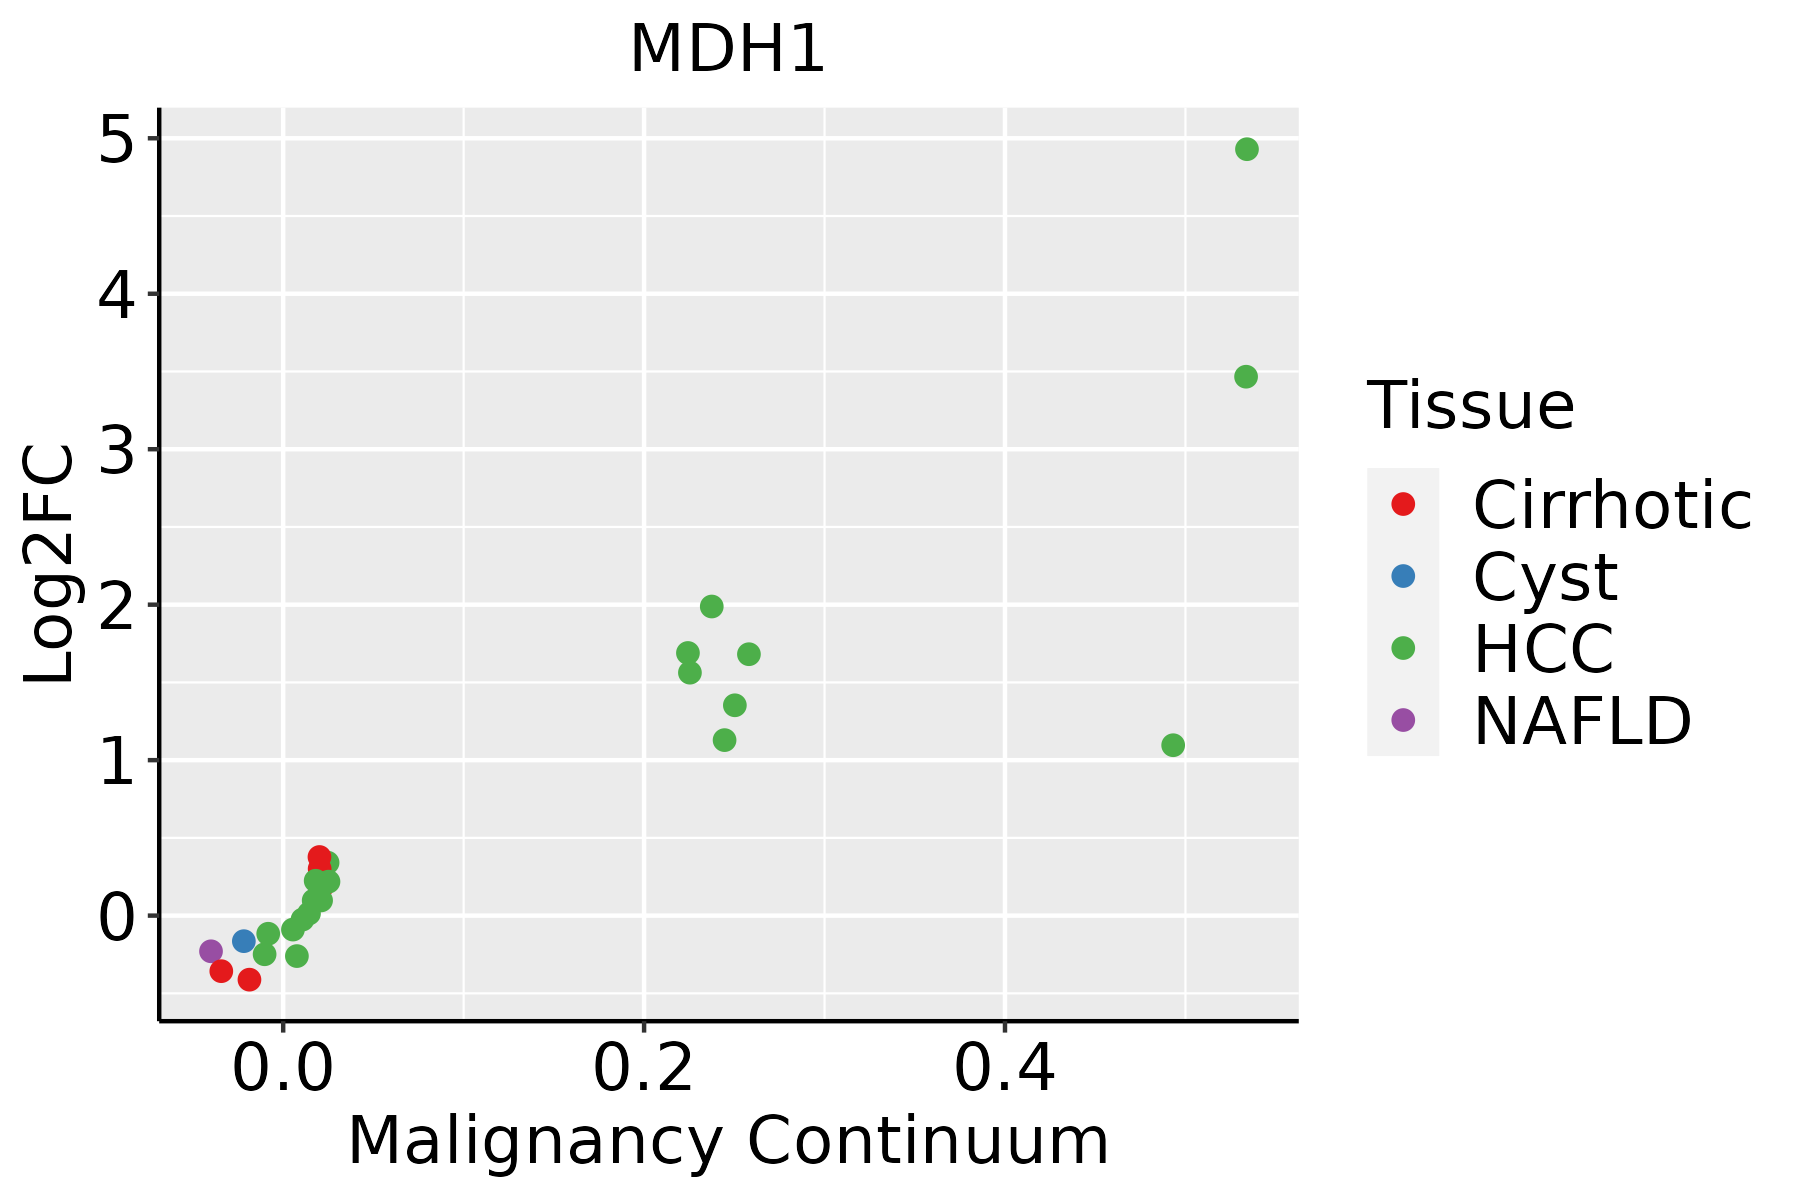 | HCC: Hepatocellular carcinoma |
| NAFLD: Non-alcoholic fatty liver disease | ||
| Oral Cavity | 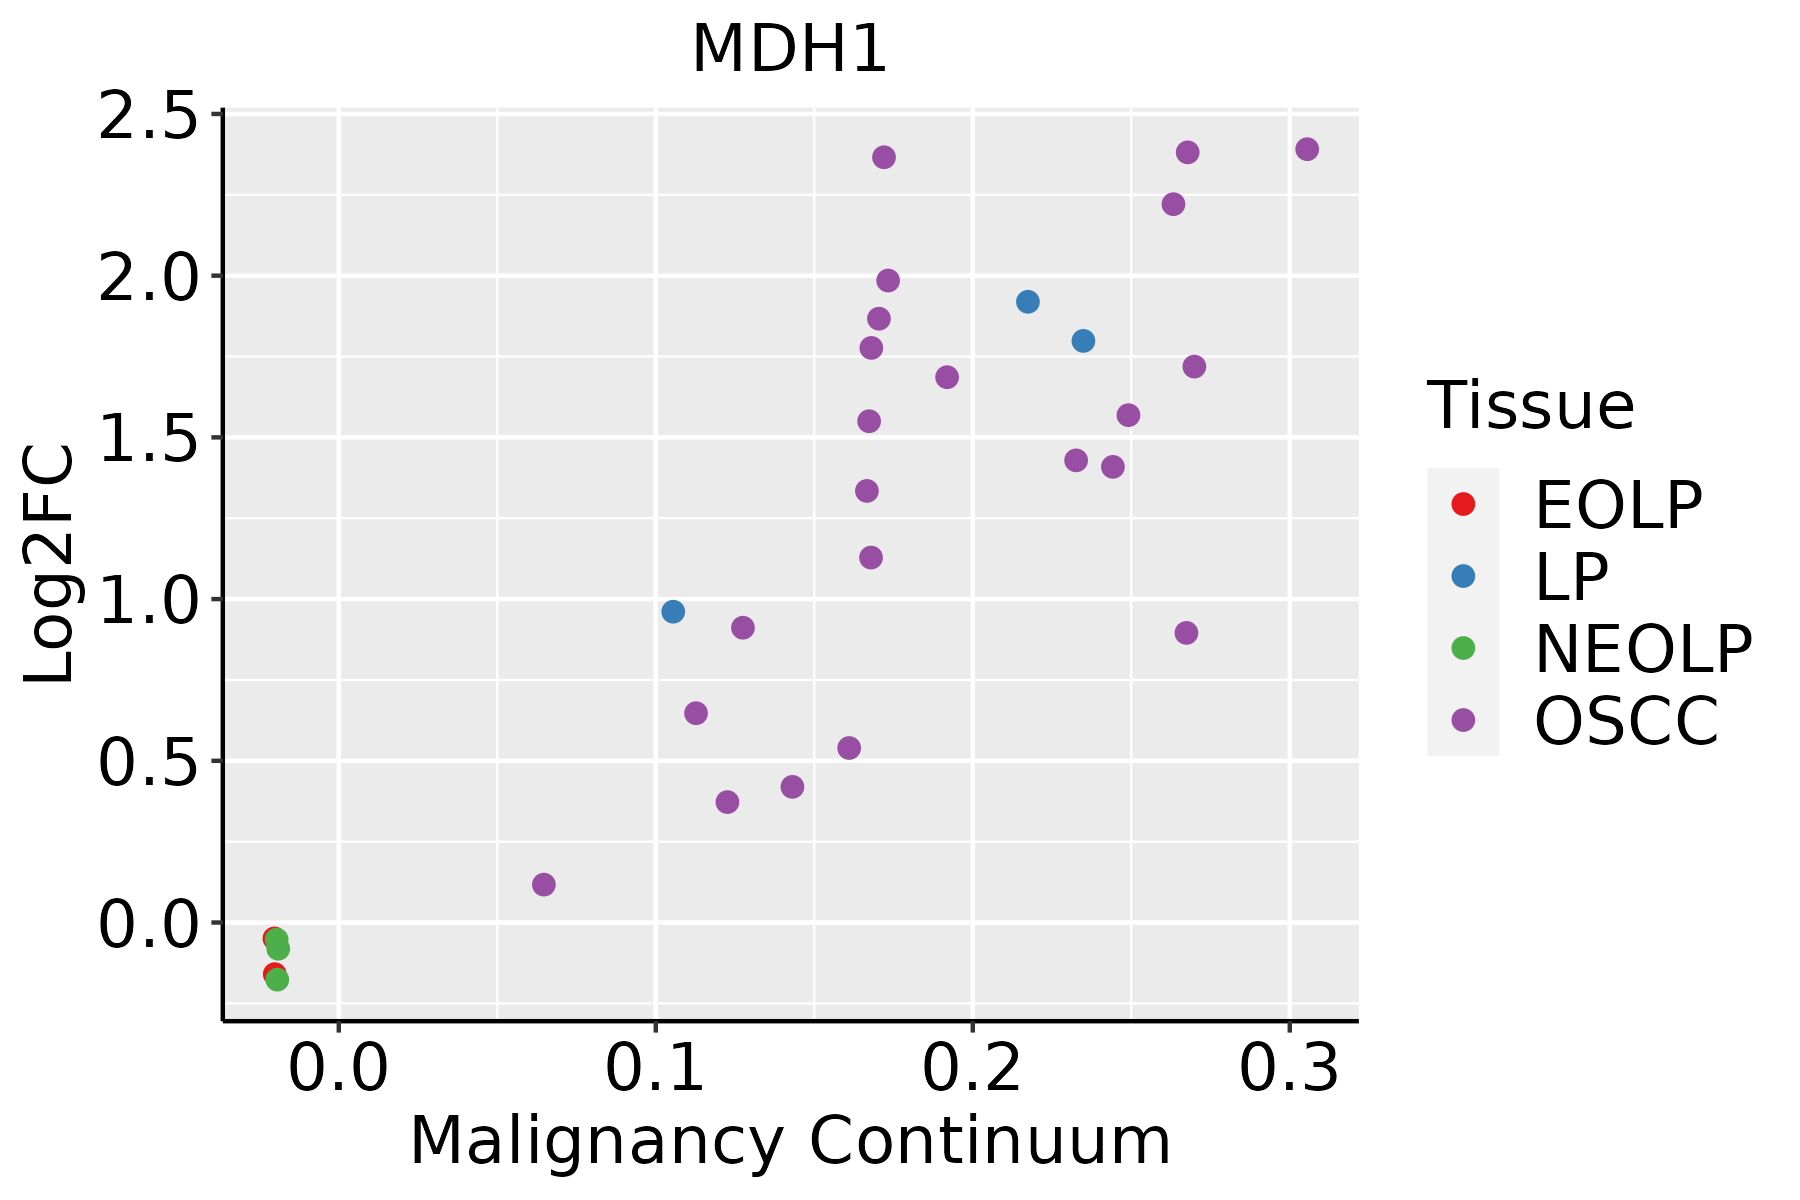 | EOLP: Erosive Oral lichen planus |
| LP: leukoplakia | ||
| NEOLP: Non-erosive oral lichen planus | ||
| OSCC: Oral squamous cell carcinoma | ||
| Prostate | 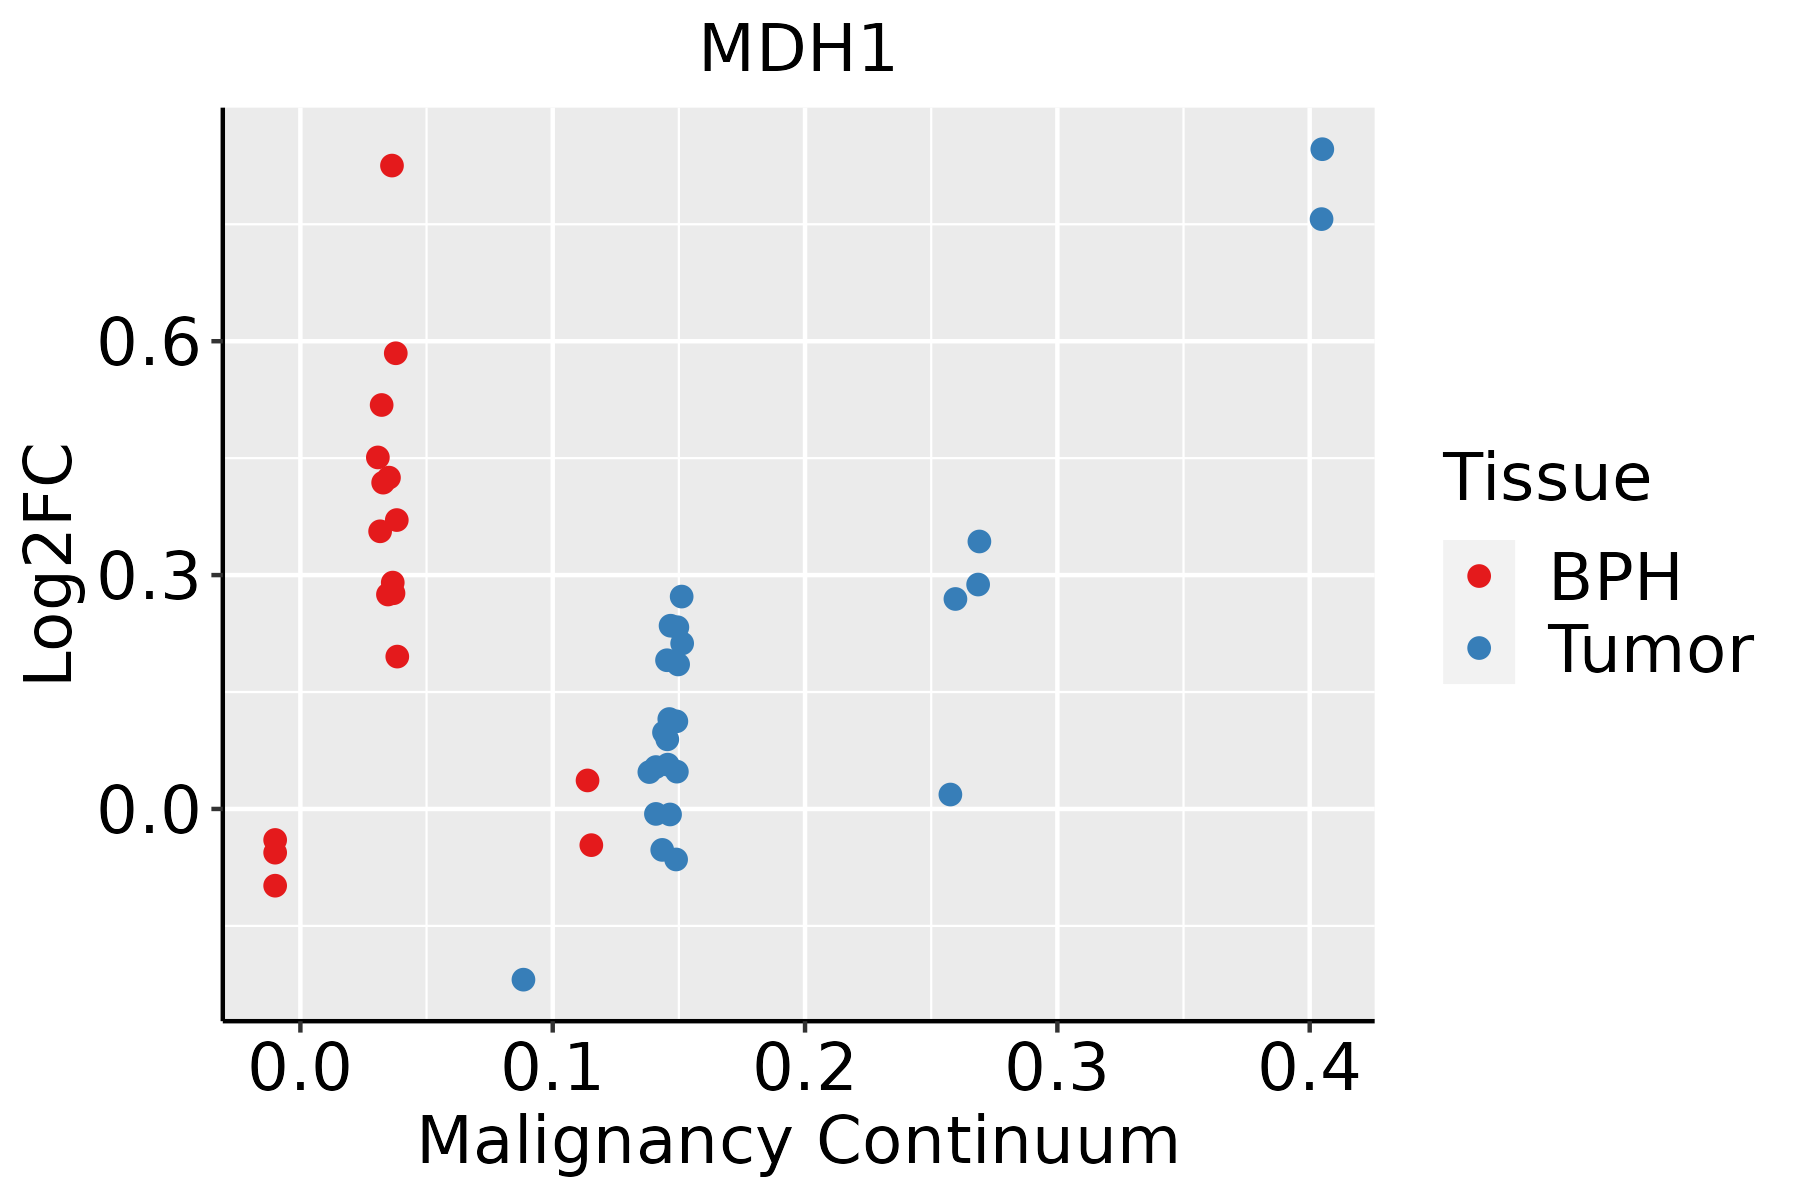 | BPH: Benign Prostatic Hyperplasia |
| Skin |  | AK: Actinic keratosis |
| cSCC: Cutaneous squamous cell carcinoma | ||
| SCCIS:squamous cell carcinoma in situ | ||
| Thyroid | 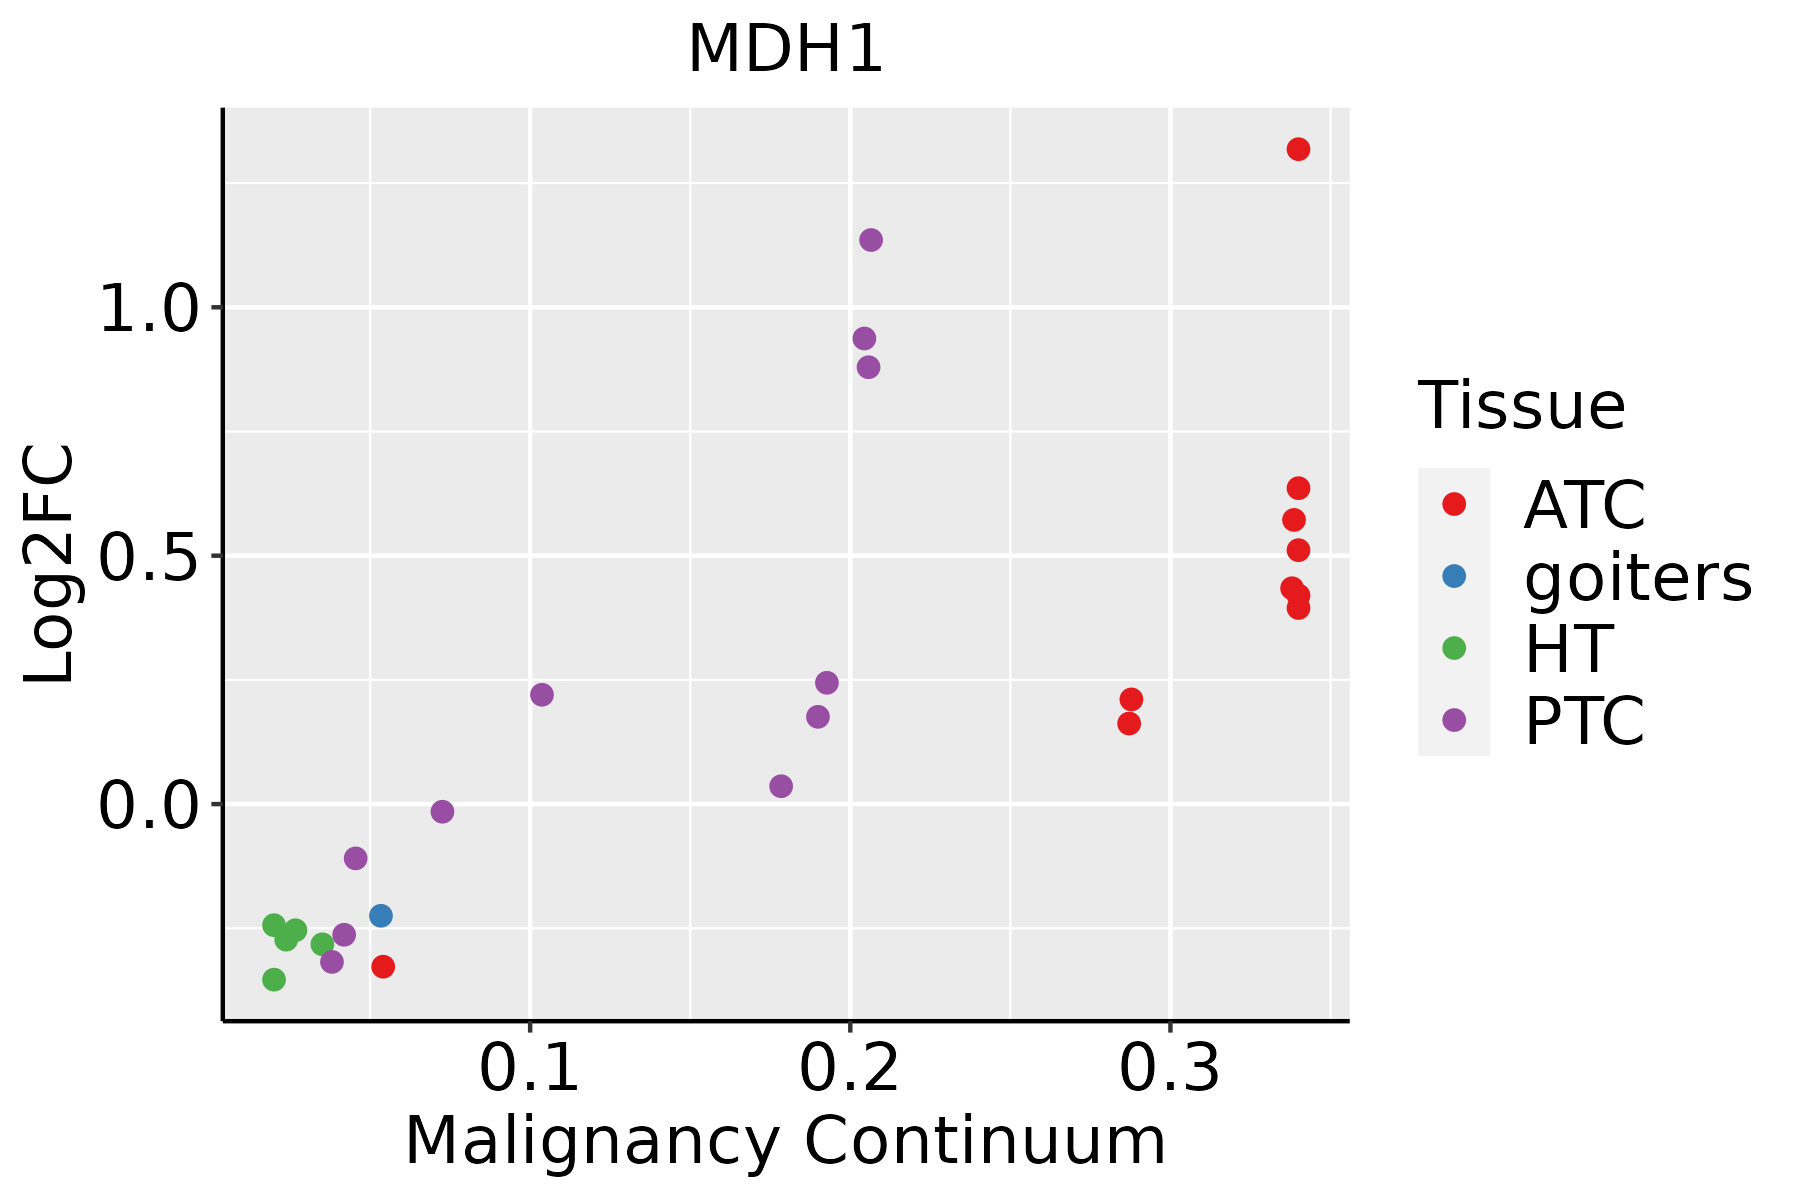 | ATC: Anaplastic thyroid cancer |
| HT: Hashimoto's thyroiditis | ||
| PTC: Papillary thyroid cancer |
| ∗log2FC in expression of this searched gene in stem-like cells from each diseased tissue sample relative to stem-like cells in normal samples in each tissue plotted against the malignancy continuum. Samples are colored based on if they are from different disease stage. |
Top |
Malignant transformation related pathway analysis |
| Find out the enriched GO biological processes and KEGG pathways involved in transition from healthy to precancer to cancer |
| Tissue | Disease Stage | Enriched GO biological Processes |
| Colorectum | AD |  |
| Colorectum | SER |  |
| Colorectum | MSS |  |
| Colorectum | MSI-H |  |
| Colorectum | FAP |  |
| ∗Top 15 enriched GO BP terms are showed in the bar plot of each disease state in each tissue. Each row represents a significant GO biological process which is colored according to the -log10(p.adjust). |
| Page: 1 2 3 4 5 6 7 8 9 |
| GO ID | Tissue | Disease Stage | Description | Gene Ratio | Bg Ratio | pvalue | p.adjust | Count |
| GO:00090608 | Breast | Precancer | aerobic respiration | 58/1080 | 189/18723 | 5.69e-27 | 7.62e-24 | 58 |
| GO:00060918 | Breast | Precancer | generation of precursor metabolites and energy | 94/1080 | 490/18723 | 1.54e-25 | 1.64e-22 | 94 |
| GO:00453338 | Breast | Precancer | cellular respiration | 59/1080 | 230/18723 | 5.97e-23 | 5.32e-20 | 59 |
| GO:00159808 | Breast | Precancer | energy derivation by oxidation of organic compounds | 70/1080 | 318/18723 | 8.33e-23 | 6.37e-20 | 70 |
| GO:00067345 | Breast | Precancer | NADH metabolic process | 6/1080 | 29/18723 | 5.49e-03 | 4.01e-02 | 6 |
| GO:000906013 | Breast | IDC | aerobic respiration | 61/1434 | 189/18723 | 4.42e-23 | 6.27e-20 | 61 |
| GO:000609113 | Breast | IDC | generation of precursor metabolites and energy | 103/1434 | 490/18723 | 1.53e-21 | 1.74e-18 | 103 |
| GO:004533313 | Breast | IDC | cellular respiration | 62/1434 | 230/18723 | 5.98e-19 | 4.25e-16 | 62 |
| GO:001598013 | Breast | IDC | energy derivation by oxidation of organic compounds | 73/1434 | 318/18723 | 8.70e-18 | 3.80e-15 | 73 |
| GO:000906023 | Breast | DCIS | aerobic respiration | 61/1390 | 189/18723 | 8.72e-24 | 1.23e-20 | 61 |
| GO:000609123 | Breast | DCIS | generation of precursor metabolites and energy | 103/1390 | 490/18723 | 1.46e-22 | 1.65e-19 | 103 |
| GO:004533323 | Breast | DCIS | cellular respiration | 62/1390 | 230/18723 | 1.26e-19 | 1.02e-16 | 62 |
| GO:001598023 | Breast | DCIS | energy derivation by oxidation of organic compounds | 73/1390 | 318/18723 | 1.56e-18 | 8.01e-16 | 73 |
| GO:0006091 | Colorectum | AD | generation of precursor metabolites and energy | 209/3918 | 490/18723 | 3.17e-28 | 6.61e-25 | 209 |
| GO:0009060 | Colorectum | AD | aerobic respiration | 108/3918 | 189/18723 | 9.14e-28 | 1.43e-24 | 108 |
| GO:0045333 | Colorectum | AD | cellular respiration | 119/3918 | 230/18723 | 3.21e-25 | 4.02e-22 | 119 |
| GO:0015980 | Colorectum | AD | energy derivation by oxidation of organic compounds | 143/3918 | 318/18723 | 2.78e-22 | 2.49e-19 | 143 |
| GO:0006099 | Colorectum | AD | tricarboxylic acid cycle | 19/3918 | 30/18723 | 5.82e-07 | 2.09e-05 | 19 |
| GO:0006734 | Colorectum | AD | NADH metabolic process | 16/3918 | 29/18723 | 5.32e-05 | 9.01e-04 | 16 |
| GO:0019674 | Colorectum | AD | NAD metabolic process | 15/3918 | 30/18723 | 3.85e-04 | 4.39e-03 | 15 |
| Page: 1 2 3 4 5 |
| Pathway ID | Tissue | Disease Stage | Description | Gene Ratio | Bg Ratio | pvalue | p.adjust | qvalue | Count |
| hsa0120012 | Breast | Precancer | Carbon metabolism | 18/684 | 115/8465 | 4.79e-03 | 2.75e-02 | 2.11e-02 | 18 |
| hsa0120013 | Breast | Precancer | Carbon metabolism | 18/684 | 115/8465 | 4.79e-03 | 2.75e-02 | 2.11e-02 | 18 |
| hsa01200 | Colorectum | AD | Carbon metabolism | 55/2092 | 115/8465 | 5.53e-08 | 8.42e-07 | 5.37e-07 | 55 |
| hsa00620 | Colorectum | AD | Pyruvate metabolism | 28/2092 | 47/8465 | 3.71e-07 | 5.41e-06 | 3.45e-06 | 28 |
| hsa00020 | Colorectum | AD | Citrate cycle (TCA cycle) | 20/2092 | 30/8465 | 1.43e-06 | 1.77e-05 | 1.13e-05 | 20 |
| hsa00630 | Colorectum | AD | Glyoxylate and dicarboxylate metabolism | 14/2092 | 30/8465 | 7.25e-03 | 2.97e-02 | 1.89e-02 | 14 |
| hsa04964 | Colorectum | AD | Proximal tubule bicarbonate reclamation | 11/2092 | 23/8465 | 1.35e-02 | 4.86e-02 | 3.10e-02 | 11 |
| hsa012001 | Colorectum | AD | Carbon metabolism | 55/2092 | 115/8465 | 5.53e-08 | 8.42e-07 | 5.37e-07 | 55 |
| hsa006201 | Colorectum | AD | Pyruvate metabolism | 28/2092 | 47/8465 | 3.71e-07 | 5.41e-06 | 3.45e-06 | 28 |
| hsa000201 | Colorectum | AD | Citrate cycle (TCA cycle) | 20/2092 | 30/8465 | 1.43e-06 | 1.77e-05 | 1.13e-05 | 20 |
| hsa006301 | Colorectum | AD | Glyoxylate and dicarboxylate metabolism | 14/2092 | 30/8465 | 7.25e-03 | 2.97e-02 | 1.89e-02 | 14 |
| hsa049641 | Colorectum | AD | Proximal tubule bicarbonate reclamation | 11/2092 | 23/8465 | 1.35e-02 | 4.86e-02 | 3.10e-02 | 11 |
| hsa006202 | Colorectum | SER | Pyruvate metabolism | 22/1580 | 47/8465 | 9.62e-06 | 1.33e-04 | 9.67e-05 | 22 |
| hsa000202 | Colorectum | SER | Citrate cycle (TCA cycle) | 16/1580 | 30/8465 | 2.06e-05 | 2.74e-04 | 1.99e-04 | 16 |
| hsa012002 | Colorectum | SER | Carbon metabolism | 40/1580 | 115/8465 | 2.77e-05 | 3.41e-04 | 2.47e-04 | 40 |
| hsa049642 | Colorectum | SER | Proximal tubule bicarbonate reclamation | 10/1580 | 23/8465 | 5.33e-03 | 3.28e-02 | 2.38e-02 | 10 |
| hsa006203 | Colorectum | SER | Pyruvate metabolism | 22/1580 | 47/8465 | 9.62e-06 | 1.33e-04 | 9.67e-05 | 22 |
| hsa000203 | Colorectum | SER | Citrate cycle (TCA cycle) | 16/1580 | 30/8465 | 2.06e-05 | 2.74e-04 | 1.99e-04 | 16 |
| hsa012003 | Colorectum | SER | Carbon metabolism | 40/1580 | 115/8465 | 2.77e-05 | 3.41e-04 | 2.47e-04 | 40 |
| hsa049643 | Colorectum | SER | Proximal tubule bicarbonate reclamation | 10/1580 | 23/8465 | 5.33e-03 | 3.28e-02 | 2.38e-02 | 10 |
| Page: 1 2 3 4 |
Top |
Cell-cell communication analysis |
| Identification of potential cell-cell interactions between two cell types and their ligand-receptor pairs for different disease states |
| Ligand | Receptor | LRpair | Pathway | Tissue | Disease Stage |
| Page: 1 |
Top |
Single-cell gene regulatory network inference analysis |
| Find out the significant the regulons (TFs) and the target genes of each regulon across cell types for different disease states |
| TF | Cell Type | Tissue | Disease Stage | Target Gene | RSS | Regulon Activity |
| ∗The dot plots of a searched regulon are shown for all cell subpopulations in each disease state of each tissue based on the regulon specific score inferred using pySCENIC and by calculating the average expression. |
| Page: 1 |
Top |
Somatic mutation of malignant transformation related genes |
| Annotation of somatic variants for genes involved in malignant transformation |
| Hugo Symbol | Variant Class | Variant Classification | dbSNP RS | HGVSc | HGVSp | HGVSp Short | SWISSPROT | BIOTYPE | SIFT | PolyPhen | Tumor Sample Barcode | Tissue | Histology | Sex | Age | Stage | Therapy Types | Drugs | Outcome |
| MDH1 | SNV | Missense_Mutation | novel | c.607N>A | p.Gly203Arg | p.G203R | P40925 | protein_coding | deleterious(0) | probably_damaging(1) | TCGA-EA-A410-01 | Cervix | cervical & endocervical cancer | Female | <65 | I/II | Unknown | Unknown | SD |
| MDH1 | SNV | Missense_Mutation | novel | c.955N>A | p.Glu319Lys | p.E319K | P40925 | protein_coding | tolerated(0.15) | benign(0.009) | TCGA-VS-A958-01 | Cervix | cervical & endocervical cancer | Female | <65 | I/II | Chemotherapy | cisplatin | CR |
| MDH1 | deletion | Frame_Shift_Del | novel | c.853delN | p.Val285CysfsTer25 | p.V285Cfs*25 | P40925 | protein_coding | TCGA-IR-A3LH-01 | Cervix | cervical & endocervical cancer | Female | <65 | I/II | Chemotherapy | cisplatin | CR | ||
| MDH1 | SNV | Missense_Mutation | novel | c.788N>A | p.Ser263Tyr | p.S263Y | P40925 | protein_coding | deleterious(0) | probably_damaging(1) | TCGA-AZ-4315-01 | Colorectum | colon adenocarcinoma | Male | <65 | I/II | Unknown | Unknown | SD |
| MDH1 | SNV | Missense_Mutation | novel | c.1034N>A | p.Ala345Asp | p.A345D | P40925 | protein_coding | deleterious(0) | probably_damaging(0.987) | TCGA-CA-6717-01 | Colorectum | colon adenocarcinoma | Male | <65 | I/II | Chemotherapy | oxaliplatin | CR |
| MDH1 | SNV | Missense_Mutation | c.557C>T | p.Ala186Val | p.A186V | P40925 | protein_coding | deleterious(0.02) | benign(0.242) | TCGA-F4-6703-01 | Colorectum | colon adenocarcinoma | Male | <65 | I/II | Unknown | Unknown | SD | |
| MDH1 | SNV | Missense_Mutation | c.817N>G | p.Arg273Gly | p.R273G | P40925 | protein_coding | deleterious(0) | benign(0.296) | TCGA-G4-6302-01 | Colorectum | colon adenocarcinoma | Female | >=65 | I/II | Unknown | Unknown | SD | |
| MDH1 | SNV | Missense_Mutation | novel | c.501N>T | p.Lys167Asn | p.K167N | P40925 | protein_coding | tolerated(0.16) | possibly_damaging(0.787) | TCGA-AP-A1DK-01 | Endometrium | uterine corpus endometrioid carcinoma | Female | <65 | I/II | Unknown | Unknown | SD |
| MDH1 | SNV | Missense_Mutation | novel | c.565N>T | p.Leu189Phe | p.L189F | P40925 | protein_coding | tolerated(0.06) | possibly_damaging(0.636) | TCGA-AX-A05Z-01 | Endometrium | uterine corpus endometrioid carcinoma | Female | <65 | III/IV | Chemotherapy | adriamycin | SD |
| MDH1 | SNV | Missense_Mutation | novel | c.794C>A | p.Ala265Glu | p.A265E | P40925 | protein_coding | deleterious(0) | probably_damaging(1) | TCGA-AX-A2HC-01 | Endometrium | uterine corpus endometrioid carcinoma | Female | <65 | III/IV | Chemotherapy | paclitaxel | PD |
| Page: 1 2 3 4 |
Top |
Related drugs of malignant transformation related genes |
| Identification of chemicals and drugs interact with genes involved in malignant transfromation |
| (DGIdb 4.0) |
| Entrez ID | Symbol | Category | Interaction Types | Drug Claim Name | Drug Name | PMIDs |
| Page: 1 |

Copyright 2023-Present -The University of Texas Health Science Center at Houston |