
|
|||||
|
 | |
| |
| |
| |
| |
| |
|
Gene: MDFIC |
Gene summary for MDFIC |
| Gene information | Species | Human | Gene symbol | MDFIC | Gene ID | 29969 |
| Gene name | MyoD family inhibitor domain containing | |
| Gene Alias | HIC | |
| Cytomap | 7q31.1-q31.2 | |
| Gene Type | protein-coding | GO ID | GO:0000165 | UniProtAcc | Q9P1T7 |
Top |
Malignant transformation analysis |
| Identification of the aberrant gene expression in precancerous and cancerous lesions by comparing the gene expression of stem-like cells in diseased tissues with normal stem cells |
| Entrez ID | Symbol | Replicates | Species | Organ | Tissue | Adj P-value | Log2FC | Malignancy |
| 29969 | MDFIC | HCC2_Meng | Human | Liver | HCC | 5.64e-27 | 1.33e-01 | 0.0107 |
| 29969 | MDFIC | HCC1 | Human | Liver | HCC | 6.87e-06 | 3.16e+00 | 0.5336 |
| 29969 | MDFIC | HCC2 | Human | Liver | HCC | 5.47e-13 | 1.51e+00 | 0.5341 |
| 29969 | MDFIC | HCC5 | Human | Liver | HCC | 4.08e-07 | 1.22e+00 | 0.4932 |
| 29969 | MDFIC | S027 | Human | Liver | HCC | 3.97e-12 | 1.25e+00 | 0.2446 |
| 29969 | MDFIC | S028 | Human | Liver | HCC | 3.74e-28 | 1.38e+00 | 0.2503 |
| 29969 | MDFIC | S029 | Human | Liver | HCC | 1.15e-14 | 9.90e-01 | 0.2581 |
| 29969 | MDFIC | RNA-P3T-P3T-1 | Human | Lung | IAC | 3.42e-03 | 3.14e-01 | 0.1829 |
| 29969 | MDFIC | RNA-P3T-P3T-2 | Human | Lung | IAC | 7.41e-05 | 5.26e-01 | 0.1835 |
| 29969 | MDFIC | RNA-P6T2-P6T2-1 | Human | Lung | IAC | 1.26e-09 | 3.38e-01 | -0.0166 |
| 29969 | MDFIC | RNA-P6T2-P6T2-2 | Human | Lung | IAC | 1.30e-12 | 4.89e-01 | -0.0132 |
| 29969 | MDFIC | RNA-P6T2-P6T2-3 | Human | Lung | IAC | 7.12e-15 | 3.75e-01 | -0.013 |
| 29969 | MDFIC | RNA-P6T2-P6T2-4 | Human | Lung | IAC | 3.90e-10 | 4.62e-01 | -0.0121 |
| 29969 | MDFIC | RNA-P7T1-P7T1-1 | Human | Lung | AIS | 2.65e-02 | 6.18e-01 | -0.0961 |
| 29969 | MDFIC | RNA-P7T1-P7T1-2 | Human | Lung | AIS | 3.95e-04 | 7.00e-01 | -0.0876 |
| 29969 | MDFIC | RNA-P7T1-P7T1-4 | Human | Lung | AIS | 1.29e-02 | 5.82e-01 | -0.0809 |
| 29969 | MDFIC | male-WTA | Human | Thyroid | PTC | 2.57e-35 | 2.76e-01 | 0.1037 |
| 29969 | MDFIC | PTC01 | Human | Thyroid | PTC | 5.20e-09 | 1.16e-01 | 0.1899 |
| 29969 | MDFIC | PTC04 | Human | Thyroid | PTC | 1.77e-10 | 1.93e-01 | 0.1927 |
| 29969 | MDFIC | PTC05 | Human | Thyroid | PTC | 3.48e-22 | 1.05e+00 | 0.2065 |
| Page: 1 2 |
| Tissue | Expression Dynamics | Abbreviation |
| Liver |  | HCC: Hepatocellular carcinoma |
| NAFLD: Non-alcoholic fatty liver disease | ||
| Lung | 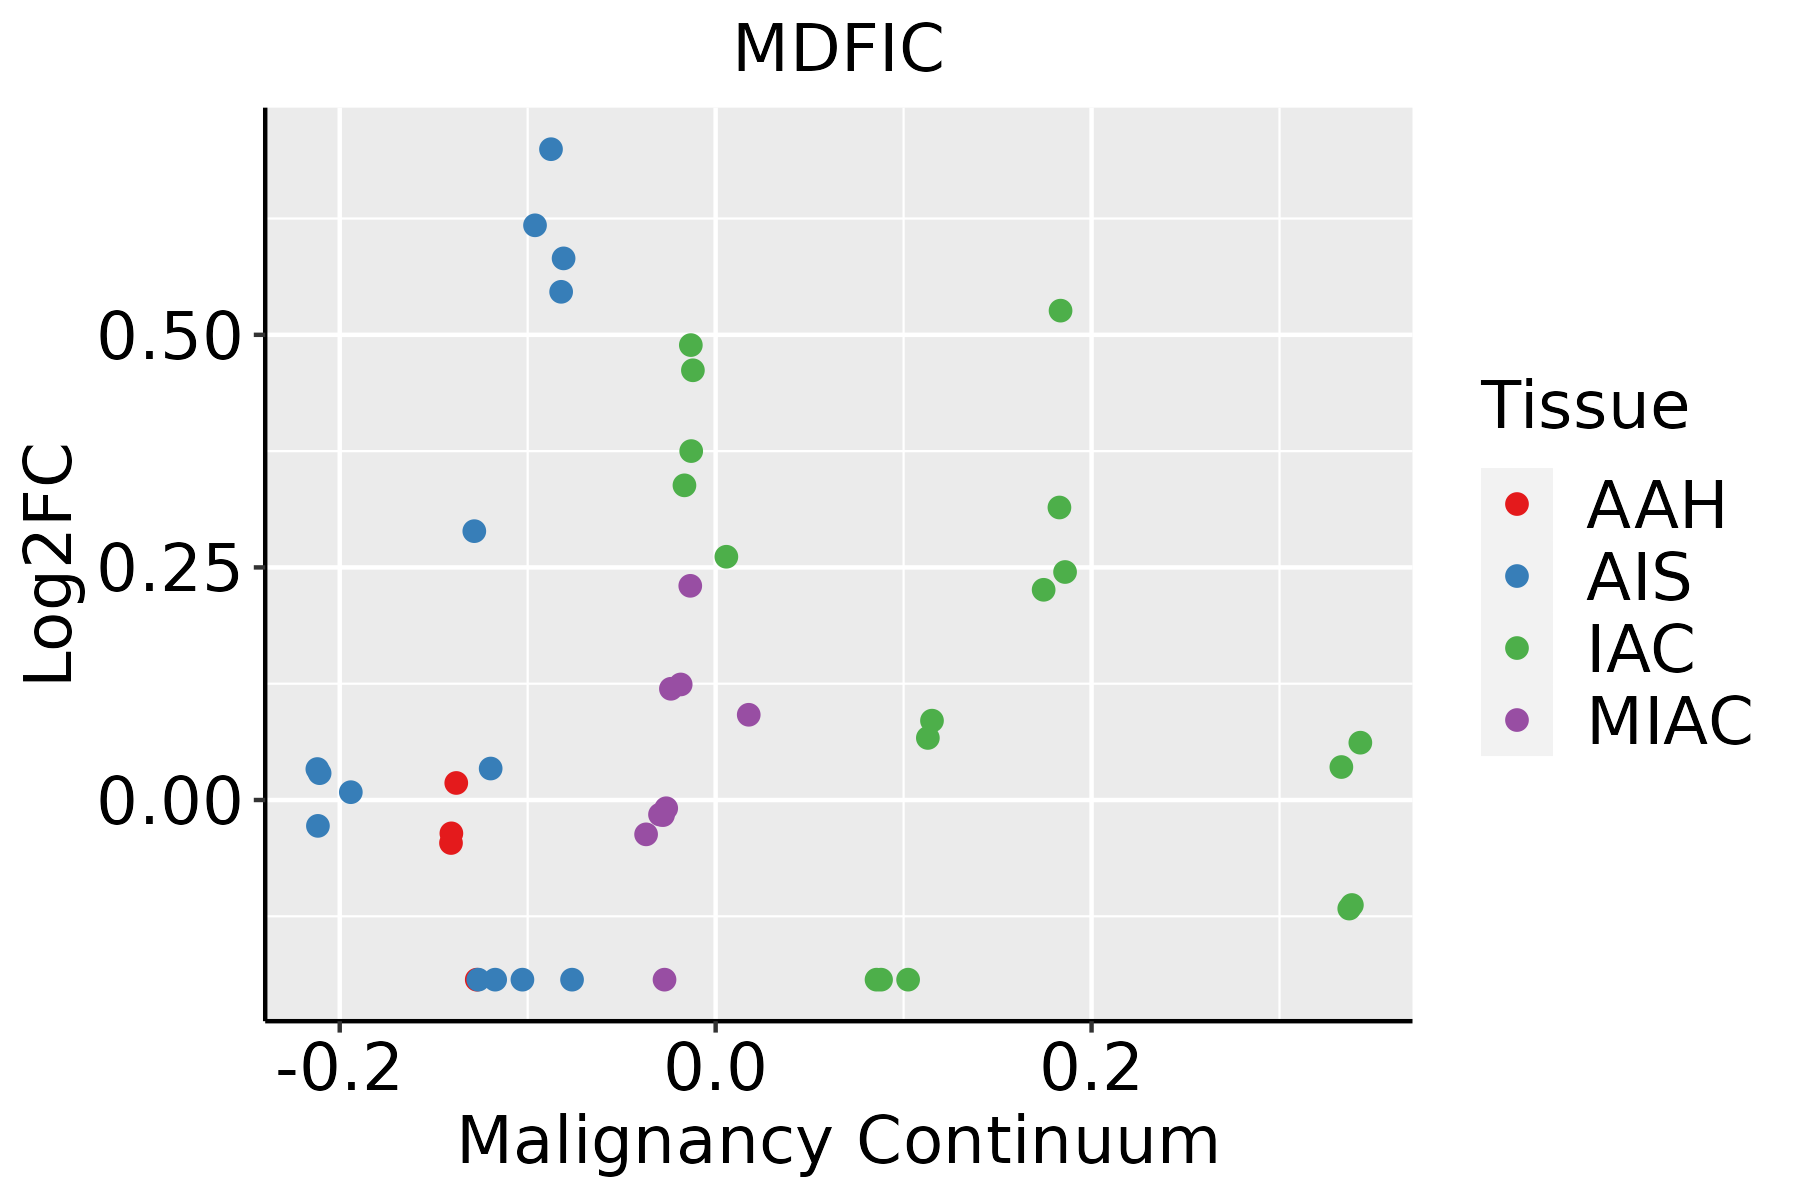 | AAH: Atypical adenomatous hyperplasia |
| AIS: Adenocarcinoma in situ | ||
| IAC: Invasive lung adenocarcinoma | ||
| MIA: Minimally invasive adenocarcinoma | ||
| Thyroid | 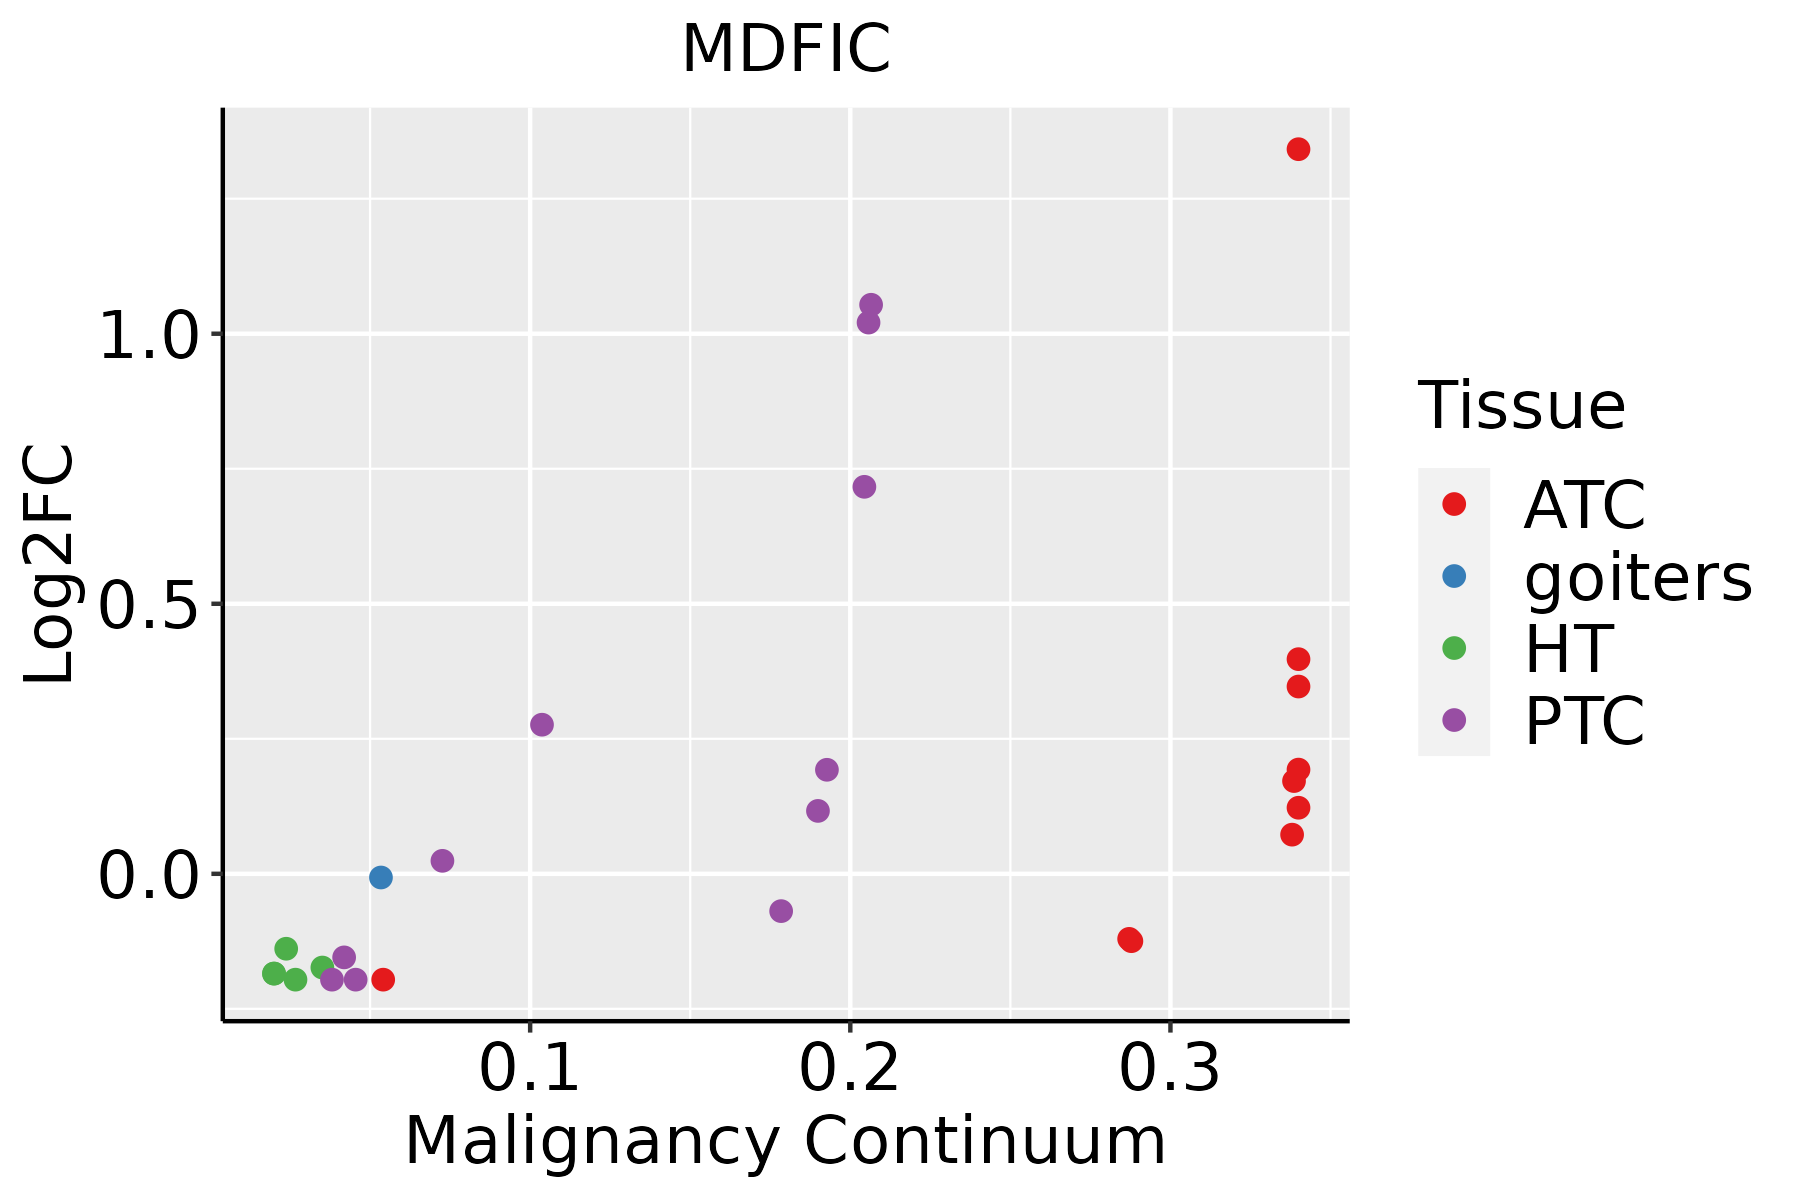 | ATC: Anaplastic thyroid cancer |
| HT: Hashimoto's thyroiditis | ||
| PTC: Papillary thyroid cancer |
| ∗log2FC in expression of this searched gene in stem-like cells from each diseased tissue sample relative to stem-like cells in normal samples in each tissue plotted against the malignancy continuum. Samples are colored based on if they are from different disease stage. |
Top |
Malignant transformation related pathway analysis |
| Find out the enriched GO biological processes and KEGG pathways involved in transition from healthy to precancer to cancer |
| Tissue | Disease Stage | Enriched GO biological Processes |
| Colorectum | AD |  |
| Colorectum | SER |  |
| Colorectum | MSS |  |
| Colorectum | MSI-H |  |
| Colorectum | FAP |  |
| ∗Top 15 enriched GO BP terms are showed in the bar plot of each disease state in each tissue. Each row represents a significant GO biological process which is colored according to the -log10(p.adjust). |
| Page: 1 2 3 4 5 6 7 8 9 |
| GO ID | Tissue | Disease Stage | Description | Gene Ratio | Bg Ratio | pvalue | p.adjust | Count |
| GO:007259422 | Liver | HCC | establishment of protein localization to organelle | 299/7958 | 422/18723 | 1.06e-32 | 6.10e-30 | 299 |
| GO:001603222 | Liver | HCC | viral process | 286/7958 | 415/18723 | 4.41e-28 | 1.86e-25 | 286 |
| GO:003238621 | Liver | HCC | regulation of intracellular transport | 231/7958 | 337/18723 | 1.99e-22 | 3.40e-20 | 231 |
| GO:000691322 | Liver | HCC | nucleocytoplasmic transport | 208/7958 | 301/18723 | 5.51e-21 | 8.12e-19 | 208 |
| GO:005116922 | Liver | HCC | nuclear transport | 208/7958 | 301/18723 | 5.51e-21 | 8.12e-19 | 208 |
| GO:003315721 | Liver | HCC | regulation of intracellular protein transport | 165/7958 | 229/18723 | 8.37e-20 | 1.15e-17 | 165 |
| GO:003450421 | Liver | HCC | protein localization to nucleus | 194/7958 | 290/18723 | 2.84e-17 | 2.85e-15 | 194 |
| GO:001908021 | Liver | HCC | viral gene expression | 77/7958 | 94/18723 | 4.33e-15 | 3.12e-13 | 77 |
| GO:001703811 | Liver | HCC | protein import | 140/7958 | 206/18723 | 1.12e-13 | 6.46e-12 | 140 |
| GO:004682221 | Liver | HCC | regulation of nucleocytoplasmic transport | 81/7958 | 106/18723 | 1.11e-12 | 5.52e-11 | 81 |
| GO:190018012 | Liver | HCC | regulation of protein localization to nucleus | 95/7958 | 136/18723 | 9.26e-11 | 3.26e-09 | 95 |
| GO:005079212 | Liver | HCC | regulation of viral process | 109/7958 | 164/18723 | 4.52e-10 | 1.45e-08 | 109 |
| GO:004852411 | Liver | HCC | positive regulation of viral process | 52/7958 | 65/18723 | 6.70e-10 | 2.11e-08 | 52 |
| GO:019873821 | Liver | HCC | cell-cell signaling by wnt | 247/7958 | 446/18723 | 2.11e-08 | 4.96e-07 | 247 |
| GO:005117011 | Liver | HCC | import into nucleus | 102/7958 | 159/18723 | 2.78e-08 | 6.39e-07 | 102 |
| GO:001605521 | Liver | HCC | Wnt signaling pathway | 245/7958 | 444/18723 | 3.68e-08 | 8.09e-07 | 245 |
| GO:00066066 | Liver | HCC | protein import into nucleus | 99/7958 | 155/18723 | 6.12e-08 | 1.28e-06 | 99 |
| GO:00190831 | Liver | HCC | viral transcription | 40/7958 | 50/18723 | 6.50e-08 | 1.35e-06 | 40 |
| GO:190458911 | Liver | HCC | regulation of protein import | 46/7958 | 63/18723 | 8.72e-07 | 1.33e-05 | 46 |
| GO:003011121 | Liver | HCC | regulation of Wnt signaling pathway | 180/7958 | 328/18723 | 3.62e-06 | 4.72e-05 | 180 |
| Page: 1 2 3 4 5 6 7 |
| Pathway ID | Tissue | Disease Stage | Description | Gene Ratio | Bg Ratio | pvalue | p.adjust | qvalue | Count |
| Page: 1 |
Top |
Cell-cell communication analysis |
| Identification of potential cell-cell interactions between two cell types and their ligand-receptor pairs for different disease states |
| Ligand | Receptor | LRpair | Pathway | Tissue | Disease Stage |
| Page: 1 |
Top |
Single-cell gene regulatory network inference analysis |
| Find out the significant the regulons (TFs) and the target genes of each regulon across cell types for different disease states |
| TF | Cell Type | Tissue | Disease Stage | Target Gene | RSS | Regulon Activity |
| ∗The dot plots of a searched regulon are shown for all cell subpopulations in each disease state of each tissue based on the regulon specific score inferred using pySCENIC and by calculating the average expression. |
| Page: 1 |
Top |
Somatic mutation of malignant transformation related genes |
| Annotation of somatic variants for genes involved in malignant transformation |
| Hugo Symbol | Variant Class | Variant Classification | dbSNP RS | HGVSc | HGVSp | HGVSp Short | SWISSPROT | BIOTYPE | SIFT | PolyPhen | Tumor Sample Barcode | Tissue | Histology | Sex | Age | Stage | Therapy Types | Drugs | Outcome |
| MDFIC | insertion | Frame_Shift_Ins | novel | c.614_615insA | p.Asn207GlufsTer23 | p.N207Efs*23 | protein_coding | TCGA-E9-A22H-01 | Breast | breast invasive carcinoma | Female | <65 | I/II | Chemotherapy | doxorubicin | SD | |||
| MDFIC | SNV | Missense_Mutation | novel | c.599A>C | p.Glu200Ala | p.E200A | protein_coding | deleterious(0.04) | benign(0.32) | TCGA-C5-A7UE-01 | Cervix | cervical & endocervical cancer | Female | <65 | I/II | Chemotherapy | cisplatin | SD | |
| MDFIC | SNV | Missense_Mutation | rs749315964 | c.1064N>T | p.Ser355Leu | p.S355L | protein_coding | deleterious(0) | probably_damaging(0.938) | TCGA-JW-A5VL-01 | Cervix | cervical & endocervical cancer | Female | <65 | I/II | Unknown | Unknown | SD | |
| MDFIC | SNV | Missense_Mutation | c.983N>T | p.Asp328Val | p.D328V | protein_coding | deleterious(0) | probably_damaging(0.997) | TCGA-AA-3715-01 | Colorectum | colon adenocarcinoma | Male | >=65 | I/II | Unknown | Unknown | PD | ||
| MDFIC | SNV | Missense_Mutation | novel | c.292C>T | p.Arg98Trp | p.R98W | protein_coding | deleterious_low_confidence(0) | possibly_damaging(0.738) | TCGA-AZ-6601-01 | Colorectum | colon adenocarcinoma | Male | >=65 | I/II | Unknown | Unknown | PD | |
| MDFIC | SNV | Missense_Mutation | c.521N>A | p.Pro174His | p.P174H | protein_coding | tolerated_low_confidence(0.59) | benign(0.012) | TCGA-CM-4743-01 | Colorectum | colon adenocarcinoma | Male | >=65 | I/II | Chemotherapy | capecitabine | SD | ||
| MDFIC | SNV | Missense_Mutation | c.650N>A | p.Gly217Glu | p.G217E | protein_coding | deleterious(0) | probably_damaging(0.999) | TCGA-CM-4746-01 | Colorectum | colon adenocarcinoma | Male | <65 | I/II | Unknown | Unknown | SD | ||
| MDFIC | SNV | Missense_Mutation | novel | c.181N>G | p.Arg61Gly | p.R61G | protein_coding | deleterious_low_confidence(0) | possibly_damaging(0.765) | TCGA-AF-6672-01 | Colorectum | rectum adenocarcinoma | Male | <65 | III/IV | Ancillary | leucovorin | PD | |
| MDFIC | SNV | Missense_Mutation | c.664N>A | p.Ala222Thr | p.A222T | protein_coding | tolerated(0.15) | benign(0.051) | TCGA-AG-3892-01 | Colorectum | rectum adenocarcinoma | Female | <65 | I/II | Unknown | Unknown | SD | ||
| MDFIC | SNV | Missense_Mutation | rs764638487 | c.698N>T | p.Ser233Leu | p.S233L | protein_coding | deleterious(0) | probably_damaging(0.969) | TCGA-CI-6624-01 | Colorectum | rectum adenocarcinoma | Female | <65 | I/II | Unknown | Unknown | SD |
| Page: 1 2 3 4 |
Top |
Related drugs of malignant transformation related genes |
| Identification of chemicals and drugs interact with genes involved in malignant transfromation |
| (DGIdb 4.0) |
| Entrez ID | Symbol | Category | Interaction Types | Drug Claim Name | Drug Name | PMIDs |
| Page: 1 |

Copyright 2023-Present -The University of Texas Health Science Center at Houston |