
|
|||||
|
 | |
| |
| |
| |
| |
| |
|
Gene: MDC1 |
Gene summary for MDC1 |
| Gene information | Species | Human | Gene symbol | MDC1 | Gene ID | 9656 |
| Gene name | mediator of DNA damage checkpoint 1 | |
| Gene Alias | NFBD1 | |
| Cytomap | 6p21.33 | |
| Gene Type | protein-coding | GO ID | GO:0000075 | UniProtAcc | A0A1U9XBC1 |
Top |
Malignant transformation analysis |
| Identification of the aberrant gene expression in precancerous and cancerous lesions by comparing the gene expression of stem-like cells in diseased tissues with normal stem cells |
| Entrez ID | Symbol | Replicates | Species | Organ | Tissue | Adj P-value | Log2FC | Malignancy |
| 9656 | MDC1 | HCC1_Meng | Human | Liver | HCC | 9.91e-19 | -2.96e-03 | 0.0246 |
| 9656 | MDC1 | HCC1 | Human | Liver | HCC | 3.68e-03 | 3.58e+00 | 0.5336 |
| 9656 | MDC1 | S014 | Human | Liver | HCC | 1.62e-06 | 4.73e-01 | 0.2254 |
| 9656 | MDC1 | S027 | Human | Liver | HCC | 8.35e-04 | 6.32e-01 | 0.2446 |
| 9656 | MDC1 | S028 | Human | Liver | HCC | 5.66e-13 | 6.26e-01 | 0.2503 |
| 9656 | MDC1 | S029 | Human | Liver | HCC | 9.41e-06 | 3.66e-01 | 0.2581 |
| Page: 1 |
| Tissue | Expression Dynamics | Abbreviation |
| Liver | 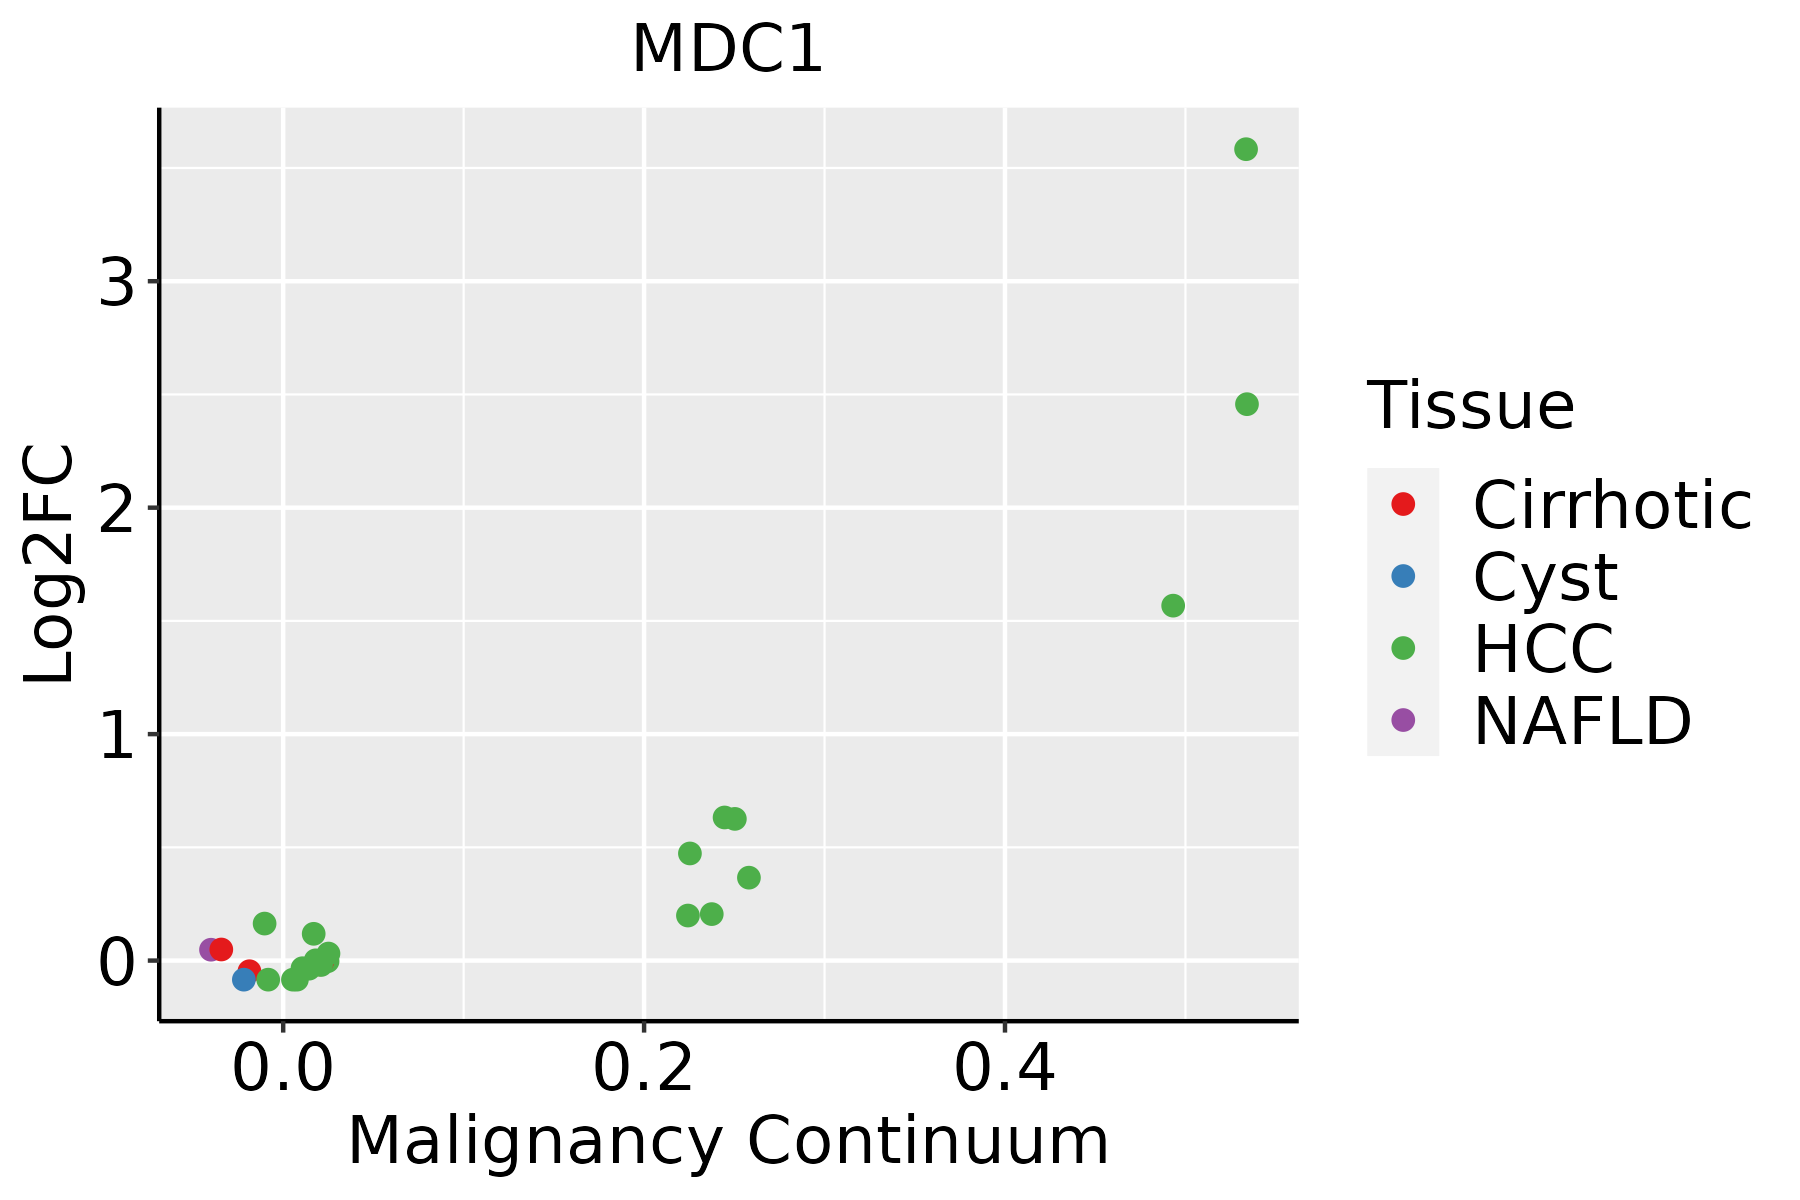 | HCC: Hepatocellular carcinoma |
| NAFLD: Non-alcoholic fatty liver disease |
| ∗log2FC in expression of this searched gene in stem-like cells from each diseased tissue sample relative to stem-like cells in normal samples in each tissue plotted against the malignancy continuum. Samples are colored based on if they are from different disease stage. |
Top |
Malignant transformation related pathway analysis |
| Find out the enriched GO biological processes and KEGG pathways involved in transition from healthy to precancer to cancer |
| Tissue | Disease Stage | Enriched GO biological Processes |
| Colorectum | AD |  |
| Colorectum | SER |  |
| Colorectum | MSS |  |
| Colorectum | MSI-H |  |
| Colorectum | FAP |  |
| ∗Top 15 enriched GO BP terms are showed in the bar plot of each disease state in each tissue. Each row represents a significant GO biological process which is colored according to the -log10(p.adjust). |
| Page: 1 2 3 4 5 6 7 8 9 |
| GO ID | Tissue | Disease Stage | Description | Gene Ratio | Bg Ratio | pvalue | p.adjust | Count |
| GO:000734611 | Liver | HCC | regulation of mitotic cell cycle | 255/7958 | 457/18723 | 4.96e-09 | 1.30e-07 | 255 |
| GO:19019871 | Liver | HCC | regulation of cell cycle phase transition | 211/7958 | 390/18723 | 2.11e-06 | 2.89e-05 | 211 |
| GO:00427702 | Liver | HCC | signal transduction in response to DNA damage | 103/7958 | 172/18723 | 3.05e-06 | 4.04e-05 | 103 |
| GO:00000751 | Liver | HCC | cell cycle checkpoint | 100/7958 | 169/18723 | 8.75e-06 | 1.02e-04 | 100 |
| GO:0045786 | Liver | HCC | negative regulation of cell cycle | 204/7958 | 385/18723 | 1.84e-05 | 1.99e-04 | 204 |
| GO:0045930 | Liver | HCC | negative regulation of mitotic cell cycle | 130/7958 | 235/18723 | 4.69e-05 | 4.50e-04 | 130 |
| GO:0007093 | Liver | HCC | mitotic cell cycle checkpoint | 77/7958 | 129/18723 | 6.00e-05 | 5.50e-04 | 77 |
| GO:00000771 | Liver | HCC | DNA damage checkpoint | 68/7958 | 115/18723 | 2.33e-04 | 1.77e-03 | 68 |
| GO:0031570 | Liver | HCC | DNA integrity checkpoint | 71/7958 | 123/18723 | 4.64e-04 | 3.08e-03 | 71 |
| GO:1901988 | Liver | HCC | negative regulation of cell cycle phase transition | 132/7958 | 249/18723 | 4.97e-04 | 3.25e-03 | 132 |
| GO:0010948 | Liver | HCC | negative regulation of cell cycle process | 152/7958 | 294/18723 | 8.50e-04 | 5.08e-03 | 152 |
| GO:0044773 | Liver | HCC | mitotic DNA damage checkpoint | 48/7958 | 81/18723 | 1.72e-03 | 8.96e-03 | 48 |
| GO:0044774 | Liver | HCC | mitotic DNA integrity checkpoint | 49/7958 | 85/18723 | 3.44e-03 | 1.55e-02 | 49 |
| Page: 1 |
| Pathway ID | Tissue | Disease Stage | Description | Gene Ratio | Bg Ratio | pvalue | p.adjust | qvalue | Count |
| Page: 1 |
Top |
Cell-cell communication analysis |
| Identification of potential cell-cell interactions between two cell types and their ligand-receptor pairs for different disease states |
| Ligand | Receptor | LRpair | Pathway | Tissue | Disease Stage |
| Page: 1 |
Top |
Single-cell gene regulatory network inference analysis |
| Find out the significant the regulons (TFs) and the target genes of each regulon across cell types for different disease states |
| TF | Cell Type | Tissue | Disease Stage | Target Gene | RSS | Regulon Activity |
| ∗The dot plots of a searched regulon are shown for all cell subpopulations in each disease state of each tissue based on the regulon specific score inferred using pySCENIC and by calculating the average expression. |
| Page: 1 |
Top |
Somatic mutation of malignant transformation related genes |
| Annotation of somatic variants for genes involved in malignant transformation |
| Hugo Symbol | Variant Class | Variant Classification | dbSNP RS | HGVSc | HGVSp | HGVSp Short | SWISSPROT | BIOTYPE | SIFT | PolyPhen | Tumor Sample Barcode | Tissue | Histology | Sex | Age | Stage | Therapy Types | Drugs | Outcome |
| MDC1 | SNV | Missense_Mutation | c.1994N>A | p.Gly665Glu | p.G665E | Q14676 | protein_coding | tolerated(0.07) | probably_damaging(0.999) | TCGA-A2-A0CX-01 | Breast | breast invasive carcinoma | Female | <65 | I/II | Chemotherapy | adriamycin | SD | |
| MDC1 | SNV | Missense_Mutation | c.4405N>T | p.Pro1469Ser | p.P1469S | Q14676 | protein_coding | tolerated(0.06) | possibly_damaging(0.782) | TCGA-AN-A0AK-01 | Breast | breast invasive carcinoma | Female | >=65 | I/II | Unknown | Unknown | SD | |
| MDC1 | SNV | Missense_Mutation | novel | c.3787N>C | p.Glu1263Gln | p.E1263Q | Q14676 | protein_coding | tolerated(0.09) | benign(0.291) | TCGA-AR-A2LE-01 | Breast | breast invasive carcinoma | Female | >=65 | I/II | Hormone Therapy | tamoxiphen | PD |
| MDC1 | SNV | Missense_Mutation | novel | c.3970A>C | p.Thr1324Pro | p.T1324P | Q14676 | protein_coding | tolerated(1) | benign(0) | TCGA-C8-A12X-01 | Breast | breast invasive carcinoma | Female | <65 | I/II | Unknown | Unknown | SD |
| MDC1 | SNV | Missense_Mutation | c.3676N>G | p.Gln1226Glu | p.Q1226E | Q14676 | protein_coding | tolerated(0.12) | benign(0.037) | TCGA-E2-A1LG-01 | Breast | breast invasive carcinoma | Female | <65 | I/II | Chemotherapy | doxorubicin | SD | |
| MDC1 | SNV | Missense_Mutation | c.4978C>T | p.Leu1660Phe | p.L1660F | Q14676 | protein_coding | tolerated(0.28) | benign(0.077) | TCGA-E9-A1RC-01 | Breast | breast invasive carcinoma | Female | <65 | III/IV | Hormone Therapy | tamoxiphen | SD | |
| MDC1 | SNV | Missense_Mutation | novel | c.1997N>T | p.Ala666Val | p.A666V | Q14676 | protein_coding | deleterious(0.03) | benign(0.223) | TCGA-UU-A93S-01 | Breast | breast invasive carcinoma | Female | <65 | III/IV | Unknown | Unknown | PD |
| MDC1 | SNV | Missense_Mutation | rs763451532 | c.5636G>A | p.Arg1879His | p.R1879H | Q14676 | protein_coding | deleterious(0.03) | probably_damaging(0.983) | TCGA-2W-A8YY-01 | Cervix | cervical & endocervical cancer | Female | <65 | I/II | Chemotherapy | cisplatin | CR |
| MDC1 | SNV | Missense_Mutation | rs762832250 | c.4783N>T | p.Arg1595Trp | p.R1595W | Q14676 | protein_coding | tolerated(0.14) | benign(0.011) | TCGA-DS-A1OB-01 | Cervix | cervical & endocervical cancer | Female | <65 | I/II | Chemotherapy | carboplatin | PD |
| MDC1 | SNV | Missense_Mutation | novel | c.1213N>T | p.Asp405Tyr | p.D405Y | Q14676 | protein_coding | deleterious(0) | probably_damaging(0.998) | TCGA-EA-A3HS-01 | Cervix | cervical & endocervical cancer | Female | <65 | I/II | Unknown | Unknown | SD |
| Page: 1 2 3 4 5 6 7 8 9 10 11 12 13 14 15 16 17 18 19 20 |
Top |
Related drugs of malignant transformation related genes |
| Identification of chemicals and drugs interact with genes involved in malignant transfromation |
| (DGIdb 4.0) |
| Entrez ID | Symbol | Category | Interaction Types | Drug Claim Name | Drug Name | PMIDs |
| Page: 1 |

Copyright 2023-Present -The University of Texas Health Science Center at Houston |