Schematic overview of the cellular and molecular mechanisms involved in the cancer progression, including the proposed cellular and molecular mechanisms in cancer cells trajectory. AT1: alveolar type 1 cells; AT2: alveolar type 2 cells; AAH: atypical adenomatous hyperplasia; AIS: adenocarcinoma in situ; MIA: minimally invasive adenocarcinoma; IA: invasive adenocarcinoma; EMT: epithelial-mesenchymal transition

Home

Download

Statistics

Help

Contact

Center for Computational Systems Medicine
leaf

Gene summary

leaf

Malignant transformation analysis

leaf

Malignant transformation related pathway analysis

leaf

Cell-cell communication analysis

leaf

Single-cell gene regulatory network inference analysis

leaf

Somatic mutation of malignant transformation related genes

leaf

Related drugs of malignant transformation related genes

Gene: MCUR1

Gene summary for MCUR1

check button Gene summary.

Gene informationSpeciesHuman
Gene symbol

MCUR1

Gene ID

63933

Gene namemitochondrial calcium uniporter regulator 1
Gene AliasC6orf79
Cytomap6p23
Gene Typeprotein-coding
GO ID

GO:0006810

UniProtAcc

Q96AQ8


Top

Malignant transformation analysis

check button Identification of the aberrant gene expression in precancerous and cancerous lesions by comparing the gene expression of stem-like cells in diseased tissues with normal stem cells
check button Malignant transformation involving gene list.
Entrez IDSymbolReplicatesSpeciesOrganTissueAdj P-valueLog2FCMalignancy
63933MCUR1LZE2THumanEsophagusESCC1.09e-024.81e-010.082
63933MCUR1LZE4THumanEsophagusESCC4.18e-174.28e-010.0811
63933MCUR1LZE7THumanEsophagusESCC2.43e-044.79e-010.0667
63933MCUR1LZE20THumanEsophagusESCC1.07e-022.06e-010.0662
63933MCUR1LZE22D1HumanEsophagusHGIN1.46e-031.83e-010.0595
63933MCUR1LZE22THumanEsophagusESCC1.98e-037.10e-010.068
63933MCUR1LZE24THumanEsophagusESCC4.16e-164.24e-010.0596
63933MCUR1LZE21THumanEsophagusESCC1.08e-083.83e-010.0655
63933MCUR1P1T-EHumanEsophagusESCC9.49e-176.50e-010.0875
63933MCUR1P2T-EHumanEsophagusESCC1.30e-501.03e+000.1177
63933MCUR1P4T-EHumanEsophagusESCC4.93e-441.15e+000.1323
63933MCUR1P5T-EHumanEsophagusESCC1.02e-366.97e-010.1327
63933MCUR1P8T-EHumanEsophagusESCC3.85e-243.24e-010.0889
63933MCUR1P9T-EHumanEsophagusESCC2.87e-257.57e-010.1131
63933MCUR1P10T-EHumanEsophagusESCC2.12e-601.13e+000.116
63933MCUR1P11T-EHumanEsophagusESCC1.92e-291.25e+000.1426
63933MCUR1P12T-EHumanEsophagusESCC8.71e-528.57e-010.1122
63933MCUR1P15T-EHumanEsophagusESCC1.23e-307.91e-010.1149
63933MCUR1P16T-EHumanEsophagusESCC1.06e-366.55e-010.1153
63933MCUR1P17T-EHumanEsophagusESCC3.99e-241.11e+000.1278
Page: 1 2 3 4 5 6 

check button Transcriptomic changes along malignancy continuum.
TissueExpression DynamicsAbbreviation
EsophagusThe image shows the transcriptomic changes along malignancy continuum.log2FC in expression of this searched gene in stem-like cells from each diseased tissue sample relative to stem-like cells in normal samples in each tissue plotted against the malignancy continuum. Samples are colored based on if they are from different disease stage.ESCC: Esophageal squamous cell carcinoma
HGIN: High-grade intraepithelial neoplasias
LGIN: Low-grade intraepithelial neoplasias
LiverThe image shows the transcriptomic changes along malignancy continuum.log2FC in expression of this searched gene in stem-like cells from each diseased tissue sample relative to stem-like cells in normal samples in each tissue plotted against the malignancy continuum. Samples are colored based on if they are from different disease stage.HCC: Hepatocellular carcinoma
NAFLD: Non-alcoholic fatty liver disease
Oral CavityThe image shows the transcriptomic changes along malignancy continuum.log2FC in expression of this searched gene in stem-like cells from each diseased tissue sample relative to stem-like cells in normal samples in each tissue plotted against the malignancy continuum. Samples are colored based on if they are from different disease stage.EOLP: Erosive Oral lichen planus
LP: leukoplakia
NEOLP: Non-erosive oral lichen planus
OSCC: Oral squamous cell carcinoma
SkinThe image shows the transcriptomic changes along malignancy continuum.log2FC in expression of this searched gene in stem-like cells from each diseased tissue sample relative to stem-like cells in normal samples in each tissue plotted against the malignancy continuum. Samples are colored based on if they are from different disease stage.
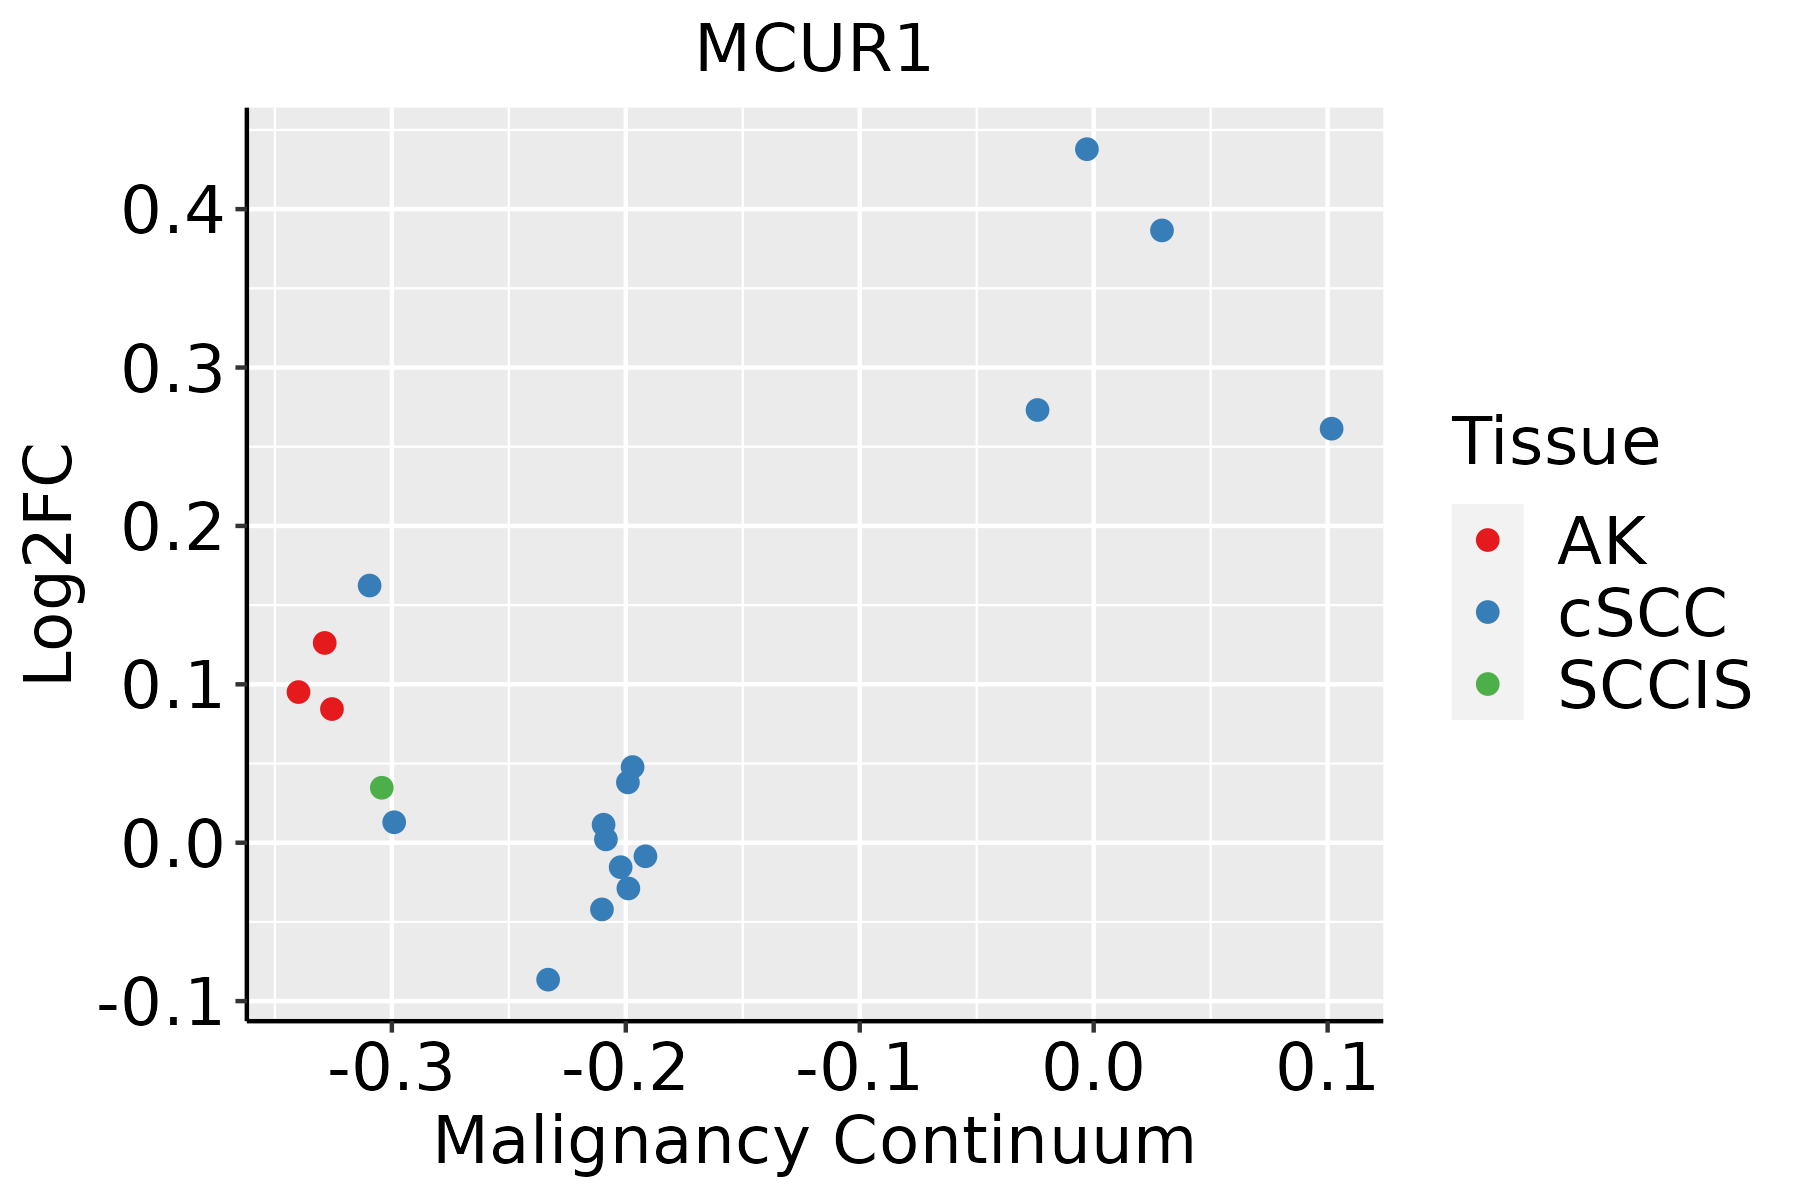
AK: Actinic keratosis
cSCC: Cutaneous squamous cell carcinoma
SCCIS:squamous cell carcinoma in situ
ThyroidThe image shows the transcriptomic changes along malignancy continuum.log2FC in expression of this searched gene in stem-like cells from each diseased tissue sample relative to stem-like cells in normal samples in each tissue plotted against the malignancy continuum. Samples are colored based on if they are from different disease stage.
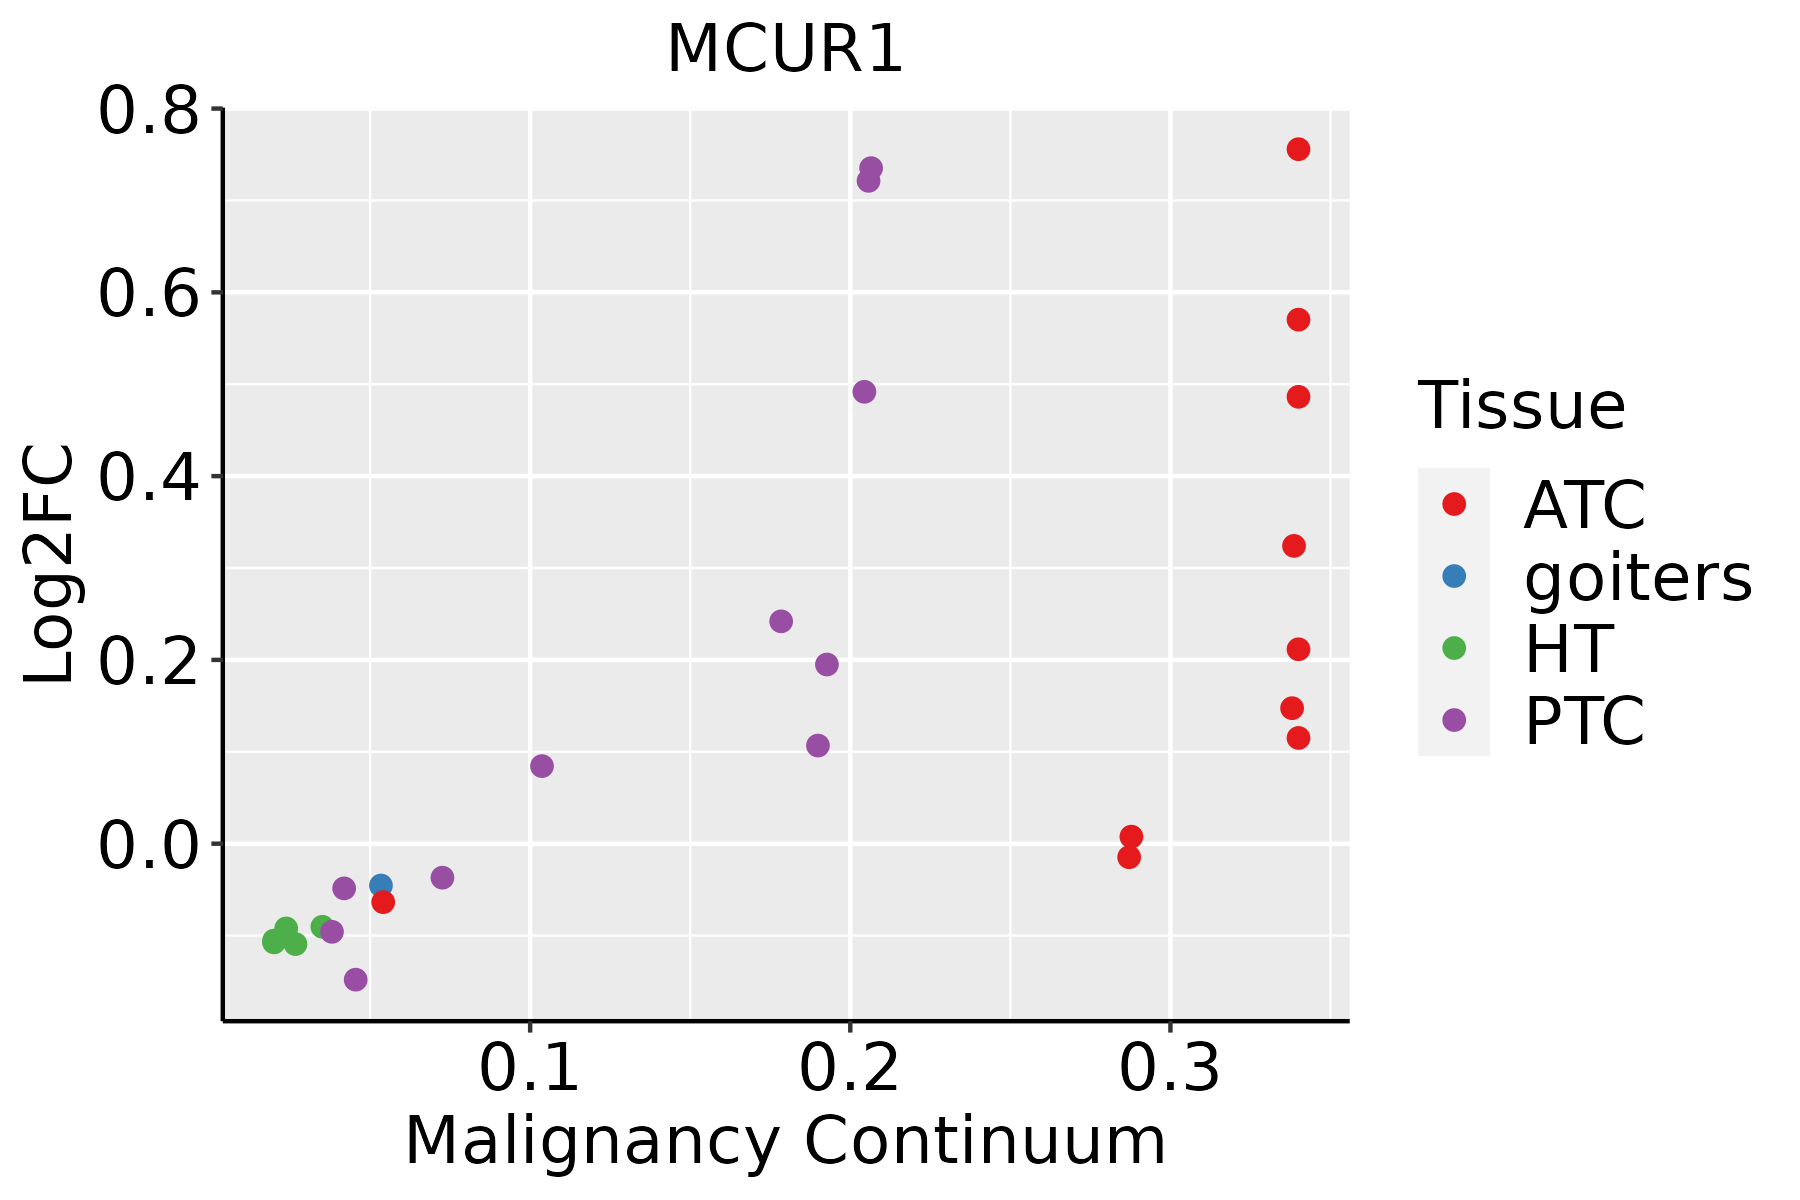
ATC: Anaplastic thyroid cancer
HT: Hashimoto's thyroiditis
PTC: Papillary thyroid cancer
∗log2FC in expression of this searched gene in stem-like cells from each diseased tissue sample relative to stem-like cells in normal samples in each tissue plotted against the malignancy continuum. Samples are colored based on if they are from different disease stage.

Top

Malignant transformation related pathway analysis

check buttonFind out the enriched GO biological processes and KEGG pathways involved in transition from healthy to precancer to cancer
check button Figure of enriched GO biological processes.
TissueDisease StageEnriched GO biological Processes
ColorectumADGO analysis - Figure of enriched GO biological processes: Top 15 enriched GO BP terms are showed in the bar plot of each disease state in each tissue. Each row represents a significant GO biological process which is colored according to the -log10(p.adjust).
ColorectumSERGO analysis - Figure of enriched GO biological processes: Top 15 enriched GO BP terms are showed in the bar plot of each disease state in each tissue. Each row represents a significant GO biological process which is colored according to the -log10(p.adjust).
ColorectumMSSGO analysis - Figure of enriched GO biological processes: Top 15 enriched GO BP terms are showed in the bar plot of each disease state in each tissue. Each row represents a significant GO biological process which is colored according to the -log10(p.adjust).
ColorectumMSI-HGO analysis - Figure of enriched GO biological processes: Top 15 enriched GO BP terms are showed in the bar plot of each disease state in each tissue. Each row represents a significant GO biological process which is colored according to the -log10(p.adjust).
ColorectumFAPGO analysis - Figure of enriched GO biological processes: Top 15 enriched GO BP terms are showed in the bar plot of each disease state in each tissue. Each row represents a significant GO biological process which is colored according to the -log10(p.adjust).
∗Top 15 enriched GO BP terms are showed in the bar plot of each disease state in each tissue. Each row represents a significant GO biological process which is colored according to the -log10(p.adjust).
Page: 1 2 3 4 5 6 7 8 9 

check button Enriched GO biological processes.
GO IDTissueDisease StageDescriptionGene RatioBg Ratiopvaluep.adjustCount
GO:000683920EsophagusHGINmitochondrial transport74/2587254/187231.32e-101.32e-0874
GO:199054220EsophagusHGINmitochondrial transmembrane transport29/2587102/187238.52e-051.87e-0329
GO:0006839110EsophagusESCCmitochondrial transport187/8552254/187238.35e-209.81e-18187
GO:1990542110EsophagusESCCmitochondrial transmembrane transport72/8552102/187232.94e-074.23e-0672
GO:00068397LiverCirrhoticmitochondrial transport112/4634254/187231.03e-116.66e-10112
GO:005156011LiverCirrhoticmitochondrial calcium ion homeostasis15/463426/187233.43e-042.93e-0315
GO:19905425LiverCirrhoticmitochondrial transmembrane transport41/4634102/187234.08e-043.37e-0341
GO:005156111LiverCirrhoticpositive regulation of mitochondrial calcium ion concentration8/463411/187231.10e-037.64e-038
GO:00364444LiverCirrhoticcalcium import into the mitochondrion8/463414/187239.65e-034.35e-028
GO:000683912LiverHCCmitochondrial transport184/7958254/187232.30e-223.83e-20184
GO:199054212LiverHCCmitochondrial transmembrane transport78/7958102/187232.73e-121.26e-1078
GO:003644411LiverHCCcalcium import into the mitochondrion13/795814/187231.25e-041.03e-0313
GO:005156021LiverHCCmitochondrial calcium ion homeostasis20/795826/187233.82e-042.61e-0320
GO:00068513LiverHCCmitochondrial calcium ion transmembrane transport16/795820/187237.15e-044.37e-0316
GO:00515612LiverHCCpositive regulation of mitochondrial calcium ion concentration10/795811/187231.30e-037.01e-0310
GO:000683918Oral cavityOSCCmitochondrial transport162/7305254/187238.96e-166.52e-14162
GO:00515615Oral cavityOSCCpositive regulation of mitochondrial calcium ion concentration10/730511/187235.78e-043.30e-0310
GO:199054218Oral cavityOSCCmitochondrial transmembrane transport56/7305102/187238.06e-044.32e-0356
GO:00515607Oral cavityOSCCmitochondrial calcium ion homeostasis18/730526/187231.75e-038.28e-0318
GO:00068514Oral cavityOSCCmitochondrial calcium ion transmembrane transport14/730520/187234.95e-031.94e-0214
Page: 1 2 

check button Enriched KEGG pathways.
Pathway IDTissueDisease StageDescriptionGene RatioBg Ratiopvaluep.adjustqvalueCount
Page: 1 

Top

Cell-cell communication analysis

check buttonIdentification of potential cell-cell interactions between two cell types and their ligand-receptor pairs for different disease states
LigandReceptorLRpairPathwayTissueDisease Stage
Page: 1 

Top

Single-cell gene regulatory network inference analysis

check buttonFind out the significant the regulons (TFs) and the target genes of each regulon across cell types for different disease states
TFCell TypeTissueDisease StageTarget GeneRSSRegulon Activity
∗The dot plots of a searched regulon are shown for all cell subpopulations in each disease state of each tissue based on the regulon specific score inferred using pySCENIC and by calculating the average expression.
Page: 1 

Top

Somatic mutation of malignant transformation related genes

check buttonAnnotation of somatic variants for genes involved in malignant transformation
Hugo SymbolVariant ClassVariant ClassificationdbSNP RSHGVScHGVSpHGVSp ShortSWISSPROTBIOTYPESIFTPolyPhenTumor Sample BarcodeTissueHistologySexAgeStageTherapy TypesDrugsOutcome
MCUR1SNVMissense_Mutationc.733G>Cp.Glu245Glnp.E245QQ96AQ8protein_codingdeleterious(0.02)possibly_damaging(0.899)TCGA-BH-A0DZ-01Breastbreast invasive carcinomaFemale<65I/IIChemotherapydocetaxelSD
MCUR1insertionNonsense_Mutationnovelc.562_563insCTTTTTAGGGTAGACTAGATTATGTGTTp.Ile188ThrfsTer3p.I188Tfs*3Q96AQ8protein_codingTCGA-AQ-A04J-01Breastbreast invasive carcinomaFemale<65I/IIChemotherapycytoxanSD
MCUR1SNVMissense_Mutationrs774710482c.499G>Ap.Asp167Asnp.D167NQ96AQ8protein_codingdeleterious(0)probably_damaging(0.999)TCGA-DR-A0ZM-01Cervixcervical & endocervical cancerFemale<65III/IVUnspecificCisplatinSD
MCUR1SNVMissense_Mutationrs772379179c.955N>Ap.Glu319Lysp.E319KQ96AQ8protein_codingdeleterious(0)possibly_damaging(0.856)TCGA-AG-A002-01Colorectumrectum adenocarcinomaMale<65I/IIUnknownUnknownSD
MCUR1SNVMissense_Mutationrs780710613c.1066N>Tp.Arg356Cysp.R356CQ96AQ8protein_codingdeleterious(0)possibly_damaging(0.479)TCGA-EI-6917-01Colorectumrectum adenocarcinomaMale<65III/IVChemotherapy5fluorouracil+oxaciplatina+l-folinianSD
MCUR1SNVMissense_Mutationrs145895773c.674N>Tp.Ala225Valp.A225VQ96AQ8protein_codingtolerated(0.07)probably_damaging(0.967)TCGA-A5-A0GP-01Endometriumuterine corpus endometrioid carcinomaFemale<65I/IIUnknownUnknownSD
MCUR1SNVMissense_Mutationrs145895773c.674N>Tp.Ala225Valp.A225VQ96AQ8protein_codingtolerated(0.07)probably_damaging(0.967)TCGA-A5-A1OF-01Endometriumuterine corpus endometrioid carcinomaFemale<65I/IIUnknownUnknownSD
MCUR1SNVMissense_Mutationrs762334997c.452N>Ap.Arg151Hisp.R151HQ96AQ8protein_codingtolerated(0.77)benign(0)TCGA-AP-A1DK-01Endometriumuterine corpus endometrioid carcinomaFemale<65I/IIUnknownUnknownSD
MCUR1SNVMissense_Mutationc.536N>Ap.Gly179Glup.G179EQ96AQ8protein_codingdeleterious(0)probably_damaging(1)TCGA-AP-A1DP-01Endometriumuterine corpus endometrioid carcinomaFemale>=65I/IIChemotherapypaclitaxelPD
MCUR1SNVMissense_Mutationrs756791116c.925C>Tp.Arg309Trpp.R309WQ96AQ8protein_codingdeleterious(0)probably_damaging(0.999)TCGA-AP-A1DV-01Endometriumuterine corpus endometrioid carcinomaFemale<65I/IIUnknownUnknownSD
Page: 1 2 3 

Top

Related drugs of malignant transformation related genes

check buttonIdentification of chemicals and drugs interact with genes involved in malignant transfromation
(DGIdb 4.0)
Entrez IDSymbolCategoryInteraction TypesDrug Claim NameDrug NamePMIDs
Page: 1