
|
|||||
|
 | |
| |
| |
| |
| |
| |
|
Gene: MCRIP1 |
Gene summary for MCRIP1 |
| Gene information | Species | Human | Gene symbol | MCRIP1 | Gene ID | 348262 |
| Gene name | MAPK regulated corepressor interacting protein 1 | |
| Gene Alias | FAM195B | |
| Cytomap | 17q25.3 | |
| Gene Type | protein-coding | GO ID | GO:0001837 | UniProtAcc | A0A024R8R5 |
Top |
Malignant transformation analysis |
| Identification of the aberrant gene expression in precancerous and cancerous lesions by comparing the gene expression of stem-like cells in diseased tissues with normal stem cells |
| Entrez ID | Symbol | Replicates | Species | Organ | Tissue | Adj P-value | Log2FC | Malignancy |
| 348262 | MCRIP1 | GSM4909286 | Human | Breast | IDC | 2.09e-08 | 2.76e-01 | 0.1081 |
| 348262 | MCRIP1 | GSM4909289 | Human | Breast | IDC | 8.35e-05 | 5.92e-01 | 0.1064 |
| 348262 | MCRIP1 | GSM4909293 | Human | Breast | IDC | 2.20e-09 | 2.80e-01 | 0.1581 |
| 348262 | MCRIP1 | GSM4909298 | Human | Breast | IDC | 2.95e-03 | 2.31e-01 | 0.1551 |
| 348262 | MCRIP1 | GSM4909308 | Human | Breast | IDC | 9.41e-09 | 3.30e-01 | 0.158 |
| 348262 | MCRIP1 | GSM4909311 | Human | Breast | IDC | 1.49e-05 | 5.65e-02 | 0.1534 |
| 348262 | MCRIP1 | GSM4909317 | Human | Breast | IDC | 1.48e-04 | 2.64e-01 | 0.1355 |
| 348262 | MCRIP1 | GSM4909319 | Human | Breast | IDC | 7.88e-15 | 1.66e-01 | 0.1563 |
| 348262 | MCRIP1 | GSM4909320 | Human | Breast | IDC | 2.36e-02 | 3.32e-01 | 0.1575 |
| 348262 | MCRIP1 | GSM4909321 | Human | Breast | IDC | 3.53e-02 | 1.94e-01 | 0.1559 |
| 348262 | MCRIP1 | brca1 | Human | Breast | Precancer | 8.07e-06 | -1.96e-01 | -0.0338 |
| 348262 | MCRIP1 | brca2 | Human | Breast | Precancer | 8.30e-08 | -1.96e-01 | -0.024 |
| 348262 | MCRIP1 | brca3 | Human | Breast | Precancer | 3.85e-08 | -1.96e-01 | -0.0263 |
| 348262 | MCRIP1 | M1 | Human | Breast | IDC | 1.59e-05 | 3.90e-01 | 0.1577 |
| 348262 | MCRIP1 | P1 | Human | Breast | IDC | 8.05e-04 | 1.97e-01 | 0.1527 |
| 348262 | MCRIP1 | DCIS2 | Human | Breast | DCIS | 1.57e-46 | 1.37e-01 | 0.0085 |
| 348262 | MCRIP1 | LZE4T | Human | Esophagus | ESCC | 1.80e-14 | 3.70e-01 | 0.0811 |
| 348262 | MCRIP1 | LZE5T | Human | Esophagus | ESCC | 8.66e-03 | 3.62e-01 | 0.0514 |
| 348262 | MCRIP1 | LZE7T | Human | Esophagus | ESCC | 4.69e-07 | 3.48e-01 | 0.0667 |
| 348262 | MCRIP1 | LZE8T | Human | Esophagus | ESCC | 5.07e-12 | 2.68e-01 | 0.067 |
| Page: 1 2 3 |
| Tissue | Expression Dynamics | Abbreviation |
| Breast | 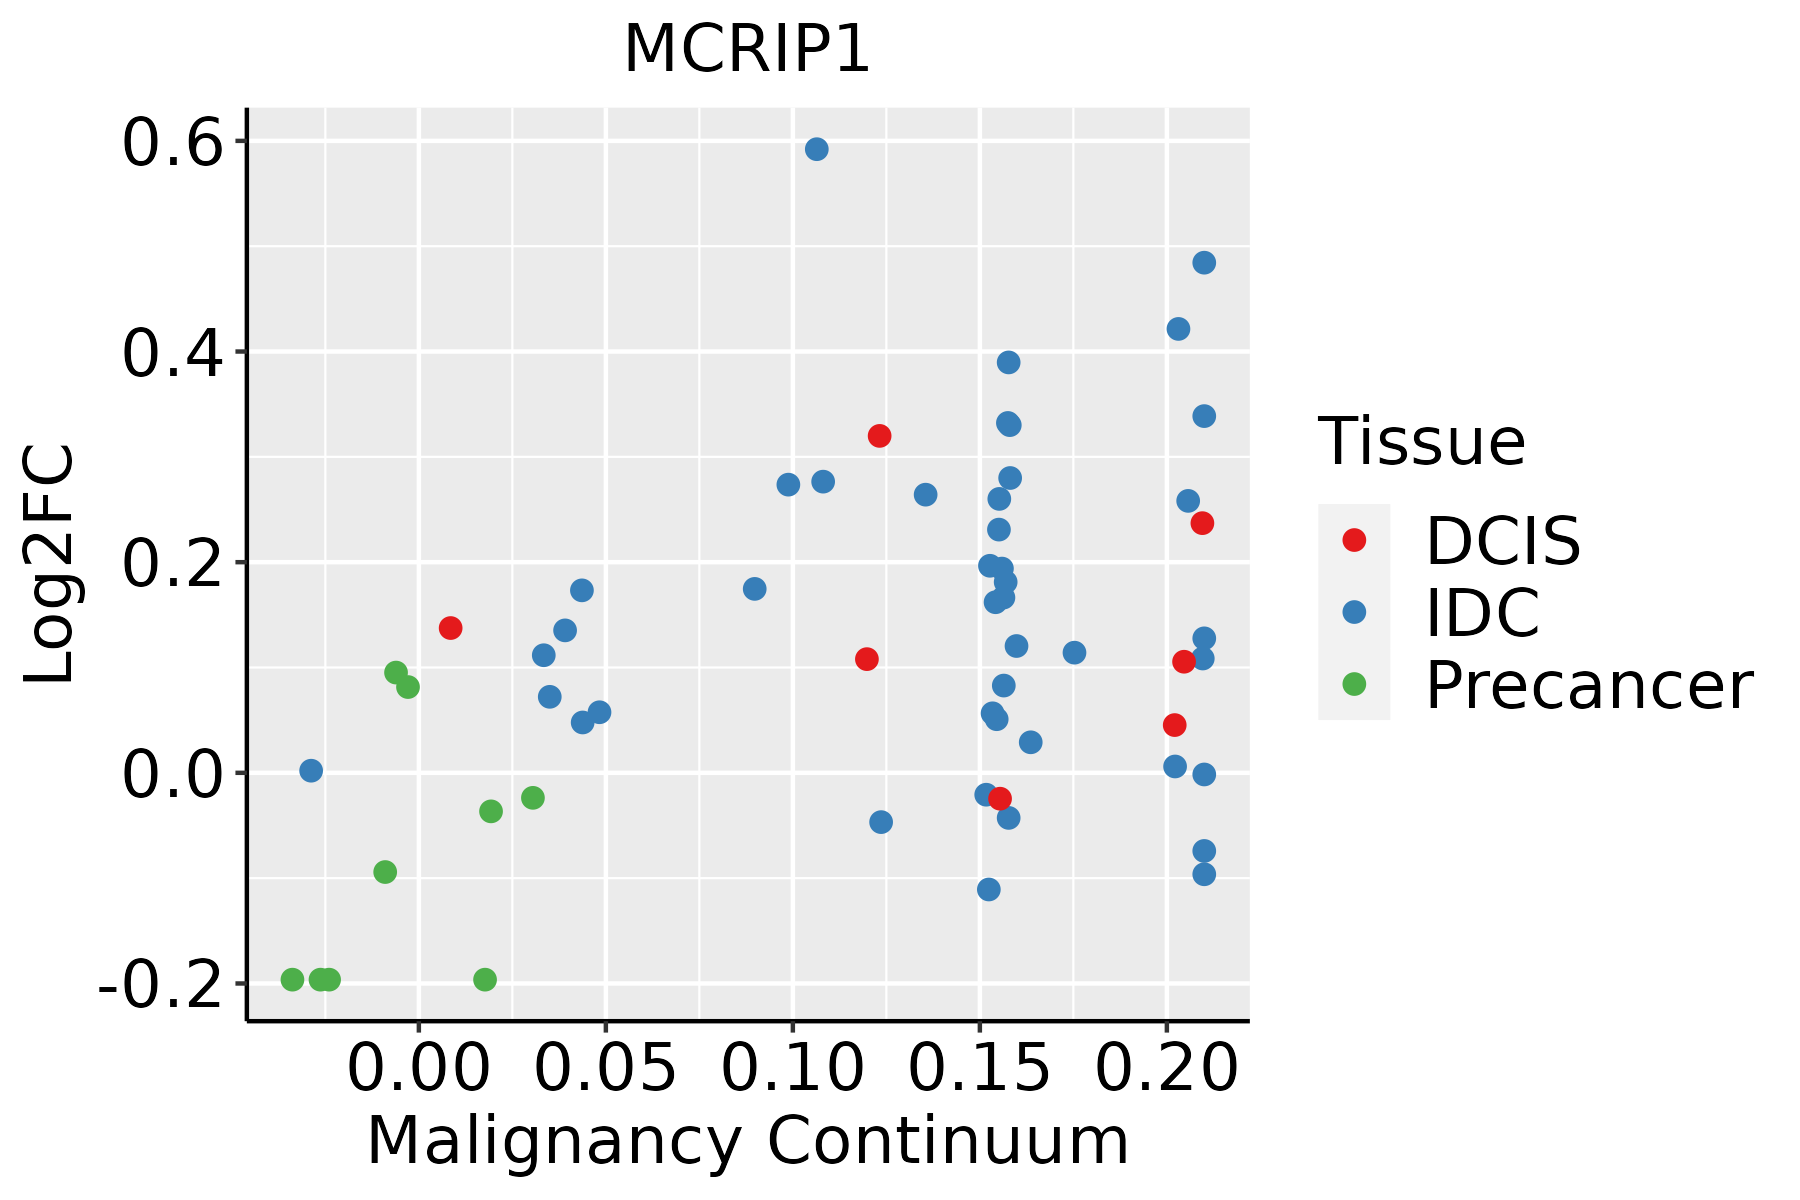 | IDC: Invasive ductal carcinoma |
| DCIS: Ductal carcinoma in situ | ||
| Precancer(BRCA1-mut): Precancerous lesion from BRCA1 mutation carriers | ||
| Esophagus | 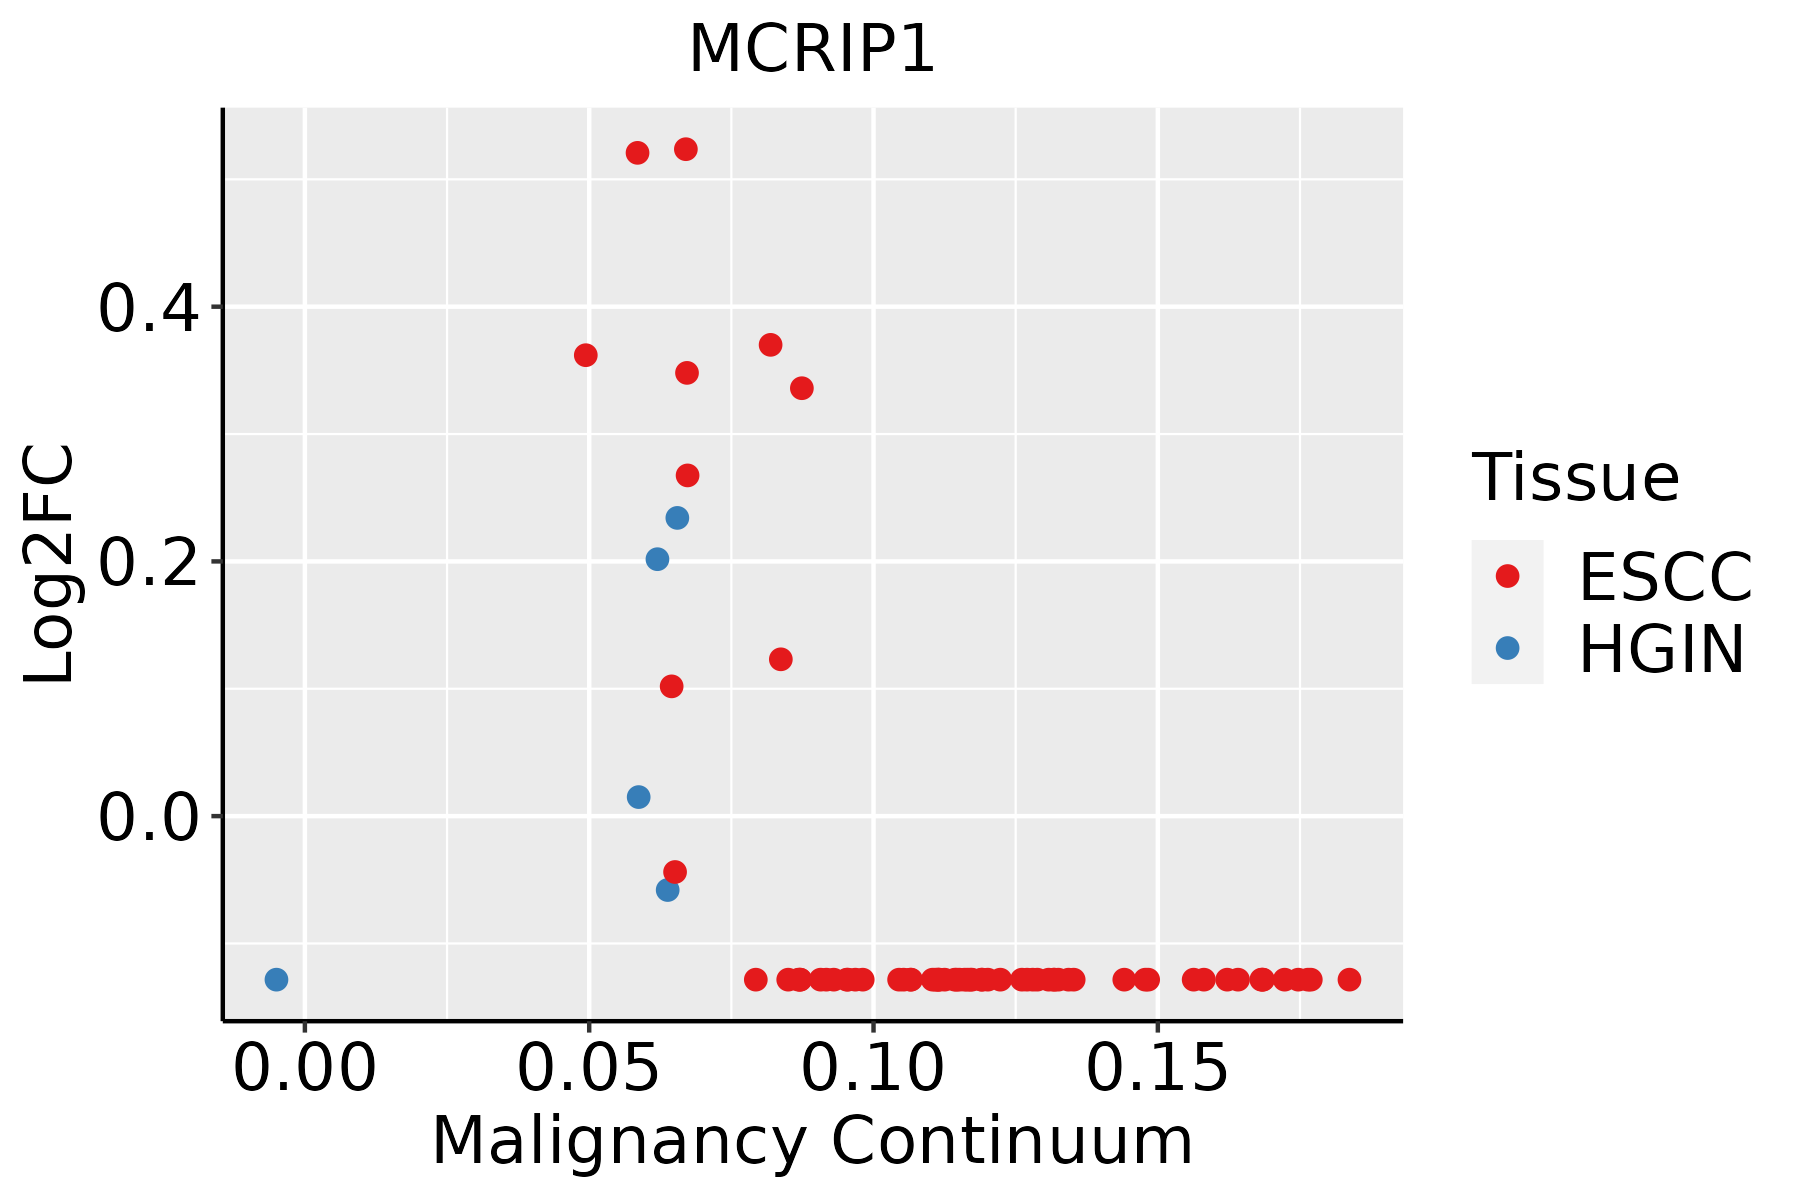 | ESCC: Esophageal squamous cell carcinoma |
| HGIN: High-grade intraepithelial neoplasias | ||
| LGIN: Low-grade intraepithelial neoplasias | ||
| Liver | 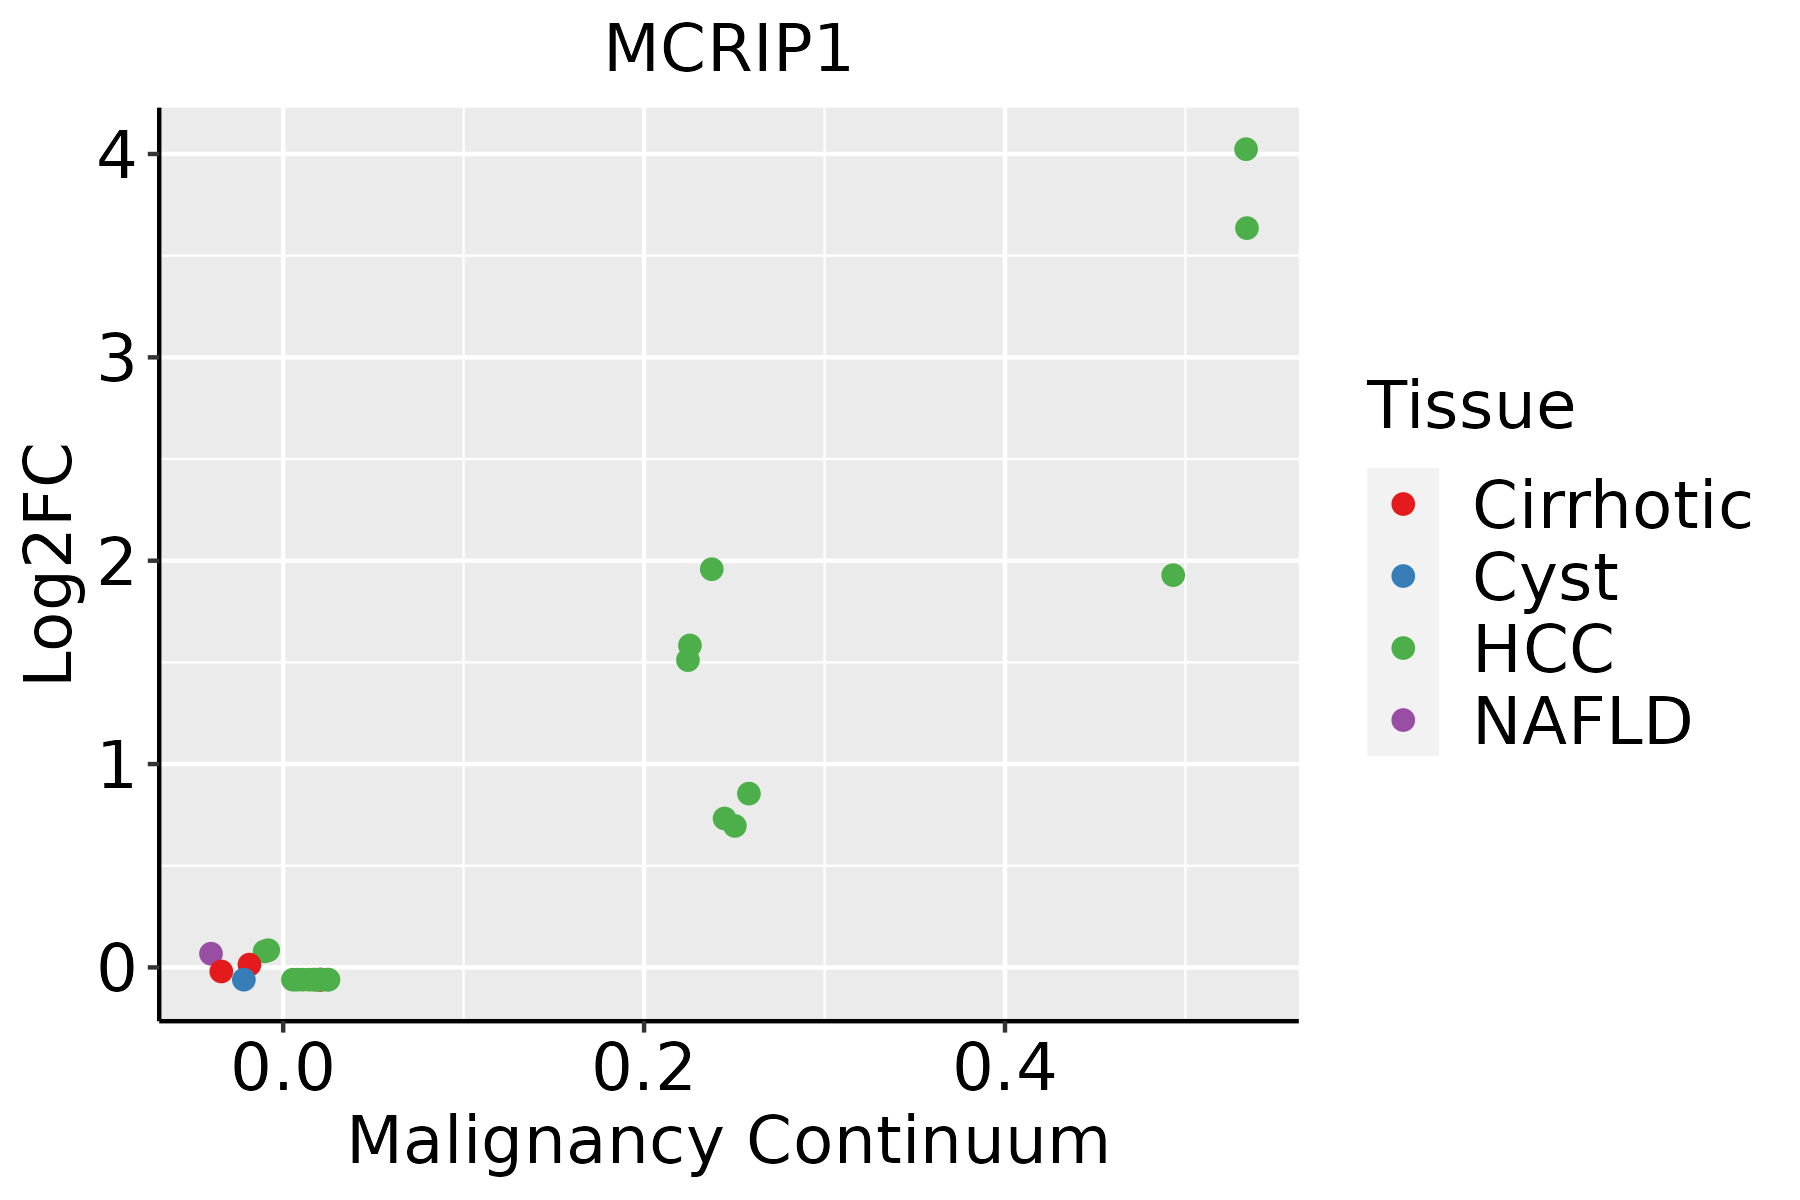 | HCC: Hepatocellular carcinoma |
| NAFLD: Non-alcoholic fatty liver disease | ||
| Thyroid | 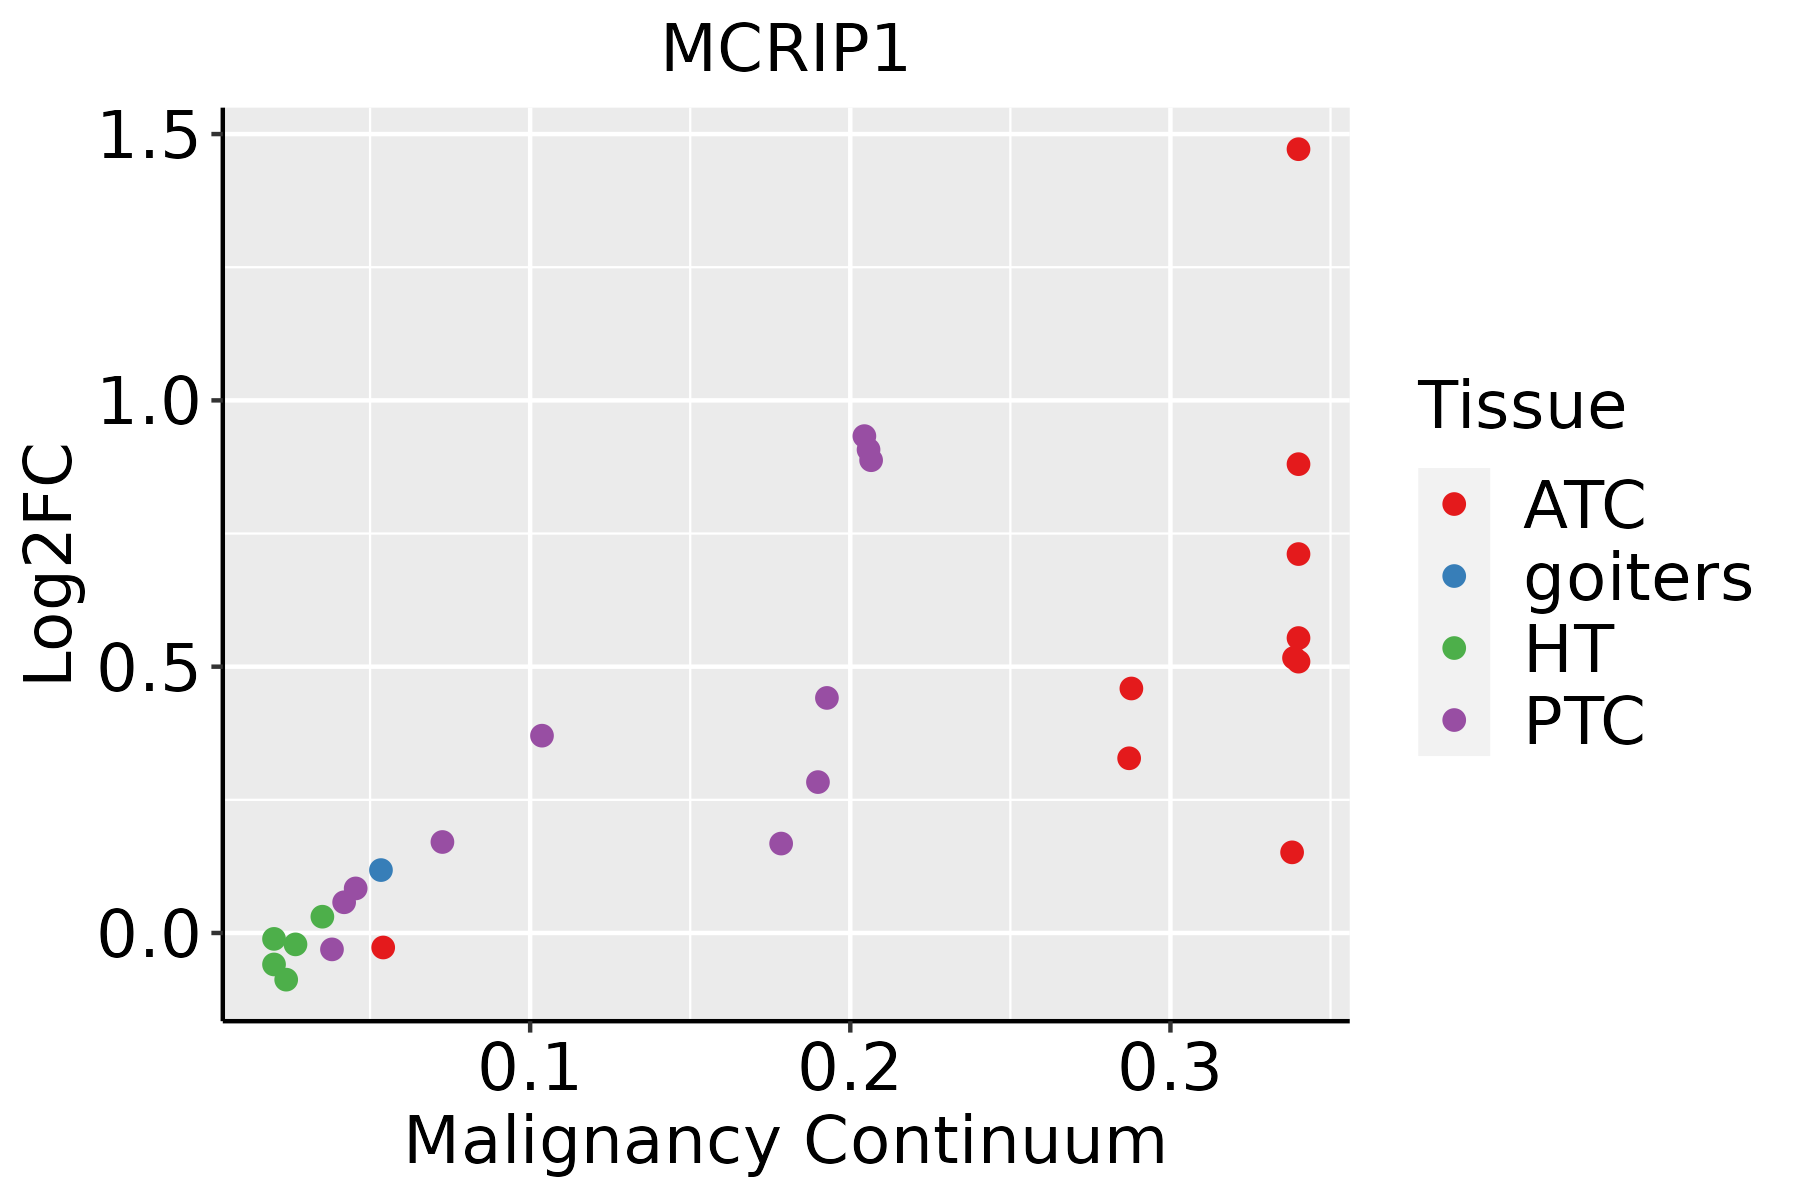 | ATC: Anaplastic thyroid cancer |
| HT: Hashimoto's thyroiditis | ||
| PTC: Papillary thyroid cancer |
| ∗log2FC in expression of this searched gene in stem-like cells from each diseased tissue sample relative to stem-like cells in normal samples in each tissue plotted against the malignancy continuum. Samples are colored based on if they are from different disease stage. |
Top |
Malignant transformation related pathway analysis |
| Find out the enriched GO biological processes and KEGG pathways involved in transition from healthy to precancer to cancer |
| Tissue | Disease Stage | Enriched GO biological Processes |
| Colorectum | AD |  |
| Colorectum | SER |  |
| Colorectum | MSS |  |
| Colorectum | MSI-H |  |
| Colorectum | FAP |  |
| ∗Top 15 enriched GO BP terms are showed in the bar plot of each disease state in each tissue. Each row represents a significant GO biological process which is colored according to the -log10(p.adjust). |
| Page: 1 2 3 4 5 6 7 8 9 |
| GO ID | Tissue | Disease Stage | Description | Gene Ratio | Bg Ratio | pvalue | p.adjust | Count |
| GO:00018373 | Breast | Precancer | epithelial to mesenchymal transition | 19/1080 | 157/18723 | 1.78e-03 | 1.75e-02 | 19 |
| GO:000183711 | Breast | IDC | epithelial to mesenchymal transition | 23/1434 | 157/18723 | 1.97e-03 | 1.88e-02 | 23 |
| GO:000183721 | Breast | DCIS | epithelial to mesenchymal transition | 22/1390 | 157/18723 | 2.92e-03 | 2.50e-02 | 22 |
| GO:00018378 | Esophagus | ESCC | epithelial to mesenchymal transition | 95/8552 | 157/18723 | 1.25e-04 | 8.56e-04 | 95 |
| GO:00487628 | Esophagus | ESCC | mesenchymal cell differentiation | 133/8552 | 236/18723 | 5.94e-04 | 3.22e-03 | 133 |
| GO:00107174 | Esophagus | ESCC | regulation of epithelial to mesenchymal transition | 61/8552 | 99/18723 | 1.01e-03 | 5.09e-03 | 61 |
| GO:00604856 | Esophagus | ESCC | mesenchyme development | 156/8552 | 291/18723 | 3.76e-03 | 1.53e-02 | 156 |
| GO:000183715 | Thyroid | PTC | epithelial to mesenchymal transition | 76/5968 | 157/18723 | 1.10e-05 | 1.21e-04 | 76 |
| GO:004876215 | Thyroid | PTC | mesenchymal cell differentiation | 99/5968 | 236/18723 | 6.72e-04 | 4.22e-03 | 99 |
| GO:00107175 | Thyroid | PTC | regulation of epithelial to mesenchymal transition | 46/5968 | 99/18723 | 1.66e-03 | 9.13e-03 | 46 |
| GO:006048514 | Thyroid | PTC | mesenchyme development | 112/5968 | 291/18723 | 9.48e-03 | 3.90e-02 | 112 |
| GO:000183722 | Thyroid | ATC | epithelial to mesenchymal transition | 87/6293 | 157/18723 | 1.50e-08 | 3.06e-07 | 87 |
| GO:004876221 | Thyroid | ATC | mesenchymal cell differentiation | 116/6293 | 236/18723 | 5.08e-07 | 7.30e-06 | 116 |
| GO:006048521 | Thyroid | ATC | mesenchyme development | 136/6293 | 291/18723 | 2.04e-06 | 2.43e-05 | 136 |
| GO:001071712 | Thyroid | ATC | regulation of epithelial to mesenchymal transition | 53/6293 | 99/18723 | 3.42e-05 | 2.82e-04 | 53 |
| Page: 1 |
| Pathway ID | Tissue | Disease Stage | Description | Gene Ratio | Bg Ratio | pvalue | p.adjust | qvalue | Count |
| Page: 1 |
Top |
Cell-cell communication analysis |
| Identification of potential cell-cell interactions between two cell types and their ligand-receptor pairs for different disease states |
| Ligand | Receptor | LRpair | Pathway | Tissue | Disease Stage |
| Page: 1 |
Top |
Single-cell gene regulatory network inference analysis |
| Find out the significant the regulons (TFs) and the target genes of each regulon across cell types for different disease states |
| TF | Cell Type | Tissue | Disease Stage | Target Gene | RSS | Regulon Activity |
| ∗The dot plots of a searched regulon are shown for all cell subpopulations in each disease state of each tissue based on the regulon specific score inferred using pySCENIC and by calculating the average expression. |
| Page: 1 |
Top |
Somatic mutation of malignant transformation related genes |
| Annotation of somatic variants for genes involved in malignant transformation |
| Hugo Symbol | Variant Class | Variant Classification | dbSNP RS | HGVSc | HGVSp | HGVSp Short | SWISSPROT | BIOTYPE | SIFT | PolyPhen | Tumor Sample Barcode | Tissue | Histology | Sex | Age | Stage | Therapy Types | Drugs | Outcome |
| MCRIP1 | SNV | Missense_Mutation | novel | c.326N>A | p.Arg109His | p.R109H | protein_coding | deleterious_low_confidence(0.01) | probably_damaging(0.988) | TCGA-2W-A8YY-01 | Cervix | cervical & endocervical cancer | Female | <65 | I/II | Chemotherapy | cisplatin | CR | |
| MCRIP1 | SNV | Missense_Mutation | novel | c.122G>A | p.Arg41His | p.R41H | protein_coding | deleterious(0.01) | probably_damaging(0.967) | TCGA-B5-A3FC-01 | Endometrium | uterine corpus endometrioid carcinoma | Female | <65 | I/II | Unknown | Unknown | SD | |
| MCRIP1 | SNV | Missense_Mutation | novel | c.188N>G | p.Glu63Gly | p.E63G | protein_coding | deleterious(0) | possibly_damaging(0.557) | TCGA-FI-A2D5-01 | Endometrium | uterine corpus endometrioid carcinoma | Female | <65 | III/IV | Chemotherapy | carboplatinum | PD |
| Page: 1 |
Top |
Related drugs of malignant transformation related genes |
| Identification of chemicals and drugs interact with genes involved in malignant transfromation |
| (DGIdb 4.0) |
| Entrez ID | Symbol | Category | Interaction Types | Drug Claim Name | Drug Name | PMIDs |
| Page: 1 |

Copyright 2023-Present -The University of Texas Health Science Center at Houston |