
|
|||||
|
 | |
| |
| |
| |
| |
| |
|
Gene: MCOLN1 |
Gene summary for MCOLN1 |
| Gene information | Species | Human | Gene symbol | MCOLN1 | Gene ID | 57192 |
| Gene name | mucolipin TRP cation channel 1 | |
| Gene Alias | MG-2 | |
| Cytomap | 19p13.2 | |
| Gene Type | protein-coding | GO ID | GO:0000041 | UniProtAcc | Q9GZU1 |
Top |
Malignant transformation analysis |
| Identification of the aberrant gene expression in precancerous and cancerous lesions by comparing the gene expression of stem-like cells in diseased tissues with normal stem cells |
| Entrez ID | Symbol | Replicates | Species | Organ | Tissue | Adj P-value | Log2FC | Malignancy |
| 57192 | MCOLN1 | LZE4T | Human | Esophagus | ESCC | 9.50e-04 | 1.02e-01 | 0.0811 |
| 57192 | MCOLN1 | LZE7T | Human | Esophagus | ESCC | 2.53e-03 | 3.38e-01 | 0.0667 |
| 57192 | MCOLN1 | LZE22T | Human | Esophagus | ESCC | 1.95e-02 | 1.93e-01 | 0.068 |
| 57192 | MCOLN1 | LZE24T | Human | Esophagus | ESCC | 3.01e-15 | 4.27e-01 | 0.0596 |
| 57192 | MCOLN1 | LZE21T | Human | Esophagus | ESCC | 2.02e-05 | 3.15e-01 | 0.0655 |
| 57192 | MCOLN1 | P1T-E | Human | Esophagus | ESCC | 9.18e-04 | 3.69e-01 | 0.0875 |
| 57192 | MCOLN1 | P2T-E | Human | Esophagus | ESCC | 5.70e-13 | 2.02e-01 | 0.1177 |
| 57192 | MCOLN1 | P4T-E | Human | Esophagus | ESCC | 7.92e-18 | 2.69e-01 | 0.1323 |
| 57192 | MCOLN1 | P5T-E | Human | Esophagus | ESCC | 5.80e-11 | 2.29e-01 | 0.1327 |
| 57192 | MCOLN1 | P8T-E | Human | Esophagus | ESCC | 7.89e-16 | 3.61e-01 | 0.0889 |
| 57192 | MCOLN1 | P9T-E | Human | Esophagus | ESCC | 1.00e-15 | 2.05e-01 | 0.1131 |
| 57192 | MCOLN1 | P10T-E | Human | Esophagus | ESCC | 4.59e-19 | 3.79e-01 | 0.116 |
| 57192 | MCOLN1 | P11T-E | Human | Esophagus | ESCC | 2.13e-10 | 4.49e-01 | 0.1426 |
| 57192 | MCOLN1 | P12T-E | Human | Esophagus | ESCC | 4.40e-15 | 2.81e-01 | 0.1122 |
| 57192 | MCOLN1 | P15T-E | Human | Esophagus | ESCC | 7.15e-08 | 8.78e-02 | 0.1149 |
| 57192 | MCOLN1 | P16T-E | Human | Esophagus | ESCC | 4.71e-14 | 2.13e-01 | 0.1153 |
| 57192 | MCOLN1 | P17T-E | Human | Esophagus | ESCC | 1.79e-04 | 1.93e-01 | 0.1278 |
| 57192 | MCOLN1 | P19T-E | Human | Esophagus | ESCC | 6.31e-06 | 4.89e-01 | 0.1662 |
| 57192 | MCOLN1 | P20T-E | Human | Esophagus | ESCC | 3.37e-09 | 2.62e-01 | 0.1124 |
| 57192 | MCOLN1 | P21T-E | Human | Esophagus | ESCC | 9.26e-10 | 2.59e-01 | 0.1617 |
| Page: 1 2 3 4 5 |
| Tissue | Expression Dynamics | Abbreviation |
| Esophagus | 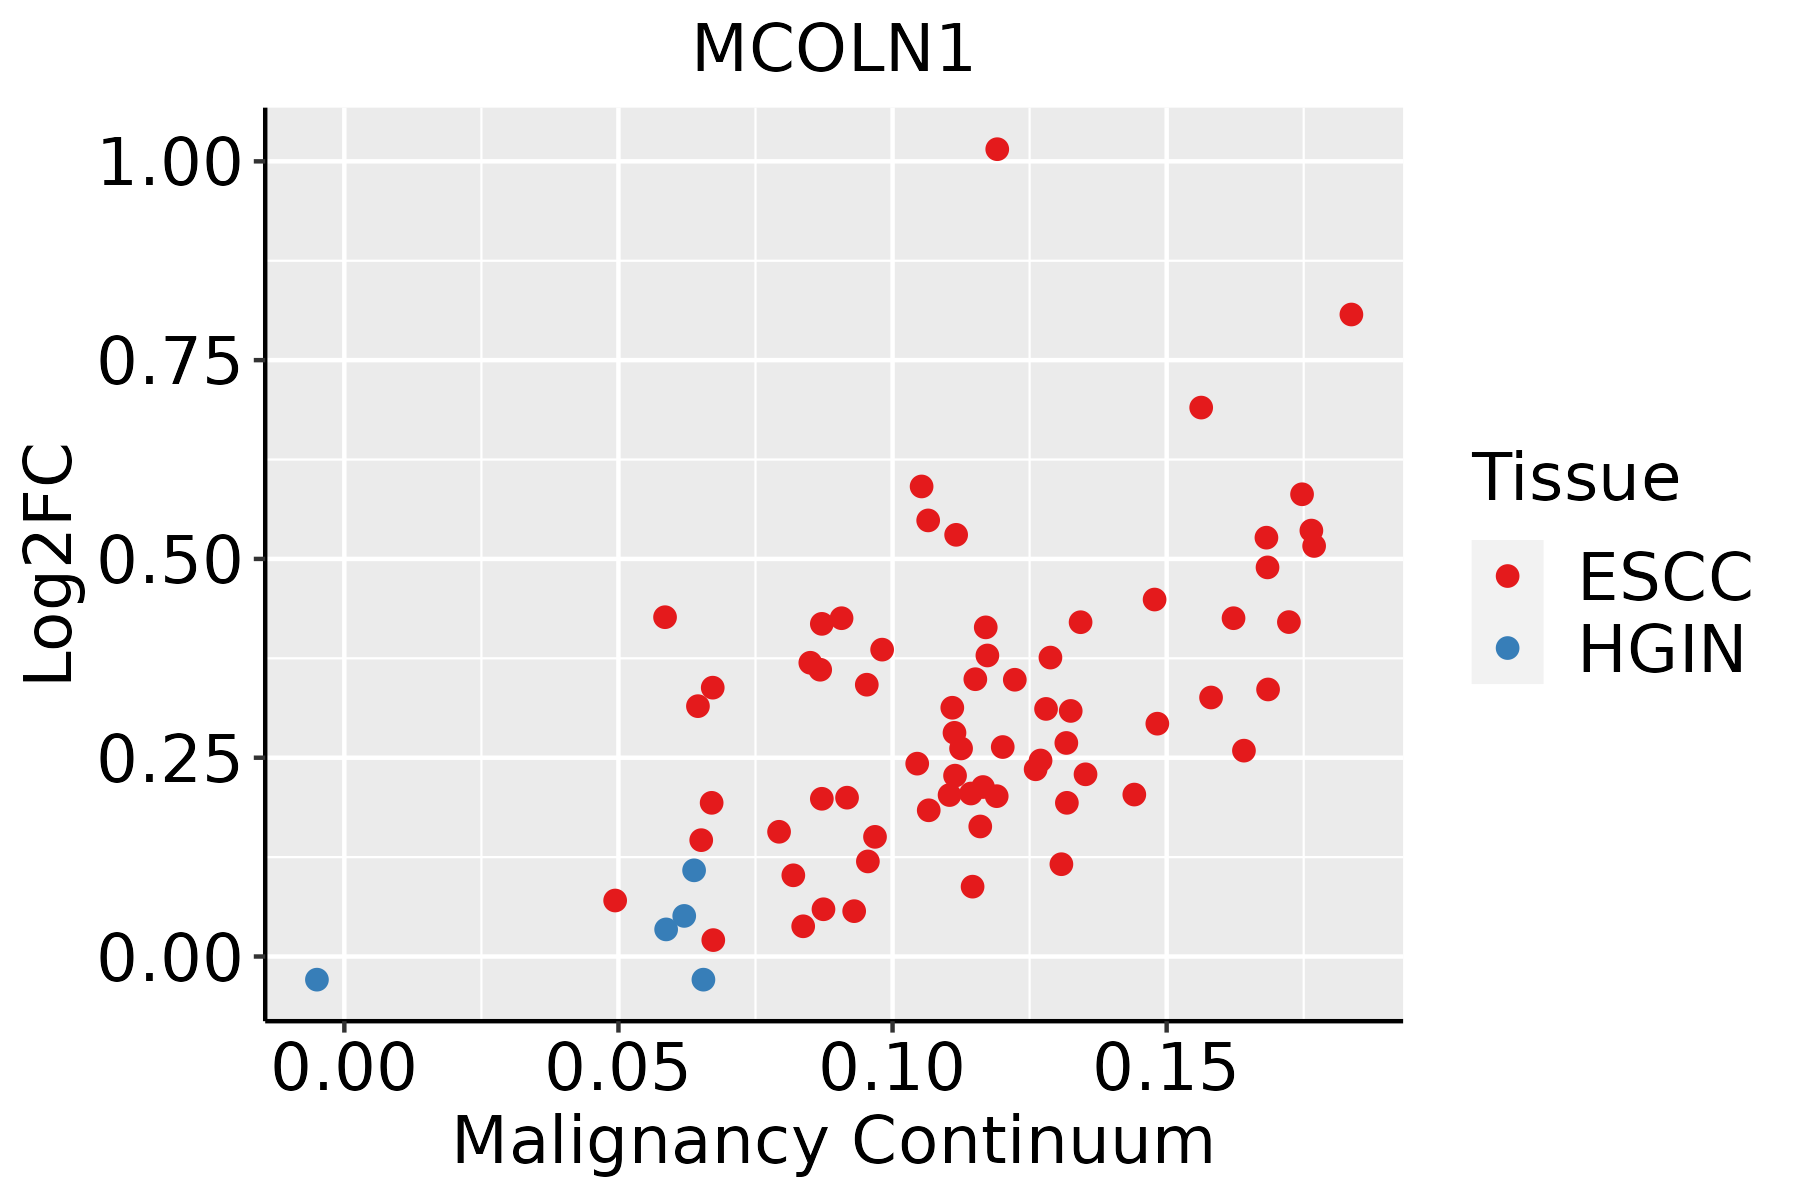 | ESCC: Esophageal squamous cell carcinoma |
| HGIN: High-grade intraepithelial neoplasias | ||
| LGIN: Low-grade intraepithelial neoplasias | ||
| Liver | 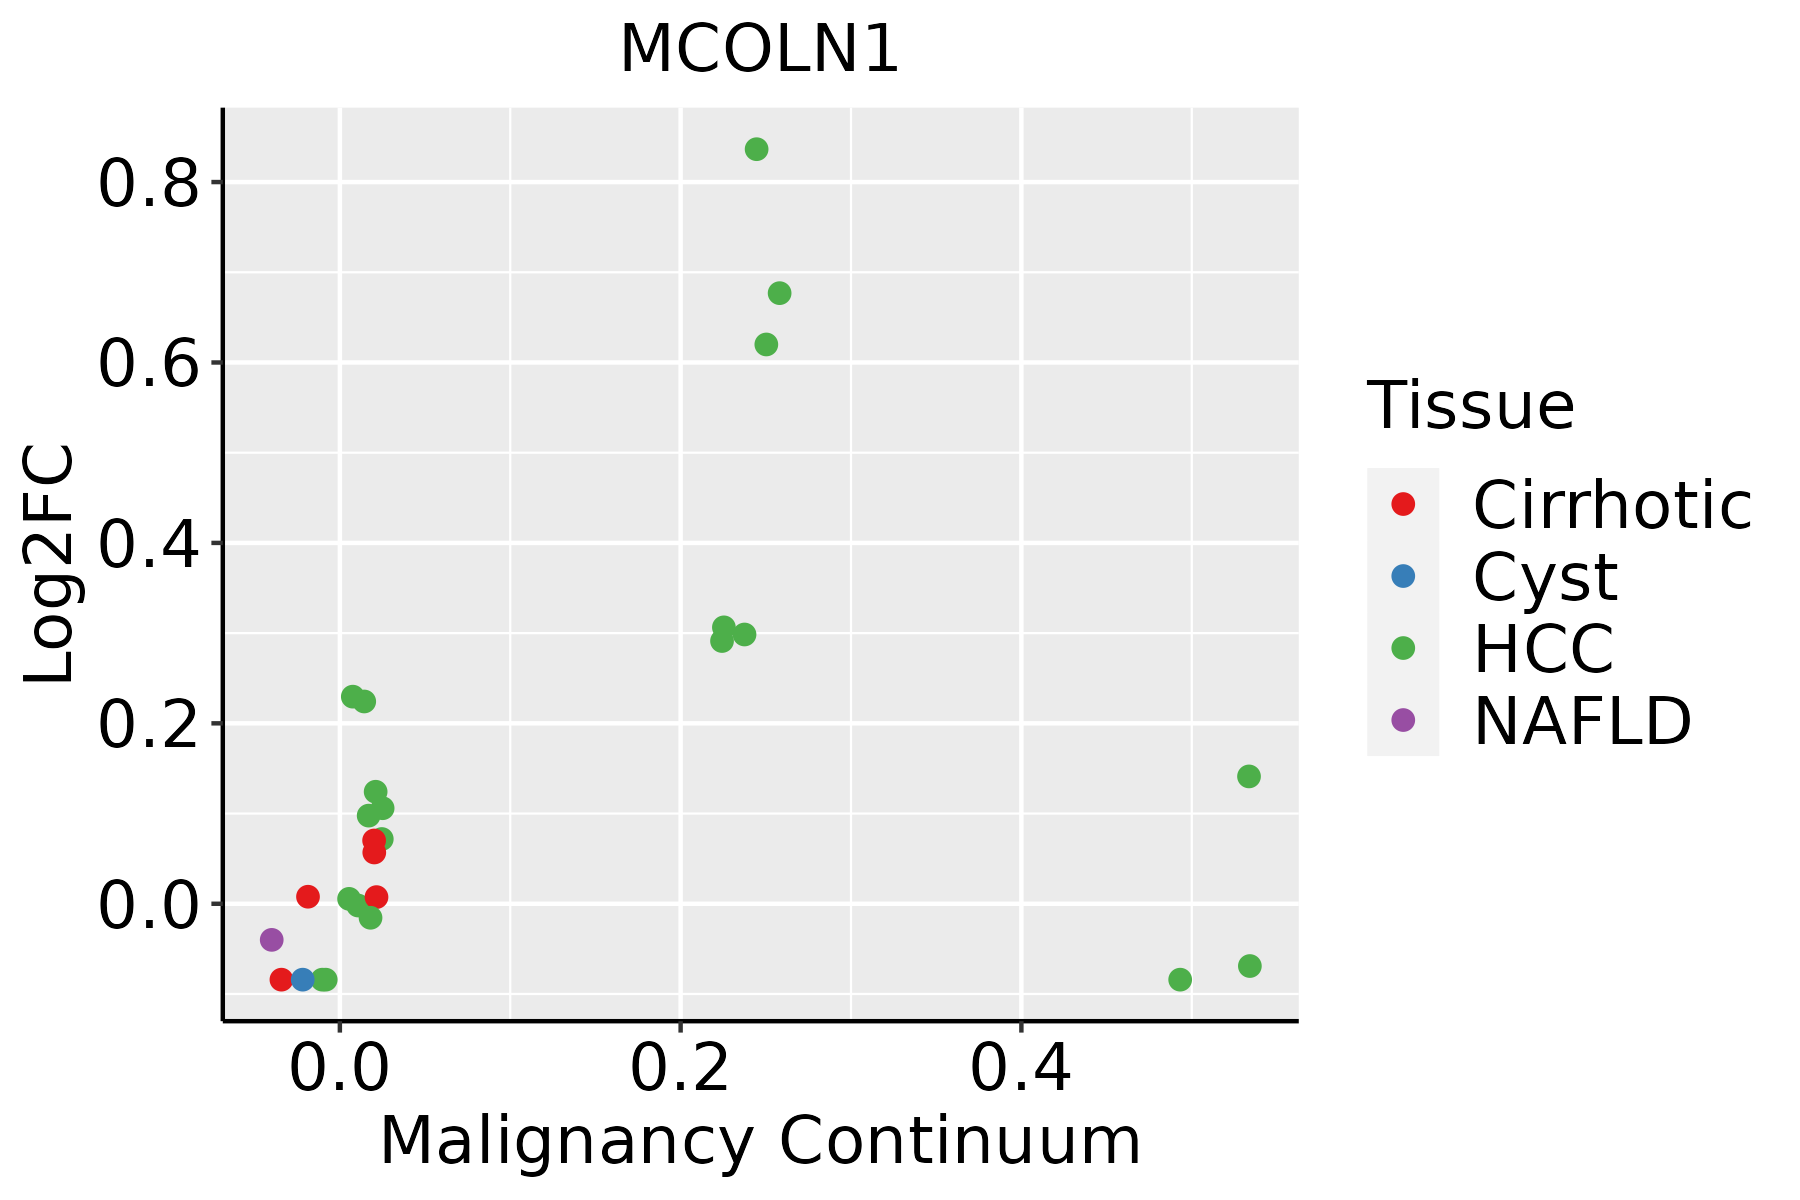 | HCC: Hepatocellular carcinoma |
| NAFLD: Non-alcoholic fatty liver disease | ||
| Oral Cavity |  | EOLP: Erosive Oral lichen planus |
| LP: leukoplakia | ||
| NEOLP: Non-erosive oral lichen planus | ||
| OSCC: Oral squamous cell carcinoma |
| ∗log2FC in expression of this searched gene in stem-like cells from each diseased tissue sample relative to stem-like cells in normal samples in each tissue plotted against the malignancy continuum. Samples are colored based on if they are from different disease stage. |
Top |
Malignant transformation related pathway analysis |
| Find out the enriched GO biological processes and KEGG pathways involved in transition from healthy to precancer to cancer |
| Tissue | Disease Stage | Enriched GO biological Processes |
| Colorectum | AD |  |
| Colorectum | SER |  |
| Colorectum | MSS |  |
| Colorectum | MSI-H |  |
| Colorectum | FAP |  |
| ∗Top 15 enriched GO BP terms are showed in the bar plot of each disease state in each tissue. Each row represents a significant GO biological process which is colored according to the -log10(p.adjust). |
| Page: 1 2 3 4 5 6 7 8 9 |
| GO ID | Tissue | Disease Stage | Description | Gene Ratio | Bg Ratio | pvalue | p.adjust | Count |
| GO:001623617 | Esophagus | ESCC | macroautophagy | 216/8552 | 291/18723 | 1.94e-23 | 4.57e-21 | 216 |
| GO:0022411111 | Esophagus | ESCC | cellular component disassembly | 305/8552 | 443/18723 | 1.94e-23 | 4.57e-21 | 305 |
| GO:003298416 | Esophagus | ESCC | protein-containing complex disassembly | 151/8552 | 224/18723 | 3.45e-11 | 1.15e-09 | 151 |
| GO:007121419 | Esophagus | ESCC | cellular response to abiotic stimulus | 206/8552 | 331/18723 | 7.52e-10 | 1.88e-08 | 206 |
| GO:010400419 | Esophagus | ESCC | cellular response to environmental stimulus | 206/8552 | 331/18723 | 7.52e-10 | 1.88e-08 | 206 |
| GO:0051235110 | Esophagus | ESCC | maintenance of location | 200/8552 | 327/18723 | 1.01e-08 | 2.02e-07 | 200 |
| GO:00973523 | Esophagus | ESCC | autophagosome maturation | 31/8552 | 40/18723 | 4.04e-05 | 3.26e-04 | 31 |
| GO:001003827 | Esophagus | ESCC | response to metal ion | 208/8552 | 373/18723 | 5.02e-05 | 3.90e-04 | 208 |
| GO:0051651111 | Esophagus | ESCC | maintenance of location in cell | 126/8552 | 214/18723 | 6.57e-05 | 5.00e-04 | 126 |
| GO:00512623 | Esophagus | ESCC | protein tetramerization | 54/8552 | 87/18723 | 1.50e-03 | 7.06e-03 | 54 |
| GO:0090382 | Esophagus | ESCC | phagosome maturation | 19/8552 | 25/18723 | 2.03e-03 | 9.08e-03 | 19 |
| GO:007124117 | Esophagus | ESCC | cellular response to inorganic substance | 125/8552 | 226/18723 | 2.17e-03 | 9.67e-03 | 125 |
| GO:00512592 | Esophagus | ESCC | protein complex oligomerization | 130/8552 | 238/18723 | 3.29e-03 | 1.36e-02 | 130 |
| GO:001623621 | Liver | HCC | macroautophagy | 204/7958 | 291/18723 | 8.66e-22 | 1.41e-19 | 204 |
| GO:002241112 | Liver | HCC | cellular component disassembly | 282/7958 | 443/18723 | 1.02e-19 | 1.38e-17 | 282 |
| GO:003298411 | Liver | HCC | protein-containing complex disassembly | 138/7958 | 224/18723 | 5.59e-09 | 1.46e-07 | 138 |
| GO:001003822 | Liver | HCC | response to metal ion | 208/7958 | 373/18723 | 1.35e-07 | 2.56e-06 | 208 |
| GO:005123521 | Liver | HCC | maintenance of location | 185/7958 | 327/18723 | 1.70e-07 | 3.12e-06 | 185 |
| GO:007121421 | Liver | HCC | cellular response to abiotic stimulus | 183/7958 | 331/18723 | 1.59e-06 | 2.26e-05 | 183 |
| GO:010400421 | Liver | HCC | cellular response to environmental stimulus | 183/7958 | 331/18723 | 1.59e-06 | 2.26e-05 | 183 |
| Page: 1 2 3 |
| Pathway ID | Tissue | Disease Stage | Description | Gene Ratio | Bg Ratio | pvalue | p.adjust | qvalue | Count |
| hsa0414222 | Esophagus | ESCC | Lysosome | 102/4205 | 132/8465 | 5.11e-11 | 7.13e-10 | 3.65e-10 | 102 |
| hsa0414232 | Esophagus | ESCC | Lysosome | 102/4205 | 132/8465 | 5.11e-11 | 7.13e-10 | 3.65e-10 | 102 |
| hsa041422 | Liver | HCC | Lysosome | 100/4020 | 132/8465 | 2.32e-11 | 4.31e-10 | 2.40e-10 | 100 |
| hsa041423 | Liver | HCC | Lysosome | 100/4020 | 132/8465 | 2.32e-11 | 4.31e-10 | 2.40e-10 | 100 |
| hsa041425 | Oral cavity | OSCC | Lysosome | 87/3704 | 132/8465 | 1.97e-07 | 1.35e-06 | 6.86e-07 | 87 |
| hsa0414212 | Oral cavity | OSCC | Lysosome | 87/3704 | 132/8465 | 1.97e-07 | 1.35e-06 | 6.86e-07 | 87 |
| hsa0414221 | Oral cavity | LP | Lysosome | 67/2418 | 132/8465 | 5.13e-08 | 7.77e-07 | 5.01e-07 | 67 |
| hsa0414231 | Oral cavity | LP | Lysosome | 67/2418 | 132/8465 | 5.13e-08 | 7.77e-07 | 5.01e-07 | 67 |
| Page: 1 |
Top |
Cell-cell communication analysis |
| Identification of potential cell-cell interactions between two cell types and their ligand-receptor pairs for different disease states |
| Ligand | Receptor | LRpair | Pathway | Tissue | Disease Stage |
| Page: 1 |
Top |
Single-cell gene regulatory network inference analysis |
| Find out the significant the regulons (TFs) and the target genes of each regulon across cell types for different disease states |
| TF | Cell Type | Tissue | Disease Stage | Target Gene | RSS | Regulon Activity |
| ∗The dot plots of a searched regulon are shown for all cell subpopulations in each disease state of each tissue based on the regulon specific score inferred using pySCENIC and by calculating the average expression. |
| Page: 1 |
Top |
Somatic mutation of malignant transformation related genes |
| Annotation of somatic variants for genes involved in malignant transformation |
| Hugo Symbol | Variant Class | Variant Classification | dbSNP RS | HGVSc | HGVSp | HGVSp Short | SWISSPROT | BIOTYPE | SIFT | PolyPhen | Tumor Sample Barcode | Tissue | Histology | Sex | Age | Stage | Therapy Types | Drugs | Outcome |
| MCOLN1 | SNV | Missense_Mutation | c.1711N>G | p.Pro571Ala | p.P571A | Q9GZU1 | protein_coding | tolerated(0.62) | benign(0) | TCGA-A2-A0D2-01 | Breast | breast invasive carcinoma | Female | <65 | I/II | Chemotherapy | adriamycin | SD | |
| MCOLN1 | SNV | Missense_Mutation | novel | c.1373N>T | p.Ser458Phe | p.S458F | Q9GZU1 | protein_coding | deleterious(0) | possibly_damaging(0.674) | TCGA-AC-A4ZE-01 | Breast | breast invasive carcinoma | Female | <65 | I/II | Unknown | Unknown | SD |
| MCOLN1 | SNV | Missense_Mutation | c.103C>A | p.Pro35Thr | p.P35T | Q9GZU1 | protein_coding | tolerated(0.42) | benign(0.001) | TCGA-AO-A124-01 | Breast | breast invasive carcinoma | Female | <65 | I/II | Chemotherapy | doxorubicin | SD | |
| MCOLN1 | SNV | Missense_Mutation | c.1255C>T | p.Arg419Trp | p.R419W | Q9GZU1 | protein_coding | deleterious(0) | probably_damaging(0.987) | TCGA-AO-A128-01 | Breast | breast invasive carcinoma | Female | <65 | I/II | Chemotherapy | doxorubicin | SD | |
| MCOLN1 | SNV | Missense_Mutation | novel | c.1040G>T | p.Arg347Leu | p.R347L | Q9GZU1 | protein_coding | deleterious(0) | benign(0.382) | TCGA-AR-A1AT-01 | Breast | breast invasive carcinoma | Female | <65 | I/II | Hormone Therapy | anastrozole | SD |
| MCOLN1 | SNV | Missense_Mutation | c.150N>A | p.Met50Ile | p.M50I | Q9GZU1 | protein_coding | deleterious(0) | probably_damaging(0.999) | TCGA-D8-A27G-01 | Breast | breast invasive carcinoma | Female | >=65 | I/II | Unknown | Unknown | SD | |
| MCOLN1 | SNV | Missense_Mutation | novel | c.907N>T | p.Val303Leu | p.V303L | Q9GZU1 | protein_coding | tolerated(0.34) | benign(0.001) | TCGA-VS-A8QF-01 | Cervix | cervical & endocervical cancer | Female | <65 | I/II | Chemotherapy | cisplatin | CR |
| MCOLN1 | SNV | Missense_Mutation | rs760754683 | c.952C>T | p.Arg318Cys | p.R318C | Q9GZU1 | protein_coding | deleterious(0) | probably_damaging(0.997) | TCGA-AA-3864-01 | Colorectum | colon adenocarcinoma | Male | >=65 | I/II | Unknown | Unknown | SD |
| MCOLN1 | SNV | Missense_Mutation | rs368837514 | c.1013G>A | p.Arg338Gln | p.R338Q | Q9GZU1 | protein_coding | deleterious(0.03) | benign(0) | TCGA-AA-3864-01 | Colorectum | colon adenocarcinoma | Male | >=65 | I/II | Unknown | Unknown | SD |
| MCOLN1 | SNV | Missense_Mutation | rs760754683 | c.952N>T | p.Arg318Cys | p.R318C | Q9GZU1 | protein_coding | deleterious(0) | probably_damaging(0.997) | TCGA-AA-3966-01 | Colorectum | colon adenocarcinoma | Female | >=65 | I/II | Unknown | Unknown | SD |
| Page: 1 2 3 4 5 6 7 8 |
Top |
Related drugs of malignant transformation related genes |
| Identification of chemicals and drugs interact with genes involved in malignant transfromation |
| (DGIdb 4.0) |
| Entrez ID | Symbol | Category | Interaction Types | Drug Claim Name | Drug Name | PMIDs |
| 57192 | MCOLN1 | ION CHANNEL, DRUGGABLE GENOME, TRANSPORTER | opioids | 31362332 | ||
| 57192 | MCOLN1 | ION CHANNEL, DRUGGABLE GENOME, TRANSPORTER | activator | 178103003 | ||
| 57192 | MCOLN1 | ION CHANNEL, DRUGGABLE GENOME, TRANSPORTER | activator | 178103002 | ||
| 57192 | MCOLN1 | ION CHANNEL, DRUGGABLE GENOME, TRANSPORTER | activator | 178100233 | ||
| 57192 | MCOLN1 | ION CHANNEL, DRUGGABLE GENOME, TRANSPORTER | activator | 354702256 | ||
| 57192 | MCOLN1 | ION CHANNEL, DRUGGABLE GENOME, TRANSPORTER | activator | 178103005 |
| Page: 1 |

Copyright 2023-Present -The University of Texas Health Science Center at Houston |