
|
|||||
|
 | |
| |
| |
| |
| |
| |
|
Gene: MCMBP |
Gene summary for MCMBP |
| Gene information | Species | Human | Gene symbol | MCMBP | Gene ID | 79892 |
| Gene name | minichromosome maintenance complex binding protein | |
| Gene Alias | C10orf119 | |
| Cytomap | 10q26.11 | |
| Gene Type | protein-coding | GO ID | GO:0000819 | UniProtAcc | A0A0S2Z5P5 |
Top |
Malignant transformation analysis |
| Identification of the aberrant gene expression in precancerous and cancerous lesions by comparing the gene expression of stem-like cells in diseased tissues with normal stem cells |
| Entrez ID | Symbol | Replicates | Species | Organ | Tissue | Adj P-value | Log2FC | Malignancy |
| 79892 | MCMBP | LZE4T | Human | Esophagus | ESCC | 2.39e-05 | -9.19e-02 | 0.0811 |
| 79892 | MCMBP | LZE8T | Human | Esophagus | ESCC | 5.54e-04 | -1.02e-01 | 0.067 |
| 79892 | MCMBP | LZE24T | Human | Esophagus | ESCC | 8.94e-09 | 1.80e-01 | 0.0596 |
| 79892 | MCMBP | P1T-E | Human | Esophagus | ESCC | 1.08e-02 | 1.42e-01 | 0.0875 |
| 79892 | MCMBP | P2T-E | Human | Esophagus | ESCC | 4.52e-23 | 4.06e-01 | 0.1177 |
| 79892 | MCMBP | P4T-E | Human | Esophagus | ESCC | 3.94e-11 | 5.23e-01 | 0.1323 |
| 79892 | MCMBP | P5T-E | Human | Esophagus | ESCC | 1.54e-22 | 4.17e-01 | 0.1327 |
| 79892 | MCMBP | P8T-E | Human | Esophagus | ESCC | 6.64e-17 | 1.52e-01 | 0.0889 |
| 79892 | MCMBP | P9T-E | Human | Esophagus | ESCC | 8.91e-07 | 1.09e-02 | 0.1131 |
| 79892 | MCMBP | P10T-E | Human | Esophagus | ESCC | 1.90e-17 | 2.78e-02 | 0.116 |
| 79892 | MCMBP | P11T-E | Human | Esophagus | ESCC | 2.48e-09 | 4.72e-01 | 0.1426 |
| 79892 | MCMBP | P12T-E | Human | Esophagus | ESCC | 9.62e-26 | 4.54e-01 | 0.1122 |
| 79892 | MCMBP | P15T-E | Human | Esophagus | ESCC | 4.23e-14 | 3.03e-01 | 0.1149 |
| 79892 | MCMBP | P16T-E | Human | Esophagus | ESCC | 2.27e-19 | 3.72e-01 | 0.1153 |
| 79892 | MCMBP | P17T-E | Human | Esophagus | ESCC | 1.17e-02 | 1.78e-01 | 0.1278 |
| 79892 | MCMBP | P19T-E | Human | Esophagus | ESCC | 1.81e-05 | 4.25e-01 | 0.1662 |
| 79892 | MCMBP | P20T-E | Human | Esophagus | ESCC | 8.55e-13 | 2.11e-02 | 0.1124 |
| 79892 | MCMBP | P21T-E | Human | Esophagus | ESCC | 1.21e-22 | 1.31e-01 | 0.1617 |
| 79892 | MCMBP | P22T-E | Human | Esophagus | ESCC | 6.17e-17 | 6.04e-02 | 0.1236 |
| 79892 | MCMBP | P23T-E | Human | Esophagus | ESCC | 8.28e-20 | 4.50e-01 | 0.108 |
| Page: 1 2 3 4 5 |
| Tissue | Expression Dynamics | Abbreviation |
| Esophagus | 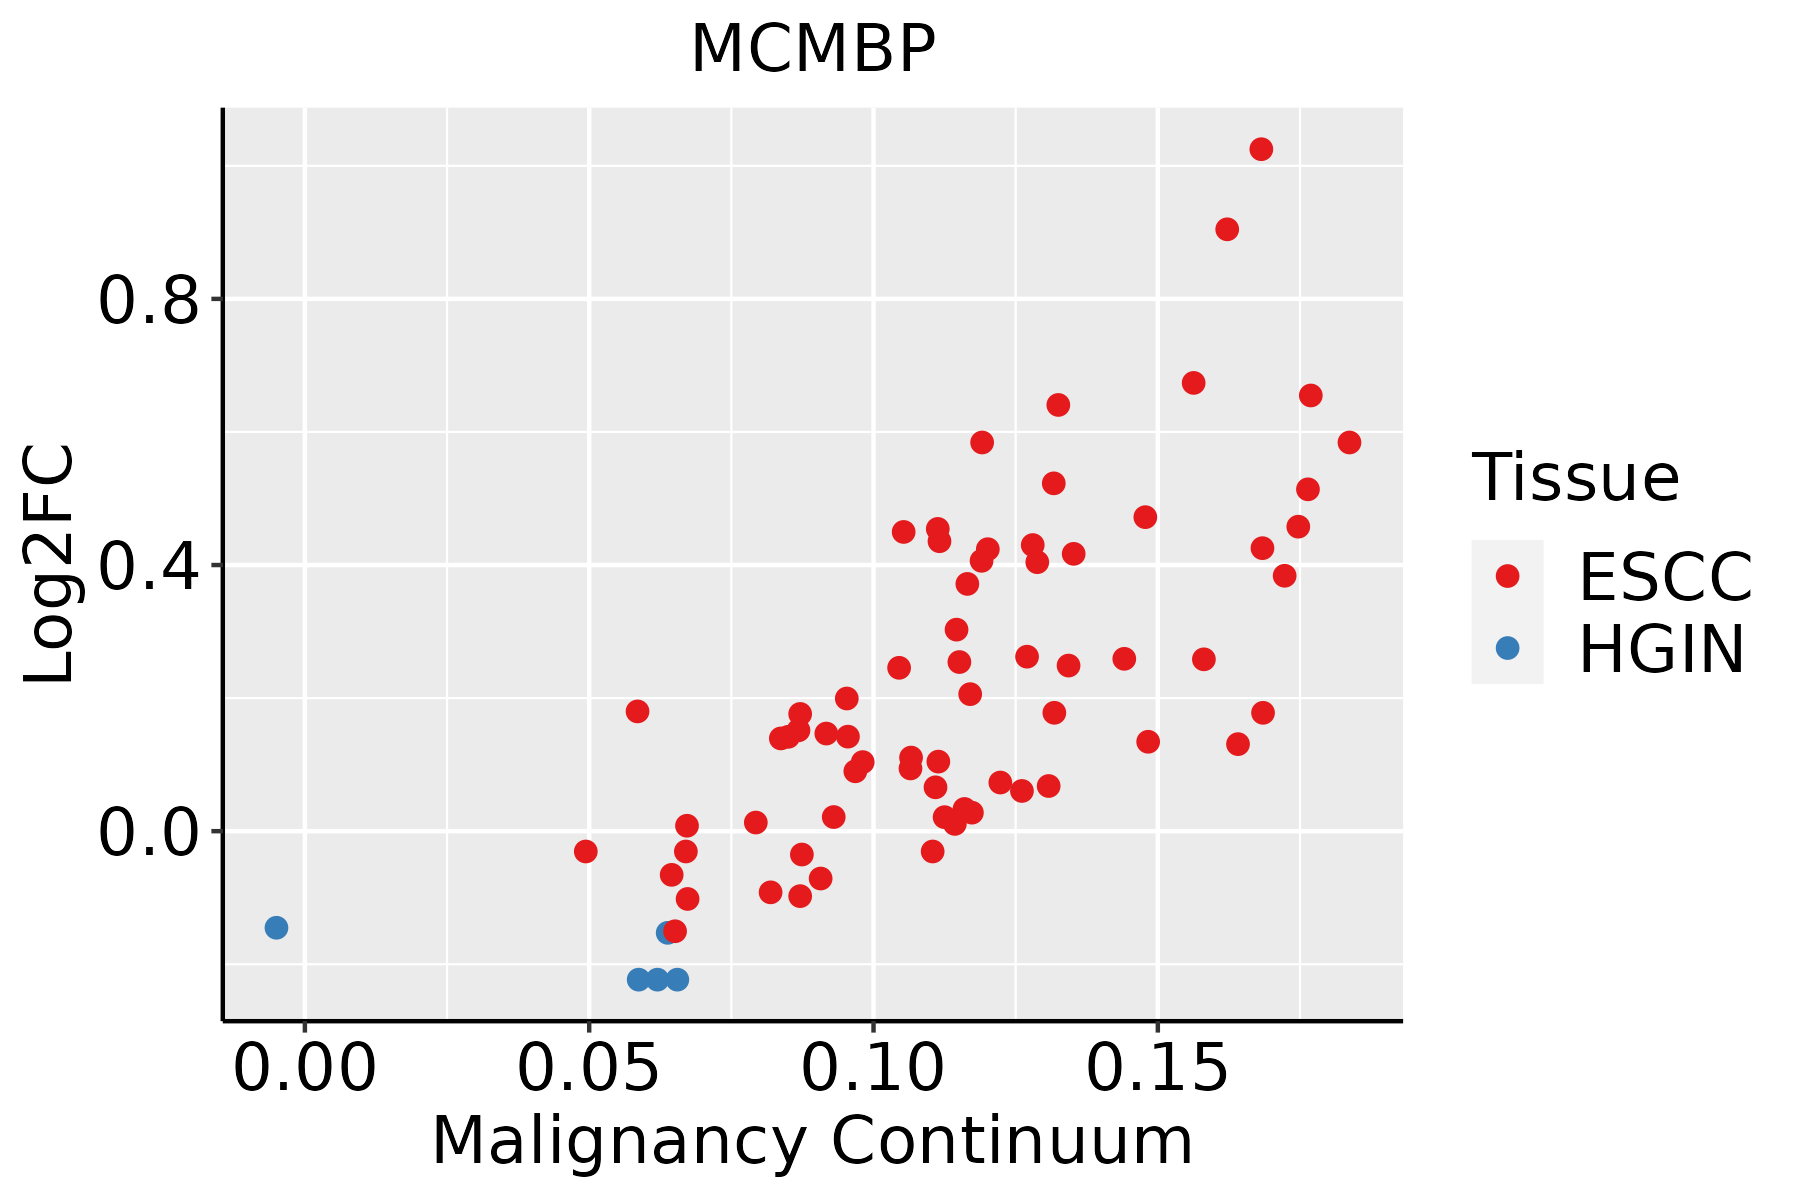 | ESCC: Esophageal squamous cell carcinoma |
| HGIN: High-grade intraepithelial neoplasias | ||
| LGIN: Low-grade intraepithelial neoplasias | ||
| Liver | 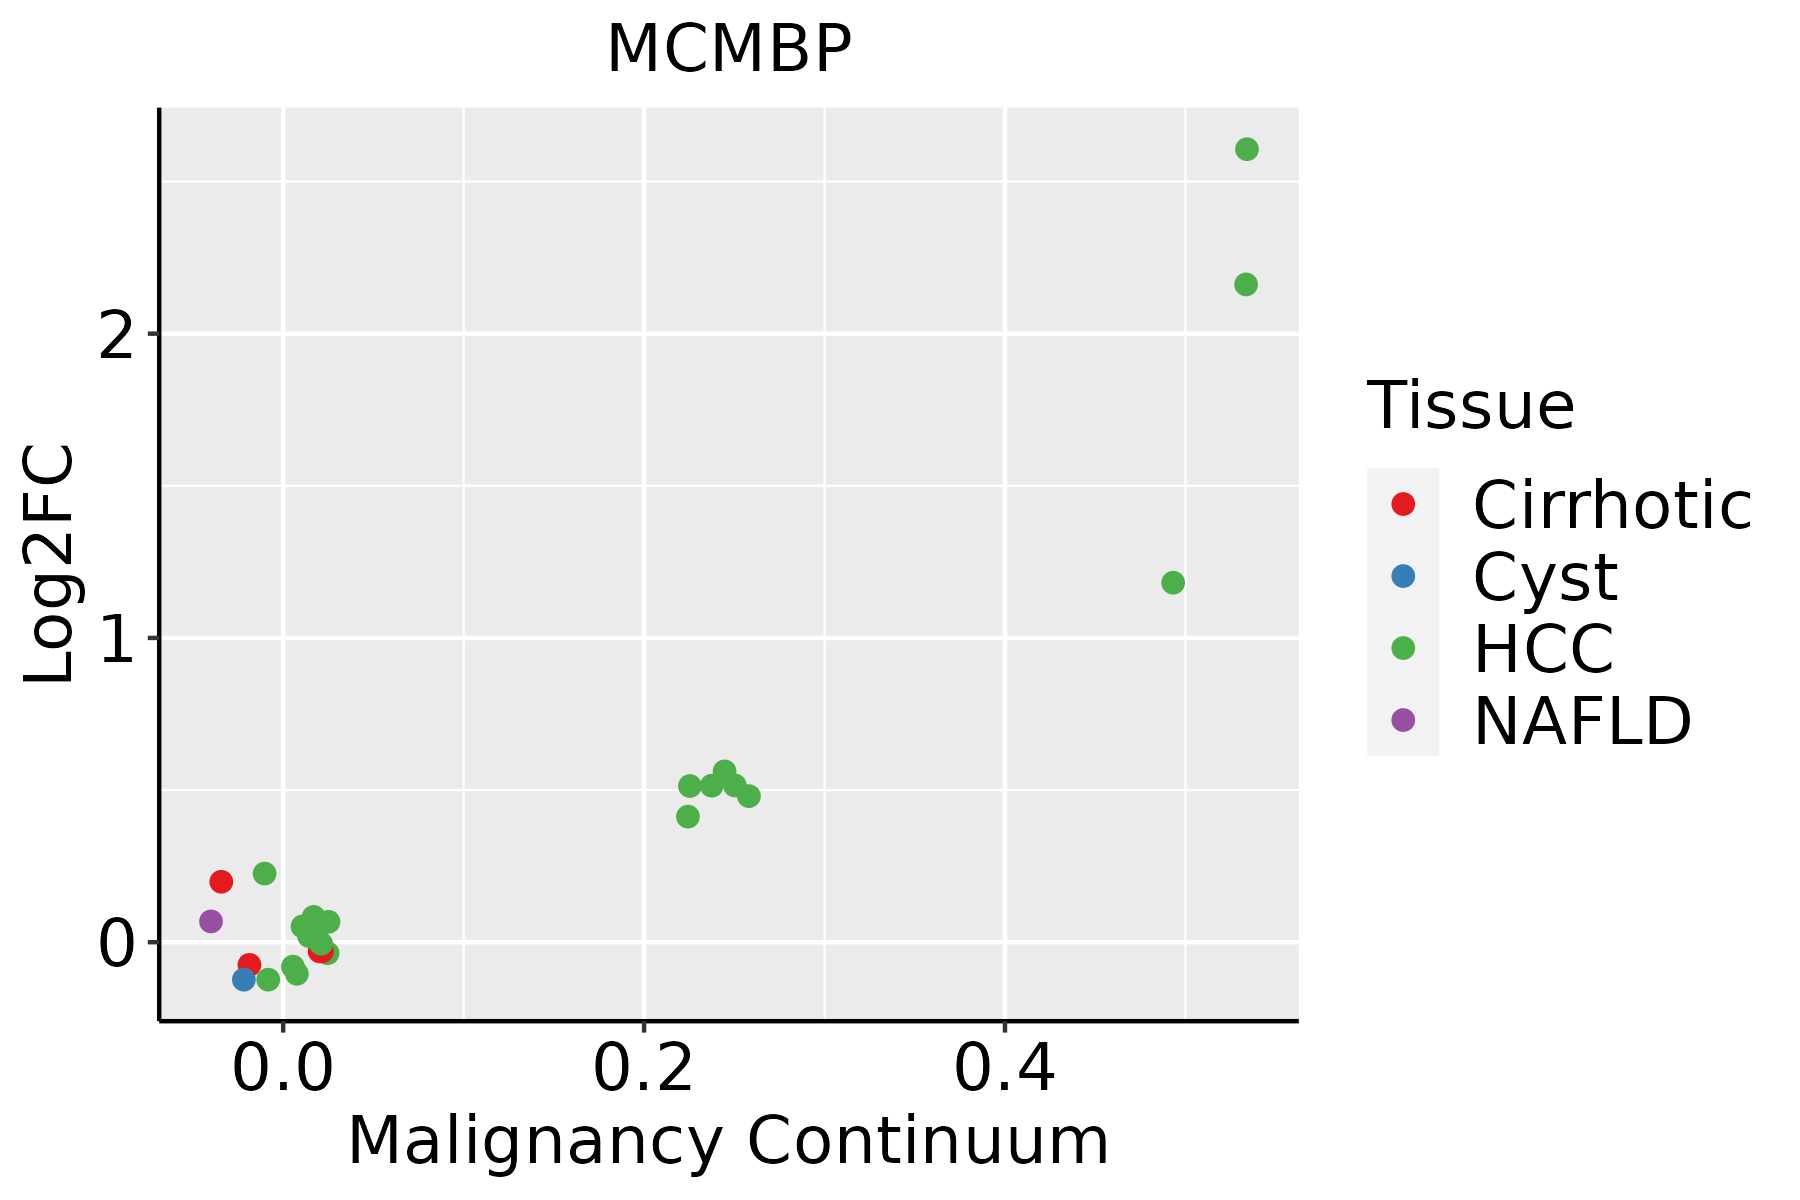 | HCC: Hepatocellular carcinoma |
| NAFLD: Non-alcoholic fatty liver disease | ||
| Oral Cavity |  | EOLP: Erosive Oral lichen planus |
| LP: leukoplakia | ||
| NEOLP: Non-erosive oral lichen planus | ||
| OSCC: Oral squamous cell carcinoma | ||
| Skin | 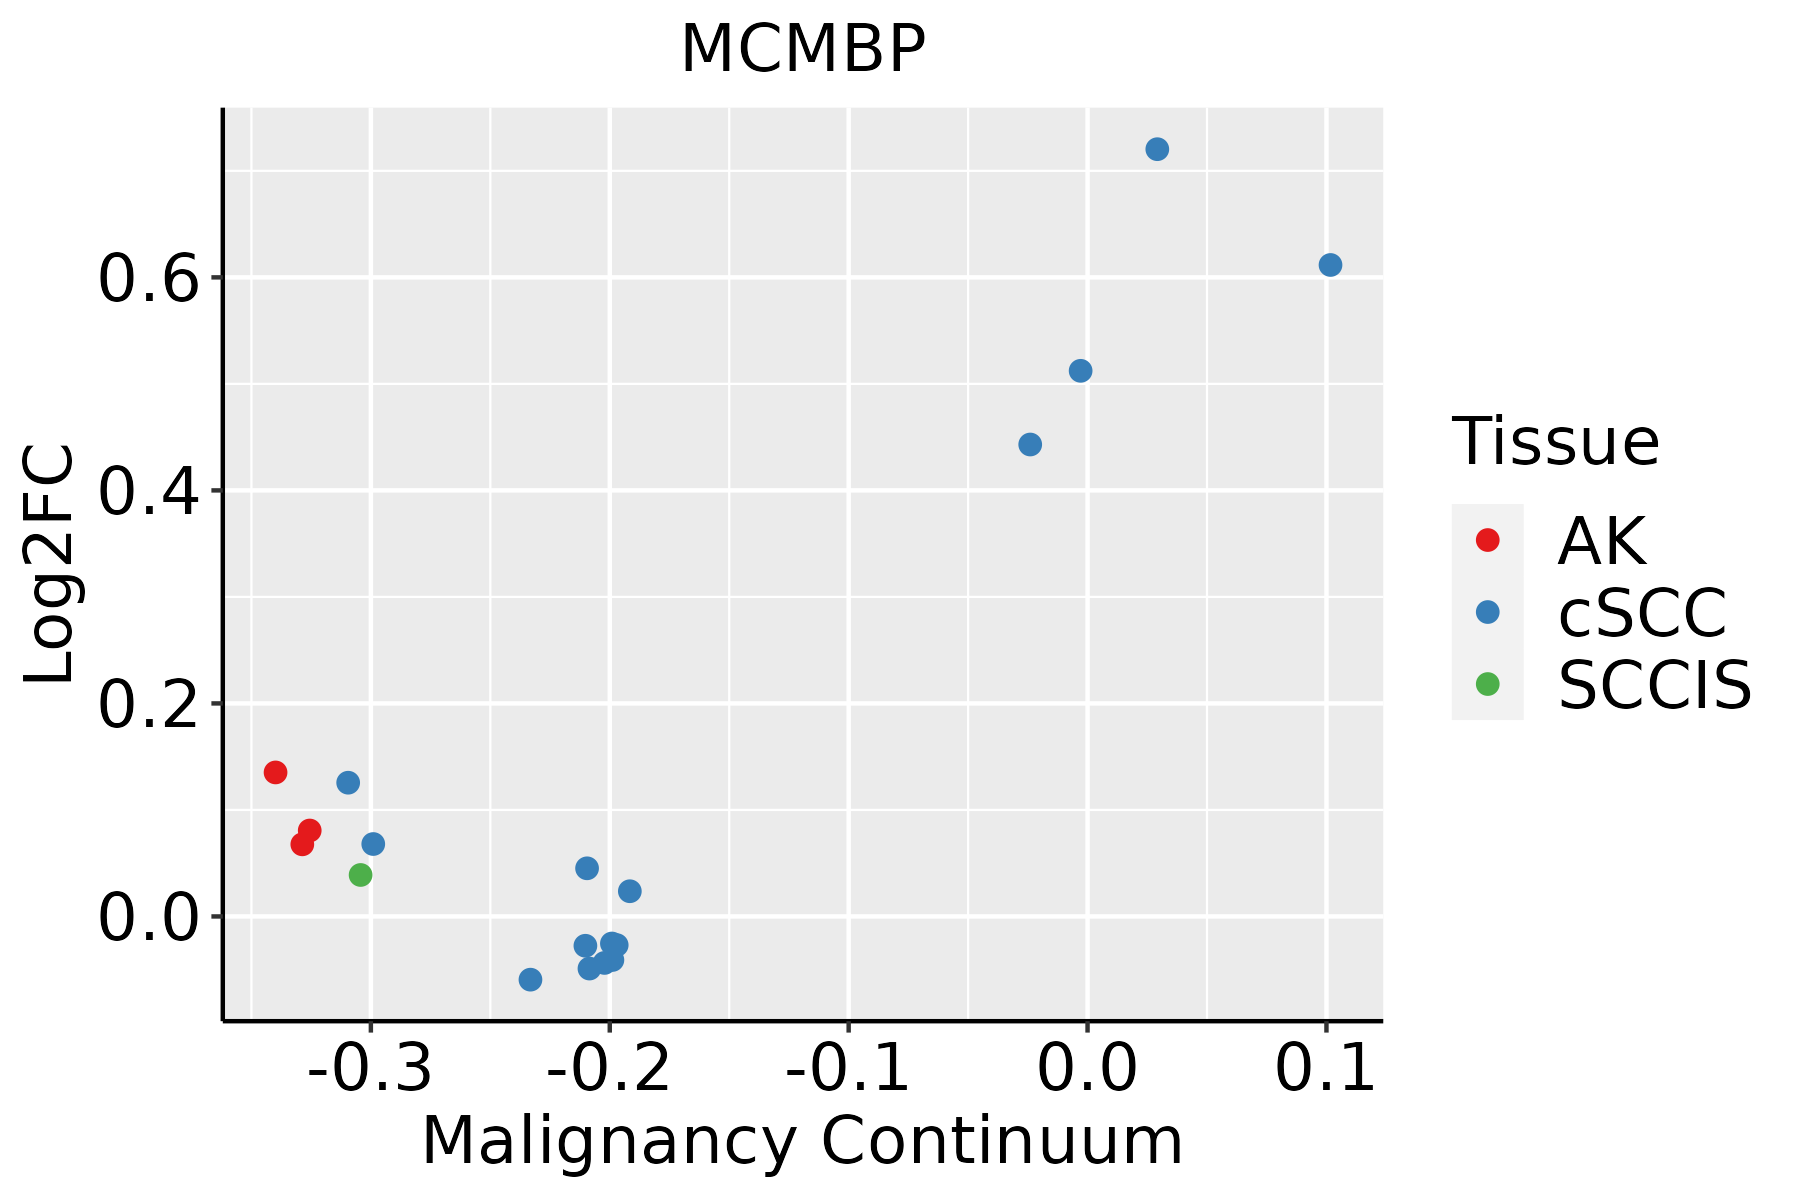 | AK: Actinic keratosis |
| cSCC: Cutaneous squamous cell carcinoma | ||
| SCCIS:squamous cell carcinoma in situ |
| ∗log2FC in expression of this searched gene in stem-like cells from each diseased tissue sample relative to stem-like cells in normal samples in each tissue plotted against the malignancy continuum. Samples are colored based on if they are from different disease stage. |
Top |
Malignant transformation related pathway analysis |
| Find out the enriched GO biological processes and KEGG pathways involved in transition from healthy to precancer to cancer |
| Tissue | Disease Stage | Enriched GO biological Processes |
| Colorectum | AD |  |
| Colorectum | SER |  |
| Colorectum | MSS |  |
| Colorectum | MSI-H |  |
| Colorectum | FAP |  |
| ∗Top 15 enriched GO BP terms are showed in the bar plot of each disease state in each tissue. Each row represents a significant GO biological process which is colored according to the -log10(p.adjust). |
| Page: 1 2 3 4 5 6 7 8 9 |
| GO ID | Tissue | Disease Stage | Description | Gene Ratio | Bg Ratio | pvalue | p.adjust | Count |
| GO:00008194 | Esophagus | ESCC | sister chromatid segregation | 157/8552 | 202/18723 | 8.41e-21 | 1.33e-18 | 157 |
| GO:000705911 | Esophagus | ESCC | chromosome segregation | 238/8552 | 346/18723 | 1.72e-18 | 1.82e-16 | 238 |
| GO:00062604 | Esophagus | ESCC | DNA replication | 181/8552 | 260/18723 | 3.55e-15 | 2.05e-13 | 181 |
| GO:00988133 | Esophagus | ESCC | nuclear chromosome segregation | 187/8552 | 281/18723 | 1.00e-12 | 4.36e-11 | 187 |
| GO:00062612 | Esophagus | ESCC | DNA-dependent DNA replication | 100/8552 | 151/18723 | 2.61e-07 | 3.94e-06 | 100 |
| GO:00070627 | Esophagus | ESCC | sister chromatid cohesion | 40/8552 | 62/18723 | 2.14e-03 | 9.54e-03 | 40 |
| GO:00008191 | Liver | HCC | sister chromatid segregation | 128/7958 | 202/18723 | 1.59e-09 | 4.73e-08 | 128 |
| GO:0007059 | Liver | HCC | chromosome segregation | 197/7958 | 346/18723 | 3.57e-08 | 7.87e-07 | 197 |
| GO:0098813 | Liver | HCC | nuclear chromosome segregation | 157/7958 | 281/18723 | 3.82e-06 | 4.95e-05 | 157 |
| GO:00062601 | Liver | HCC | DNA replication | 146/7958 | 260/18723 | 5.68e-06 | 7.02e-05 | 146 |
| GO:00070624 | Liver | HCC | sister chromatid cohesion | 38/7958 | 62/18723 | 2.18e-03 | 1.09e-02 | 38 |
| GO:0006261 | Liver | HCC | DNA-dependent DNA replication | 80/7958 | 151/18723 | 5.91e-03 | 2.44e-02 | 80 |
| GO:00008193 | Oral cavity | OSCC | sister chromatid segregation | 135/7305 | 202/18723 | 8.88e-16 | 6.52e-14 | 135 |
| GO:00070592 | Oral cavity | OSCC | chromosome segregation | 206/7305 | 346/18723 | 5.82e-15 | 3.76e-13 | 206 |
| GO:00062603 | Oral cavity | OSCC | DNA replication | 159/7305 | 260/18723 | 3.25e-13 | 1.59e-11 | 159 |
| GO:00988132 | Oral cavity | OSCC | nuclear chromosome segregation | 162/7305 | 281/18723 | 1.56e-10 | 4.56e-09 | 162 |
| GO:00062611 | Oral cavity | OSCC | DNA-dependent DNA replication | 84/7305 | 151/18723 | 2.46e-05 | 2.30e-04 | 84 |
| GO:00070626 | Oral cavity | OSCC | sister chromatid cohesion | 37/7305 | 62/18723 | 7.79e-04 | 4.23e-03 | 37 |
| GO:000626011 | Oral cavity | LP | DNA replication | 97/4623 | 260/18723 | 3.67e-06 | 7.75e-05 | 97 |
| GO:00070591 | Oral cavity | LP | chromosome segregation | 117/4623 | 346/18723 | 7.61e-05 | 9.91e-04 | 117 |
| Page: 1 2 |
| Pathway ID | Tissue | Disease Stage | Description | Gene Ratio | Bg Ratio | pvalue | p.adjust | qvalue | Count |
| Page: 1 |
Top |
Cell-cell communication analysis |
| Identification of potential cell-cell interactions between two cell types and their ligand-receptor pairs for different disease states |
| Ligand | Receptor | LRpair | Pathway | Tissue | Disease Stage |
| Page: 1 |
Top |
Single-cell gene regulatory network inference analysis |
| Find out the significant the regulons (TFs) and the target genes of each regulon across cell types for different disease states |
| TF | Cell Type | Tissue | Disease Stage | Target Gene | RSS | Regulon Activity |
| ∗The dot plots of a searched regulon are shown for all cell subpopulations in each disease state of each tissue based on the regulon specific score inferred using pySCENIC and by calculating the average expression. |
| Page: 1 |
Top |
Somatic mutation of malignant transformation related genes |
| Annotation of somatic variants for genes involved in malignant transformation |
| Hugo Symbol | Variant Class | Variant Classification | dbSNP RS | HGVSc | HGVSp | HGVSp Short | SWISSPROT | BIOTYPE | SIFT | PolyPhen | Tumor Sample Barcode | Tissue | Histology | Sex | Age | Stage | Therapy Types | Drugs | Outcome |
| MCMBP | SNV | Missense_Mutation | novel | c.1880N>A | p.Arg627Lys | p.R627K | Q9BTE3 | protein_coding | deleterious(0) | possibly_damaging(0.609) | TCGA-A7-A6VY-01 | Breast | breast invasive carcinoma | Female | <65 | I/II | Chemotherapy | cyclophosphamide | CR |
| MCMBP | SNV | Missense_Mutation | c.1034N>G | p.Ser345Cys | p.S345C | Q9BTE3 | protein_coding | deleterious(0.02) | possibly_damaging(0.747) | TCGA-AN-A0AJ-01 | Breast | breast invasive carcinoma | Female | >=65 | I/II | Unknown | Unknown | SD | |
| MCMBP | SNV | Missense_Mutation | rs745417954 | c.1742N>A | p.Arg581Gln | p.R581Q | Q9BTE3 | protein_coding | deleterious(0) | probably_damaging(0.998) | TCGA-AO-A0JI-01 | Breast | breast invasive carcinoma | Female | <65 | I/II | Chemotherapy | cyclophosphamide | SD |
| MCMBP | SNV | Missense_Mutation | novel | c.736G>C | p.Asp246His | p.D246H | Q9BTE3 | protein_coding | deleterious(0.02) | benign(0.201) | TCGA-BH-A0B6-01 | Breast | breast invasive carcinoma | Female | <65 | I/II | Unknown | Unknown | SD |
| MCMBP | insertion | Nonsense_Mutation | novel | c.618_619insCTAAGTCCATCATGACAGAA | p.Glu207LeufsTer5 | p.E207Lfs*5 | Q9BTE3 | protein_coding | TCGA-AN-A046-01 | Breast | breast invasive carcinoma | Female | >=65 | I/II | Unknown | Unknown | SD | ||
| MCMBP | deletion | Frame_Shift_Del | novel | c.1913delA | p.Asn638MetfsTer21 | p.N638Mfs*21 | Q9BTE3 | protein_coding | TCGA-D8-A27V-01 | Breast | breast invasive carcinoma | Female | <65 | I/II | Hormone Therapy | tamoxiphen | SD | ||
| MCMBP | SNV | Missense_Mutation | novel | c.788N>T | p.Ser263Phe | p.S263F | Q9BTE3 | protein_coding | deleterious(0) | probably_damaging(0.998) | TCGA-AA-3984-01 | Colorectum | colon adenocarcinoma | Female | <65 | I/II | Unknown | Unknown | SD |
| MCMBP | SNV | Missense_Mutation | c.160N>A | p.Glu54Lys | p.E54K | Q9BTE3 | protein_coding | deleterious(0.02) | benign(0.041) | TCGA-AA-A010-01 | Colorectum | colon adenocarcinoma | Female | <65 | I/II | Chemotherapy | folinic | CR | |
| MCMBP | SNV | Missense_Mutation | c.1526C>T | p.Ser509Leu | p.S509L | Q9BTE3 | protein_coding | deleterious(0) | probably_damaging(0.998) | TCGA-AZ-4315-01 | Colorectum | colon adenocarcinoma | Male | <65 | I/II | Unknown | Unknown | SD | |
| MCMBP | SNV | Missense_Mutation | novel | c.653C>A | p.Ser218Tyr | p.S218Y | Q9BTE3 | protein_coding | tolerated(0.07) | benign(0.034) | TCGA-AZ-4315-01 | Colorectum | colon adenocarcinoma | Male | <65 | I/II | Unknown | Unknown | SD |
| Page: 1 2 3 4 5 6 |
Top |
Related drugs of malignant transformation related genes |
| Identification of chemicals and drugs interact with genes involved in malignant transfromation |
| (DGIdb 4.0) |
| Entrez ID | Symbol | Category | Interaction Types | Drug Claim Name | Drug Name | PMIDs |
| Page: 1 |

Copyright 2023-Present -The University of Texas Health Science Center at Houston |