
|
|||||
|
 | |
| |
| |
| |
| |
| |
|
Gene: MCM4 |
Gene summary for MCM4 |
| Gene information | Species | Human | Gene symbol | MCM4 | Gene ID | 4173 |
| Gene name | minichromosome maintenance complex component 4 | |
| Gene Alias | CDC21 | |
| Cytomap | 8q11.21 | |
| Gene Type | protein-coding | GO ID | GO:0000278 | UniProtAcc | B4DLA6 |
Top |
Malignant transformation analysis |
| Identification of the aberrant gene expression in precancerous and cancerous lesions by comparing the gene expression of stem-like cells in diseased tissues with normal stem cells |
| Entrez ID | Symbol | Replicates | Species | Organ | Tissue | Adj P-value | Log2FC | Malignancy |
| 4173 | MCM4 | HTA11_1938_2000001011 | Human | Colorectum | AD | 5.36e-06 | 3.38e-01 | -0.0811 |
| 4173 | MCM4 | HTA11_78_2000001011 | Human | Colorectum | AD | 2.32e-02 | 2.20e-01 | -0.1088 |
| 4173 | MCM4 | HTA11_347_2000001011 | Human | Colorectum | AD | 2.07e-06 | 2.47e-01 | -0.1954 |
| 4173 | MCM4 | HTA11_1391_2000001011 | Human | Colorectum | AD | 3.07e-09 | 4.60e-01 | -0.059 |
| 4173 | MCM4 | HTA11_7663_2000001011 | Human | Colorectum | SER | 8.62e-03 | 2.45e-01 | 0.0131 |
| 4173 | MCM4 | HTA11_6801_2000001011 | Human | Colorectum | SER | 7.48e-04 | 5.81e-01 | 0.0171 |
| 4173 | MCM4 | HTA11_99999970781_79442 | Human | Colorectum | MSS | 3.94e-06 | 3.50e-01 | 0.294 |
| 4173 | MCM4 | LZE2T | Human | Esophagus | ESCC | 1.62e-07 | 1.08e+00 | 0.082 |
| 4173 | MCM4 | LZE7T | Human | Esophagus | ESCC | 4.27e-04 | 2.66e-01 | 0.0667 |
| 4173 | MCM4 | LZE20T | Human | Esophagus | ESCC | 2.02e-05 | 2.82e-01 | 0.0662 |
| 4173 | MCM4 | LZE24T | Human | Esophagus | ESCC | 2.39e-07 | 2.68e-01 | 0.0596 |
| 4173 | MCM4 | LZE21T | Human | Esophagus | ESCC | 1.34e-03 | 3.12e-01 | 0.0655 |
| 4173 | MCM4 | LZE6T | Human | Esophagus | ESCC | 2.08e-02 | 2.51e-01 | 0.0845 |
| 4173 | MCM4 | P1T-E | Human | Esophagus | ESCC | 2.37e-05 | 4.08e-01 | 0.0875 |
| 4173 | MCM4 | P2T-E | Human | Esophagus | ESCC | 7.75e-37 | 9.13e-01 | 0.1177 |
| 4173 | MCM4 | P4T-E | Human | Esophagus | ESCC | 6.68e-23 | 6.64e-01 | 0.1323 |
| 4173 | MCM4 | P5T-E | Human | Esophagus | ESCC | 1.49e-11 | 2.08e-01 | 0.1327 |
| 4173 | MCM4 | P8T-E | Human | Esophagus | ESCC | 3.42e-04 | 2.48e-01 | 0.0889 |
| 4173 | MCM4 | P9T-E | Human | Esophagus | ESCC | 2.12e-09 | 2.33e-01 | 0.1131 |
| 4173 | MCM4 | P10T-E | Human | Esophagus | ESCC | 6.78e-13 | 4.01e-01 | 0.116 |
| Page: 1 2 3 4 5 6 |
| Tissue | Expression Dynamics | Abbreviation |
| Colorectum (GSE201348) | 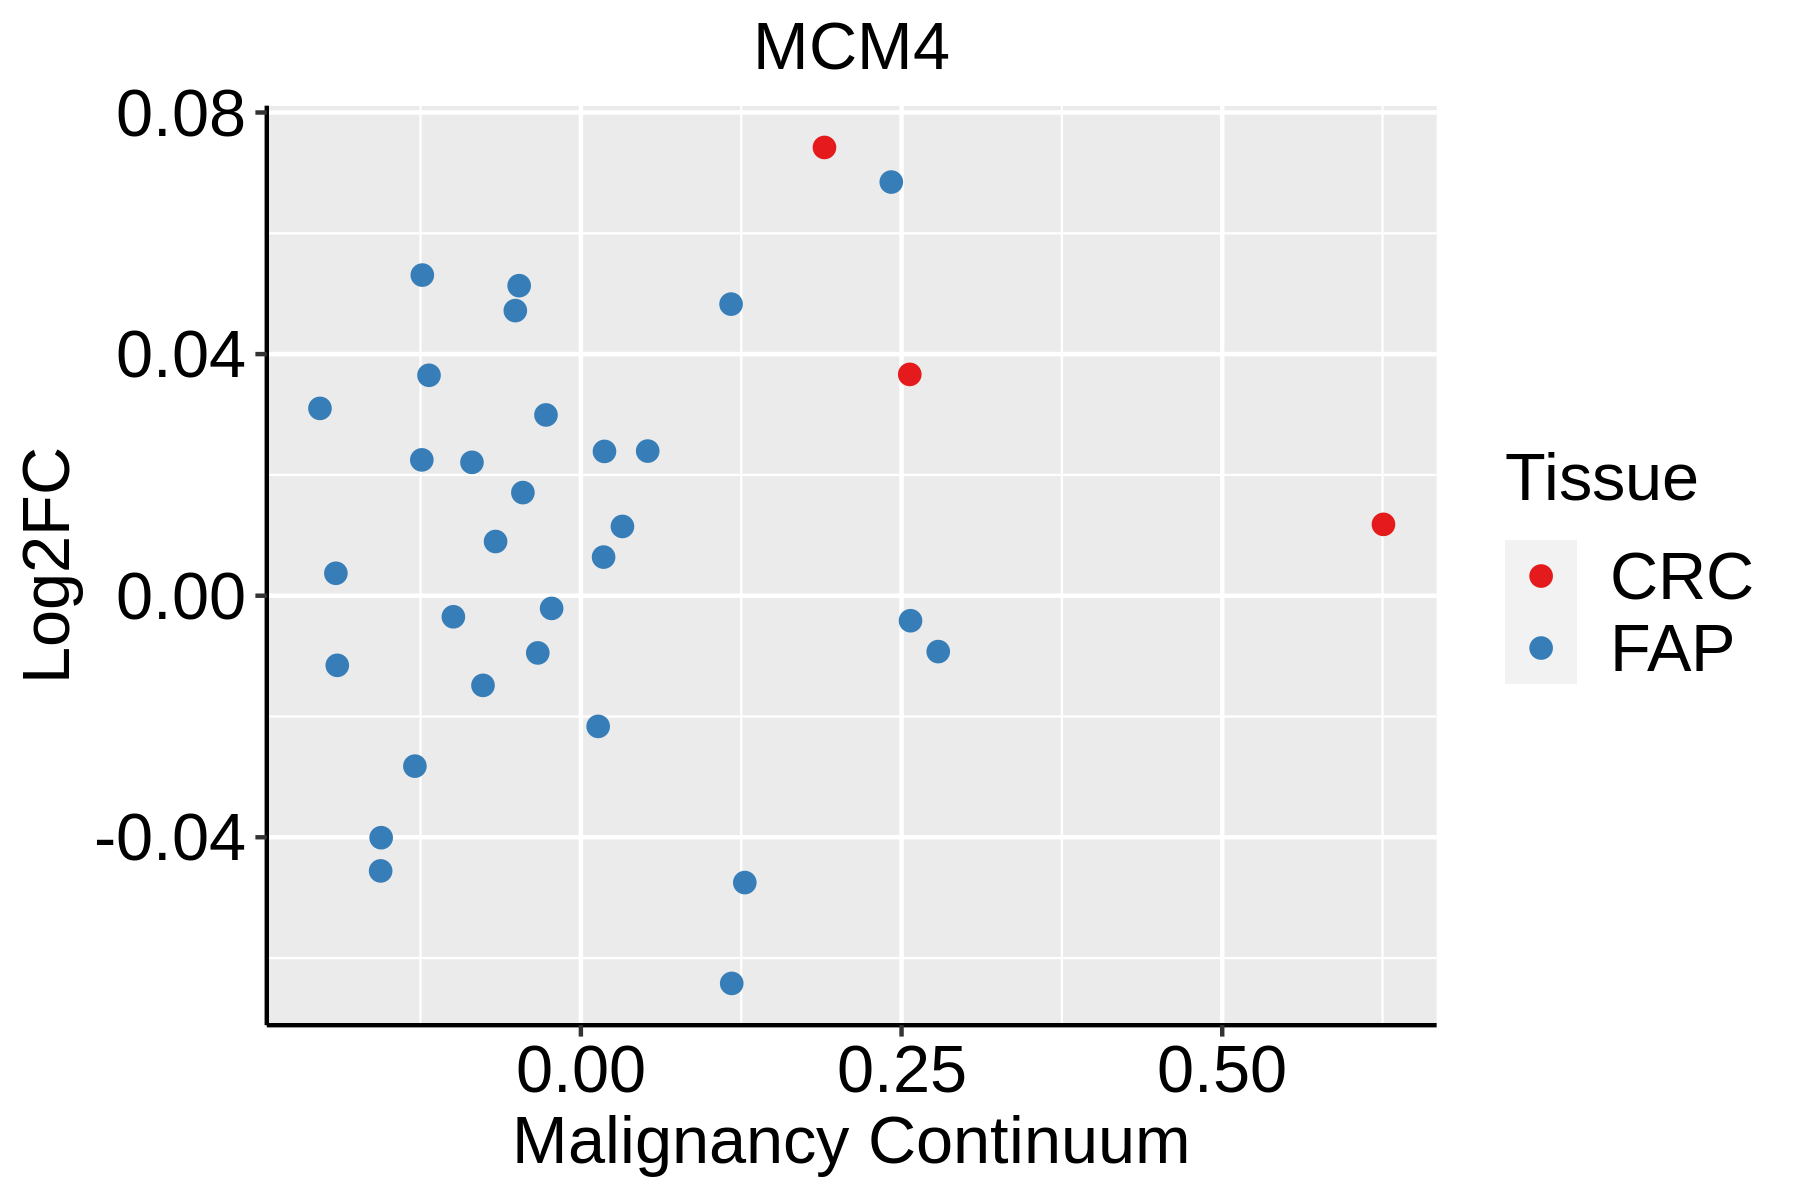 | FAP: Familial adenomatous polyposis |
| CRC: Colorectal cancer | ||
| Colorectum (HTA11) | 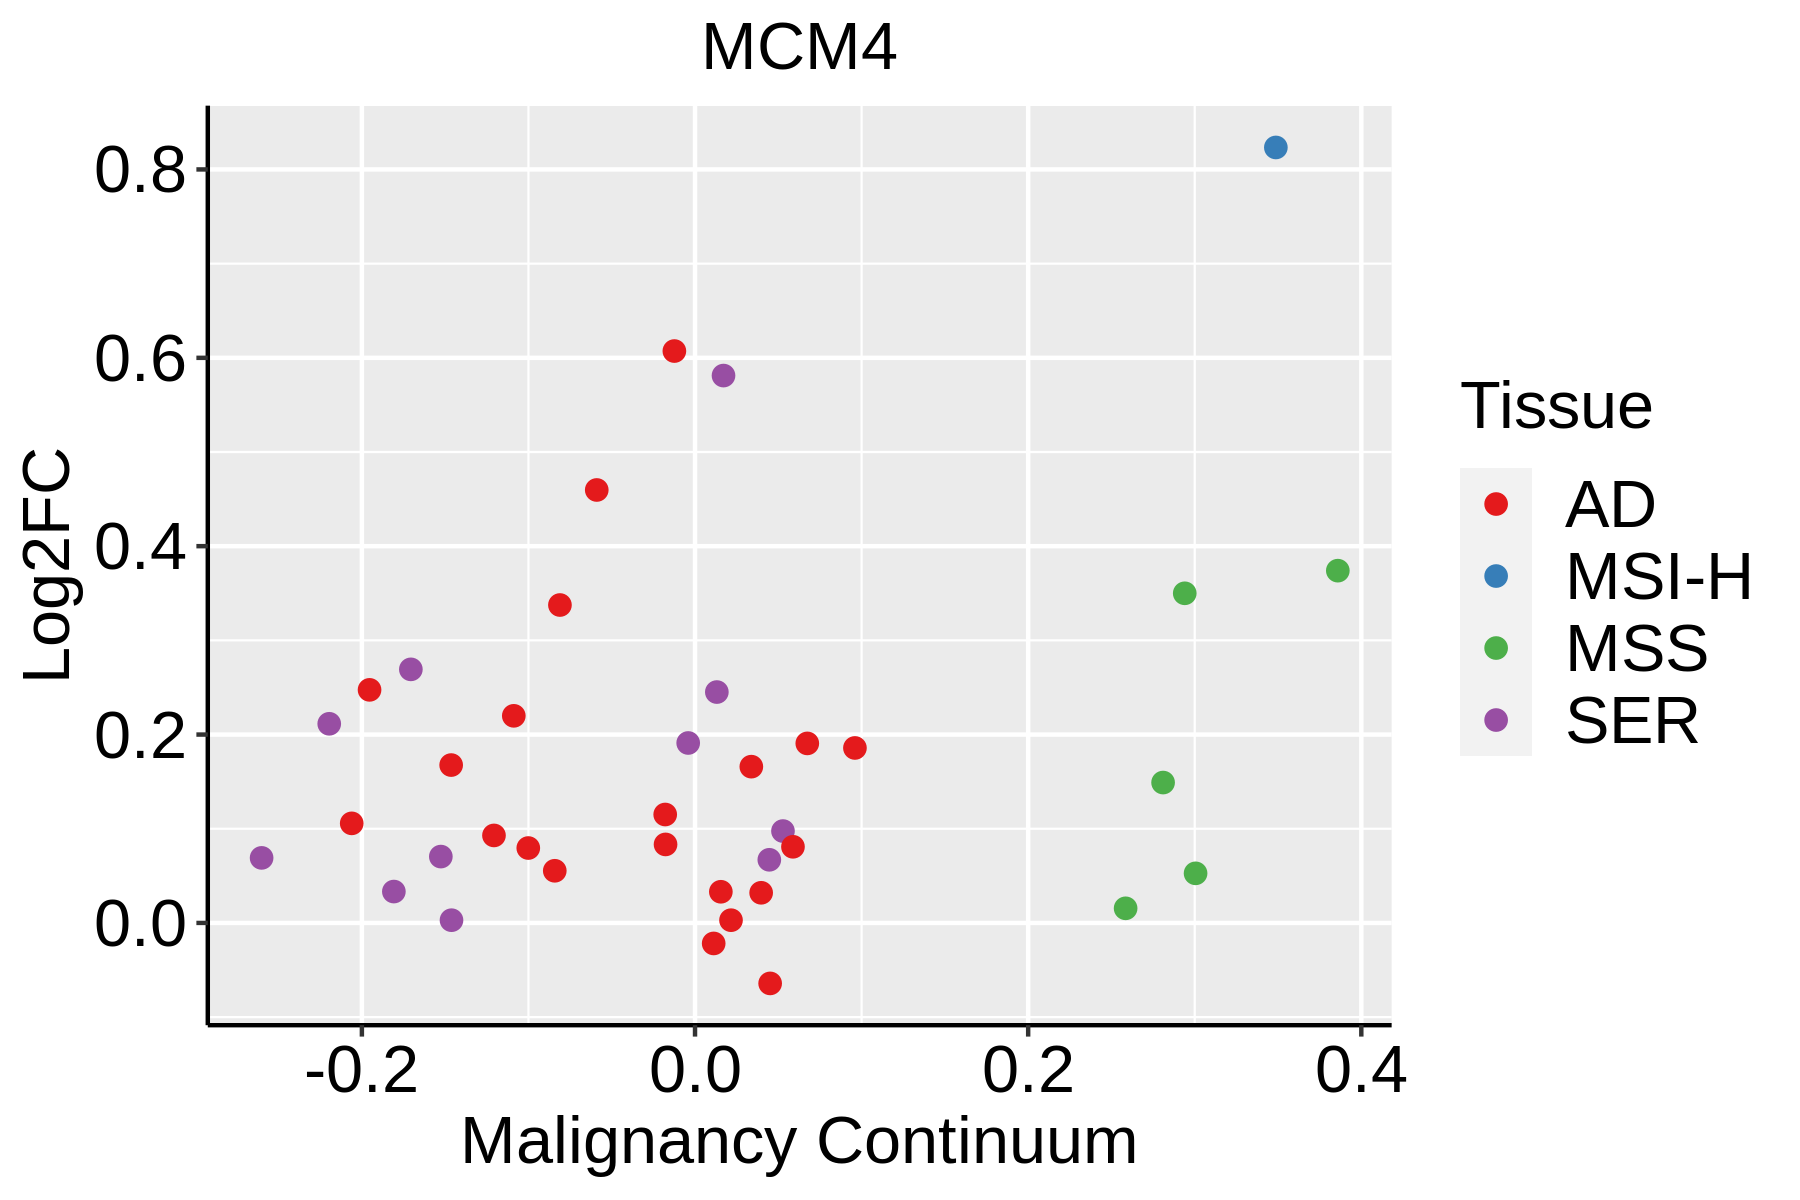 | AD: Adenomas |
| SER: Sessile serrated lesions | ||
| MSI-H: Microsatellite-high colorectal cancer | ||
| MSS: Microsatellite stable colorectal cancer | ||
| Esophagus | 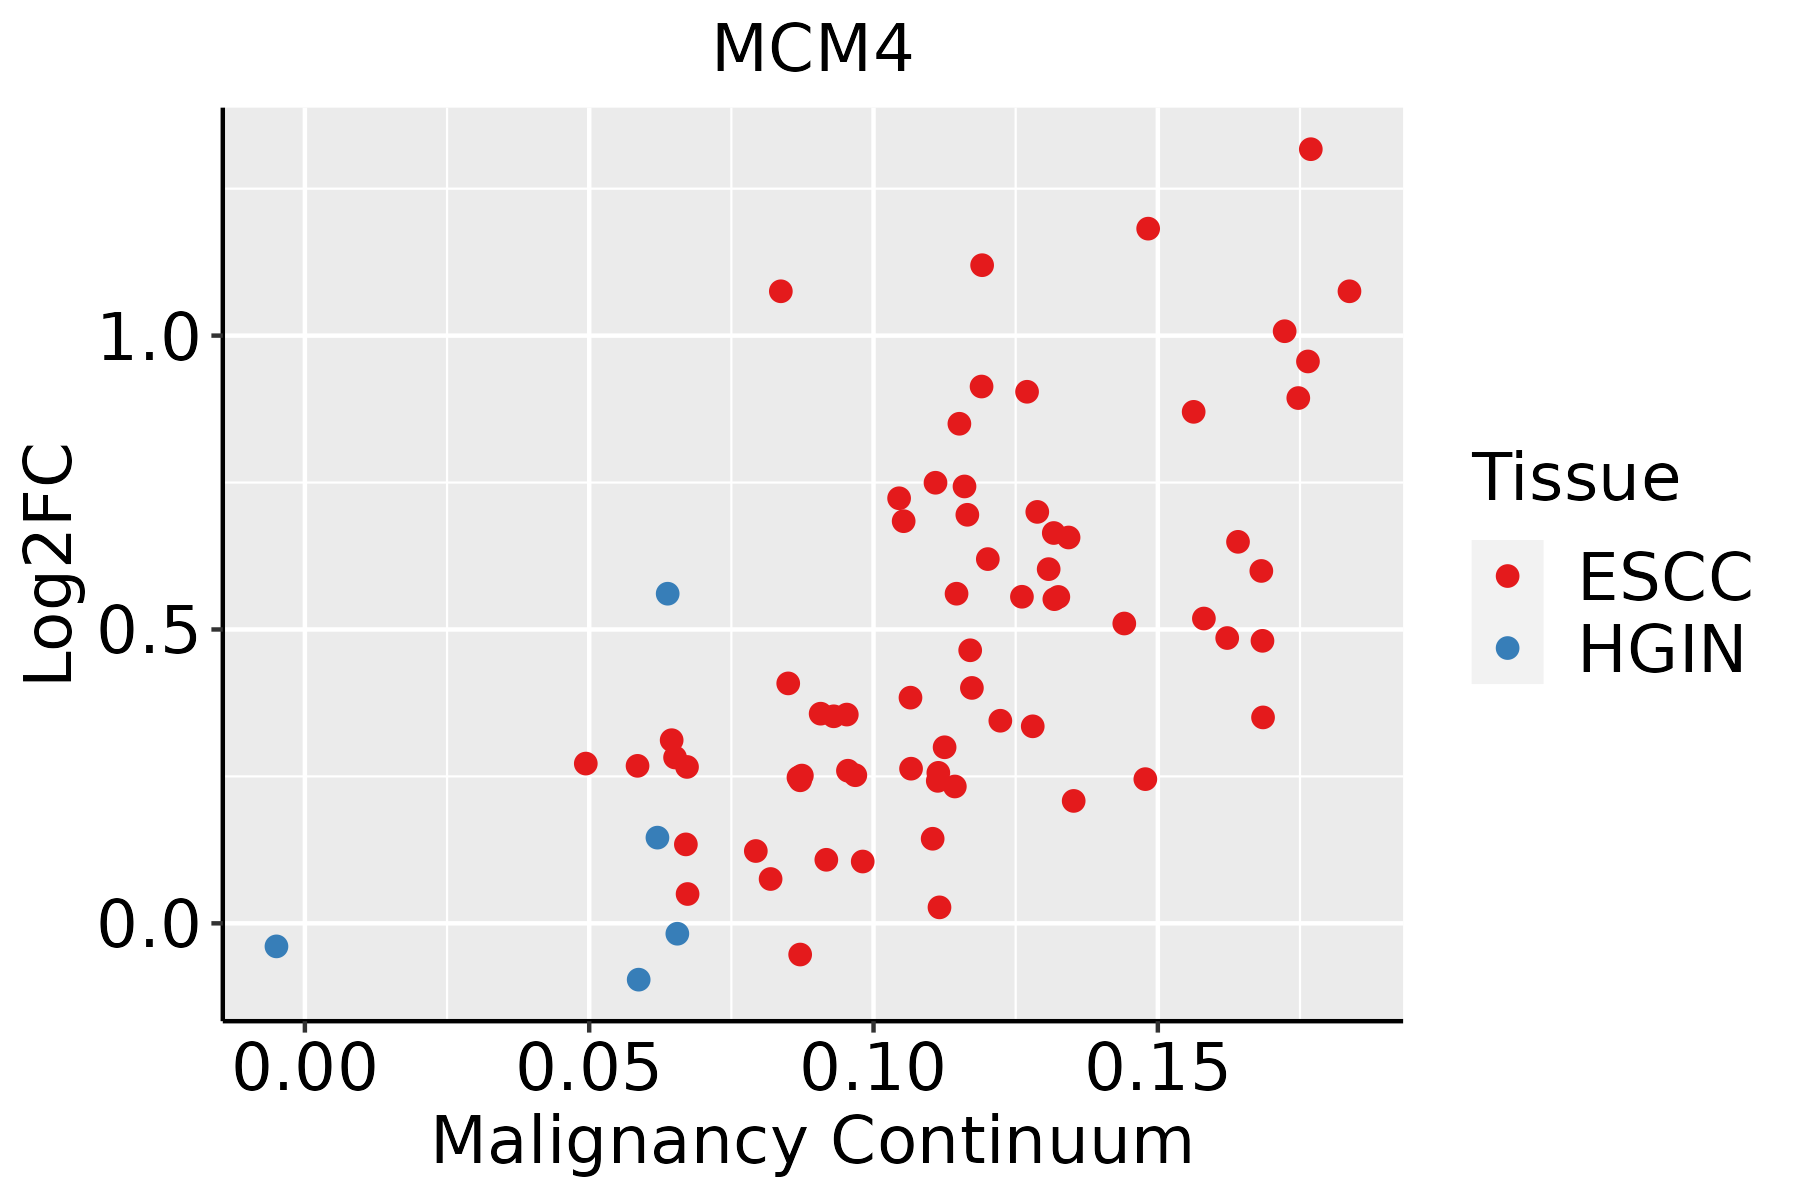 | ESCC: Esophageal squamous cell carcinoma |
| HGIN: High-grade intraepithelial neoplasias | ||
| LGIN: Low-grade intraepithelial neoplasias | ||
| Liver | 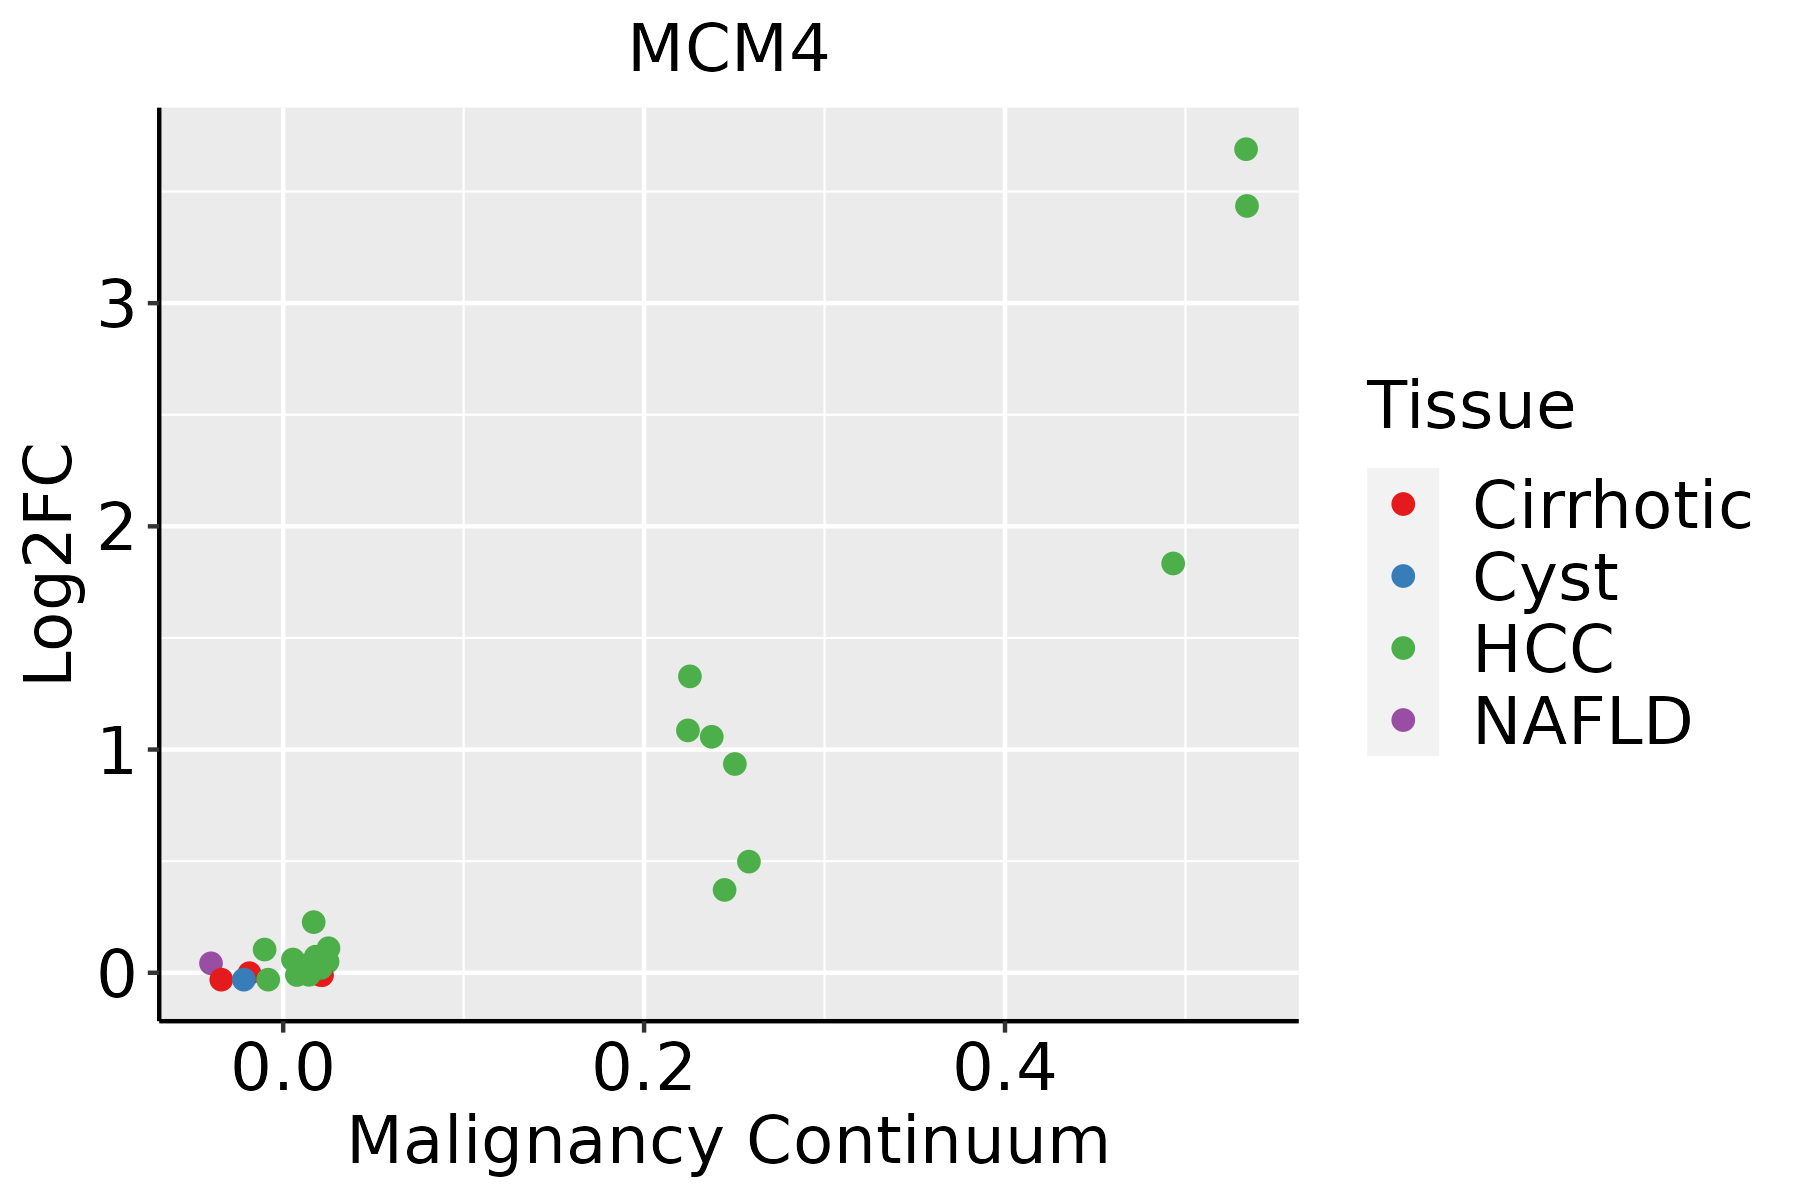 | HCC: Hepatocellular carcinoma |
| NAFLD: Non-alcoholic fatty liver disease | ||
| Oral Cavity | 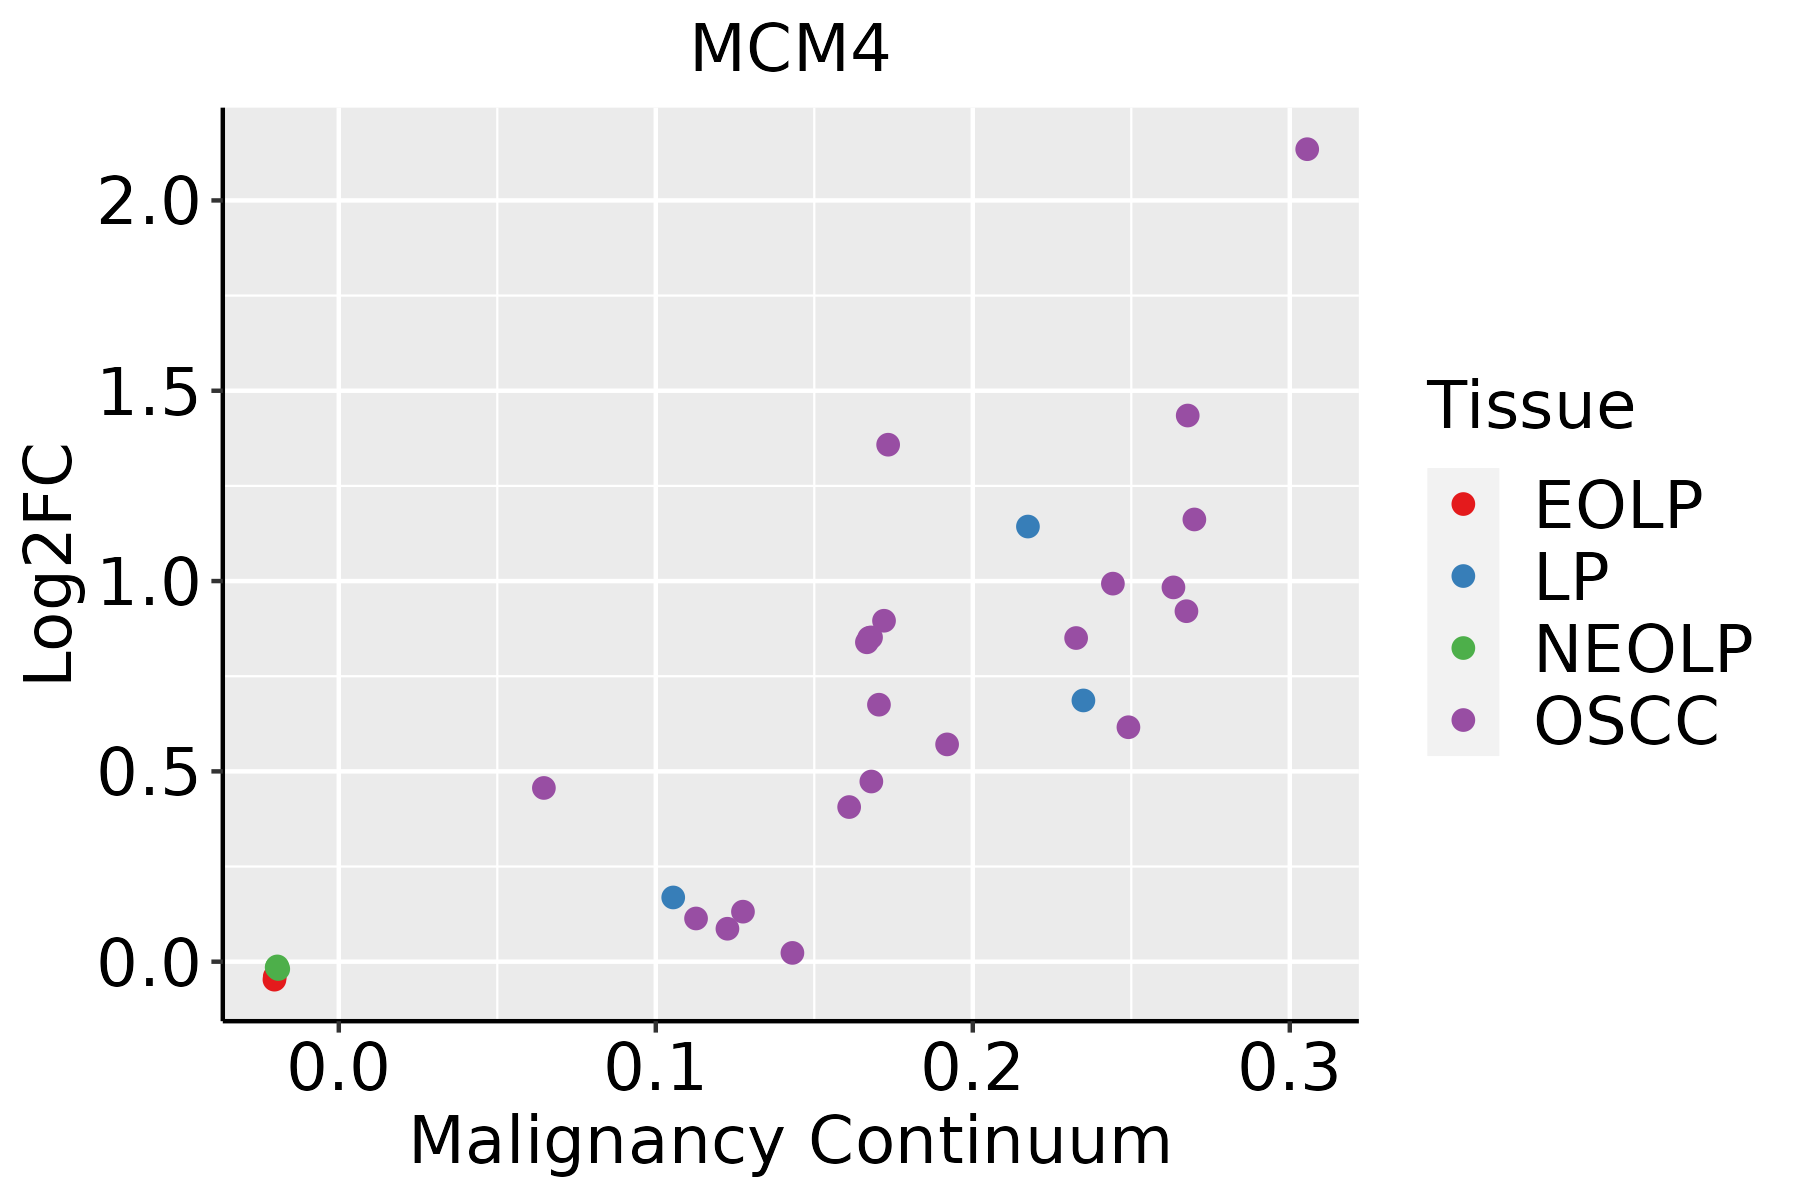 | EOLP: Erosive Oral lichen planus |
| LP: leukoplakia | ||
| NEOLP: Non-erosive oral lichen planus | ||
| OSCC: Oral squamous cell carcinoma | ||
| Skin | 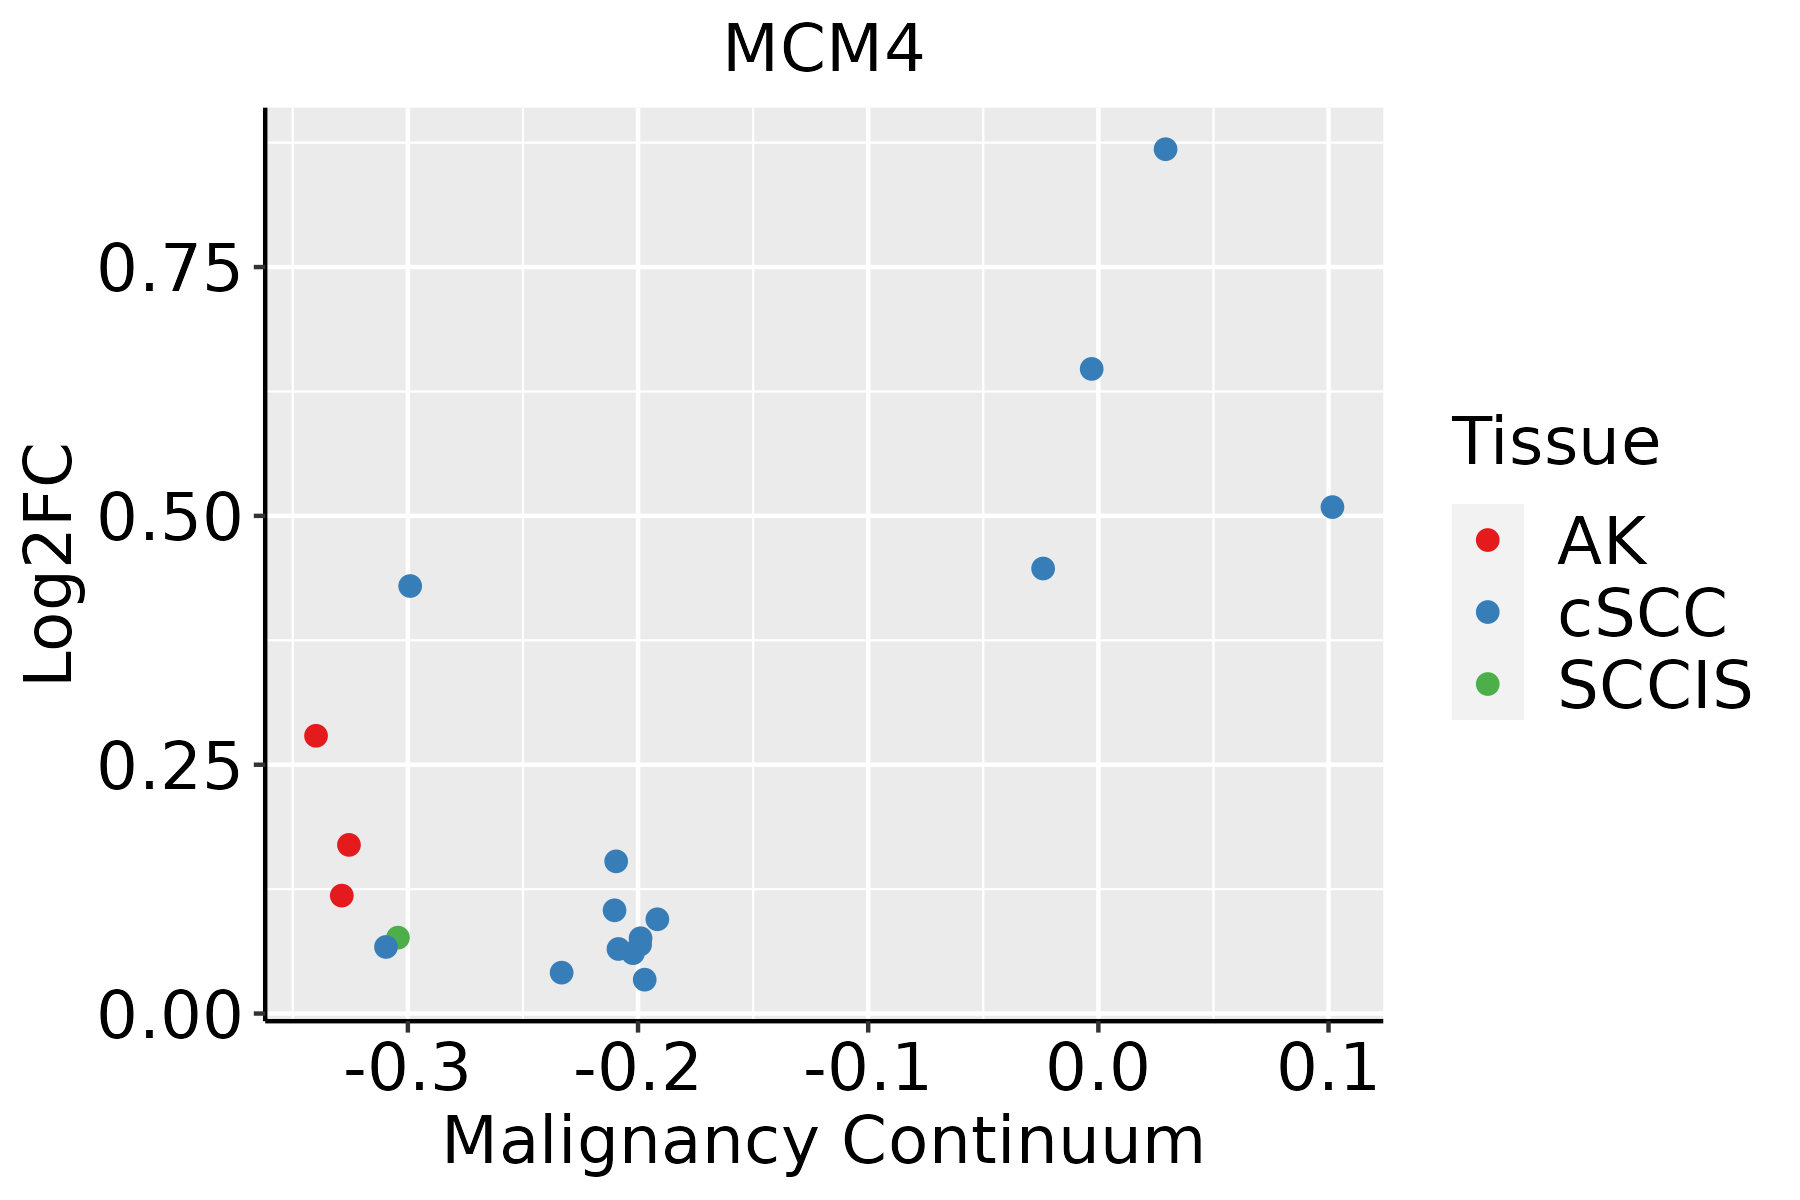 | AK: Actinic keratosis |
| cSCC: Cutaneous squamous cell carcinoma | ||
| SCCIS:squamous cell carcinoma in situ | ||
| Thyroid | 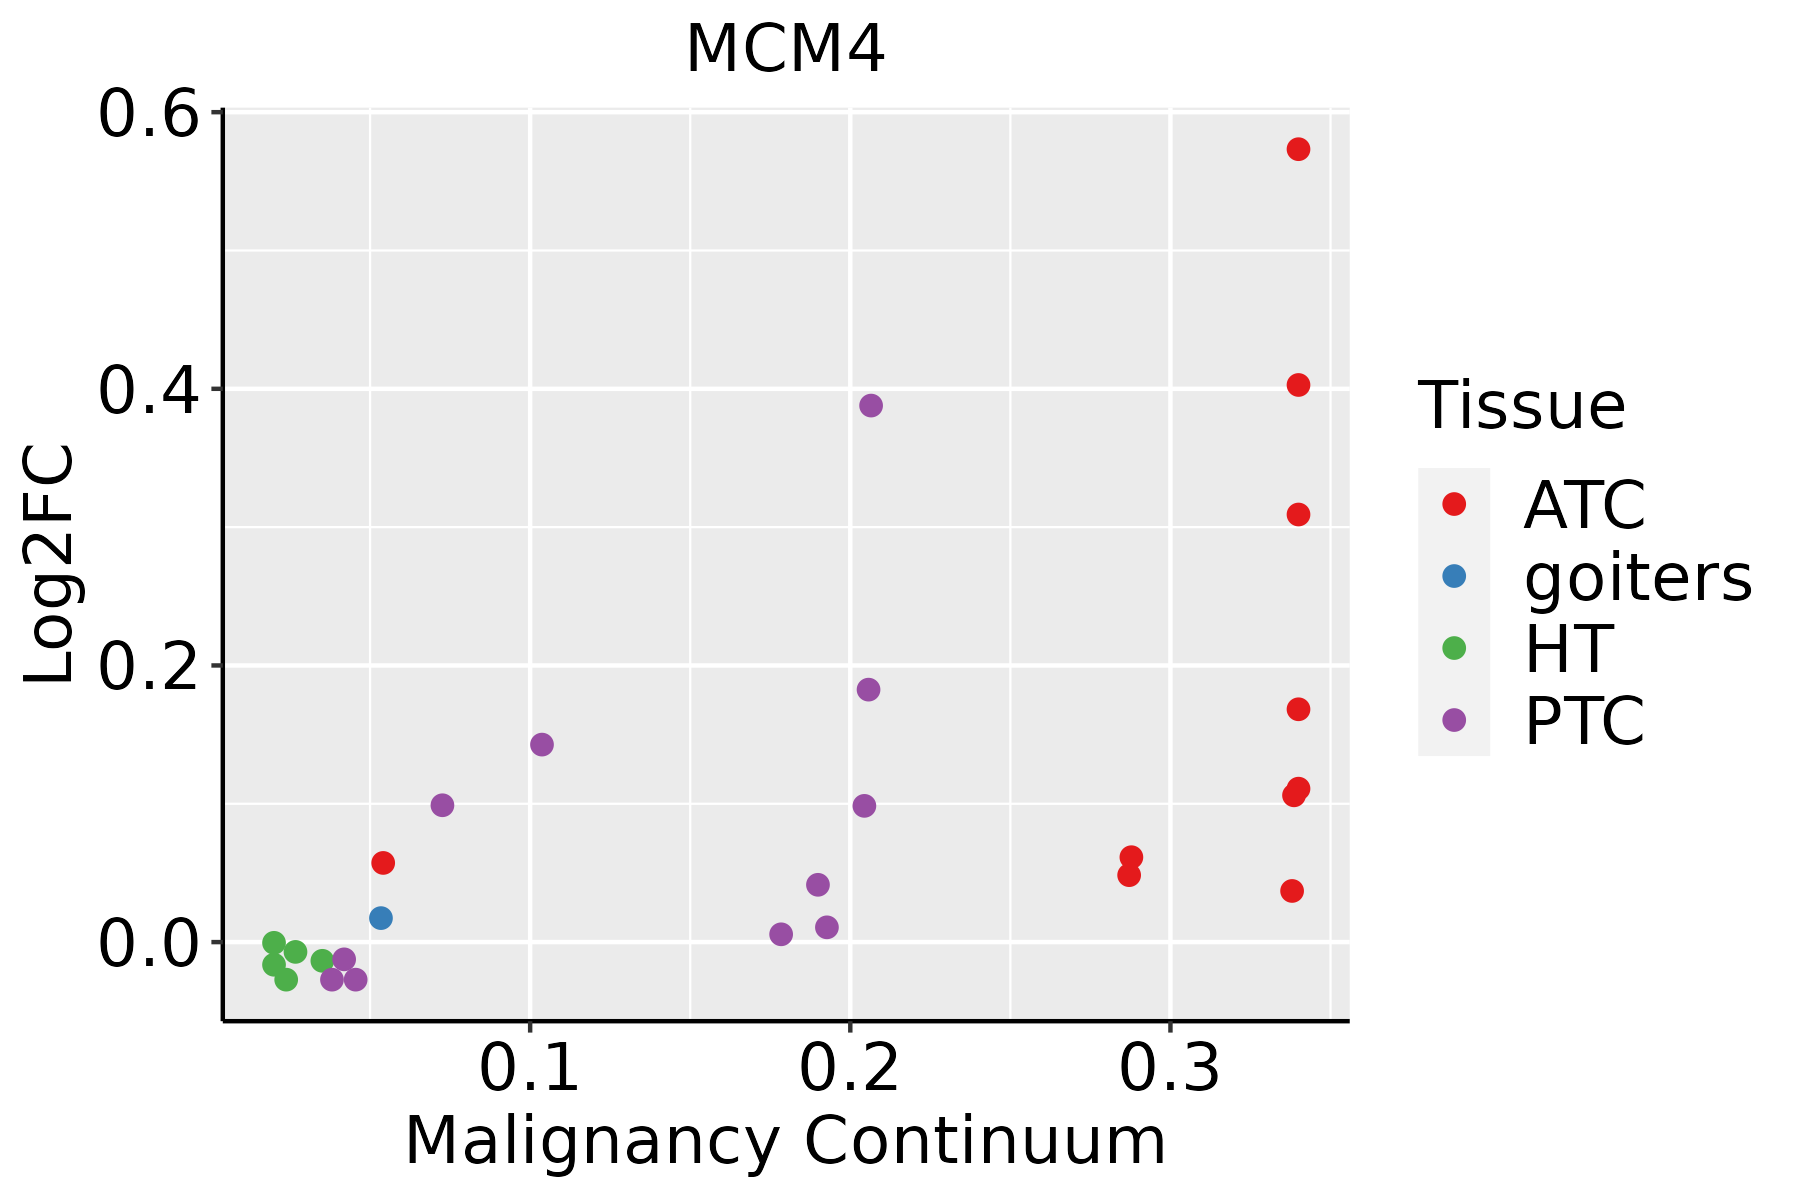 | ATC: Anaplastic thyroid cancer |
| HT: Hashimoto's thyroiditis | ||
| PTC: Papillary thyroid cancer |
| ∗log2FC in expression of this searched gene in stem-like cells from each diseased tissue sample relative to stem-like cells in normal samples in each tissue plotted against the malignancy continuum. Samples are colored based on if they are from different disease stage. |
Top |
Malignant transformation related pathway analysis |
| Find out the enriched GO biological processes and KEGG pathways involved in transition from healthy to precancer to cancer |
| Tissue | Disease Stage | Enriched GO biological Processes |
| Colorectum | AD |  |
| Colorectum | SER |  |
| Colorectum | MSS |  |
| Colorectum | MSI-H |  |
| Colorectum | FAP |  |
| ∗Top 15 enriched GO BP terms are showed in the bar plot of each disease state in each tissue. Each row represents a significant GO biological process which is colored according to the -log10(p.adjust). |
| Page: 1 2 3 4 5 6 7 8 9 |
| GO ID | Tissue | Disease Stage | Description | Gene Ratio | Bg Ratio | pvalue | p.adjust | Count |
| GO:0032392 | Colorectum | AD | DNA geometric change | 31/3918 | 90/18723 | 2.02e-03 | 1.63e-02 | 31 |
| GO:00323921 | Colorectum | MSS | DNA geometric change | 29/3467 | 90/18723 | 1.26e-03 | 1.20e-02 | 29 |
| GO:0006302 | Colorectum | MSS | double-strand break repair | 64/3467 | 251/18723 | 3.58e-03 | 2.65e-02 | 64 |
| GO:0032508 | Colorectum | MSS | DNA duplex unwinding | 25/3467 | 84/18723 | 8.27e-03 | 4.99e-02 | 25 |
| GO:00062604 | Esophagus | ESCC | DNA replication | 181/8552 | 260/18723 | 3.55e-15 | 2.05e-13 | 181 |
| GO:00062612 | Esophagus | ESCC | DNA-dependent DNA replication | 100/8552 | 151/18723 | 2.61e-07 | 3.94e-06 | 100 |
| GO:00063024 | Esophagus | ESCC | double-strand break repair | 152/8552 | 251/18723 | 1.33e-06 | 1.62e-05 | 152 |
| GO:003239214 | Esophagus | ESCC | DNA geometric change | 62/8552 | 90/18723 | 7.02e-06 | 7.04e-05 | 62 |
| GO:003250813 | Esophagus | ESCC | DNA duplex unwinding | 58/8552 | 84/18723 | 1.23e-05 | 1.14e-04 | 58 |
| GO:00062701 | Esophagus | ESCC | DNA replication initiation | 27/8552 | 34/18723 | 6.01e-05 | 4.62e-04 | 27 |
| GO:00063101 | Esophagus | ESCC | DNA recombination | 168/8552 | 305/18723 | 5.58e-04 | 3.05e-03 | 168 |
| GO:00007241 | Esophagus | ESCC | double-strand break repair via homologous recombination | 79/8552 | 138/18723 | 4.05e-03 | 1.62e-02 | 79 |
| GO:00007251 | Esophagus | ESCC | recombinational repair | 80/8552 | 140/18723 | 4.10e-03 | 1.63e-02 | 80 |
| GO:1902969 | Esophagus | ESCC | mitotic DNA replication | 11/8552 | 14/18723 | 1.30e-02 | 4.27e-02 | 11 |
| GO:00062601 | Liver | HCC | DNA replication | 146/7958 | 260/18723 | 5.68e-06 | 7.02e-05 | 146 |
| GO:003239211 | Liver | HCC | DNA geometric change | 54/7958 | 90/18723 | 6.04e-04 | 3.79e-03 | 54 |
| GO:00063021 | Liver | HCC | double-strand break repair | 131/7958 | 251/18723 | 1.17e-03 | 6.54e-03 | 131 |
| GO:00325081 | Liver | HCC | DNA duplex unwinding | 49/7958 | 84/18723 | 2.46e-03 | 1.19e-02 | 49 |
| GO:0006261 | Liver | HCC | DNA-dependent DNA replication | 80/7958 | 151/18723 | 5.91e-03 | 2.44e-02 | 80 |
| GO:00062603 | Oral cavity | OSCC | DNA replication | 159/7305 | 260/18723 | 3.25e-13 | 1.59e-11 | 159 |
| Page: 1 2 3 |
| Pathway ID | Tissue | Disease Stage | Description | Gene Ratio | Bg Ratio | pvalue | p.adjust | qvalue | Count |
| hsa0411023 | Esophagus | ESCC | Cell cycle | 126/4205 | 157/8465 | 1.34e-15 | 5.60e-14 | 2.87e-14 | 126 |
| hsa030304 | Esophagus | ESCC | DNA replication | 32/4205 | 36/8465 | 7.71e-07 | 5.06e-06 | 2.59e-06 | 32 |
| hsa0411033 | Esophagus | ESCC | Cell cycle | 126/4205 | 157/8465 | 1.34e-15 | 5.60e-14 | 2.87e-14 | 126 |
| hsa0303011 | Esophagus | ESCC | DNA replication | 32/4205 | 36/8465 | 7.71e-07 | 5.06e-06 | 2.59e-06 | 32 |
| hsa041102 | Liver | HCC | Cell cycle | 106/4020 | 157/8465 | 2.54e-07 | 3.04e-06 | 1.69e-06 | 106 |
| hsa041103 | Liver | HCC | Cell cycle | 106/4020 | 157/8465 | 2.54e-07 | 3.04e-06 | 1.69e-06 | 106 |
| hsa041108 | Oral cavity | OSCC | Cell cycle | 118/3704 | 157/8465 | 7.15e-16 | 2.66e-14 | 1.35e-14 | 118 |
| hsa03030 | Oral cavity | OSCC | DNA replication | 31/3704 | 36/8465 | 1.70e-07 | 1.19e-06 | 6.03e-07 | 31 |
| hsa0411015 | Oral cavity | OSCC | Cell cycle | 118/3704 | 157/8465 | 7.15e-16 | 2.66e-14 | 1.35e-14 | 118 |
| hsa030301 | Oral cavity | OSCC | DNA replication | 31/3704 | 36/8465 | 1.70e-07 | 1.19e-06 | 6.03e-07 | 31 |
| hsa030302 | Oral cavity | LP | DNA replication | 23/2418 | 36/8465 | 1.08e-05 | 7.79e-05 | 5.02e-05 | 23 |
| hsa0411022 | Oral cavity | LP | Cell cycle | 70/2418 | 157/8465 | 1.17e-05 | 8.27e-05 | 5.33e-05 | 70 |
| hsa030303 | Oral cavity | LP | DNA replication | 23/2418 | 36/8465 | 1.08e-05 | 7.79e-05 | 5.02e-05 | 23 |
| hsa0411032 | Oral cavity | LP | Cell cycle | 70/2418 | 157/8465 | 1.17e-05 | 8.27e-05 | 5.33e-05 | 70 |
| Page: 1 |
Top |
Cell-cell communication analysis |
| Identification of potential cell-cell interactions between two cell types and their ligand-receptor pairs for different disease states |
| Ligand | Receptor | LRpair | Pathway | Tissue | Disease Stage |
| Page: 1 |
Top |
Single-cell gene regulatory network inference analysis |
| Find out the significant the regulons (TFs) and the target genes of each regulon across cell types for different disease states |
| TF | Cell Type | Tissue | Disease Stage | Target Gene | RSS | Regulon Activity |
| ∗The dot plots of a searched regulon are shown for all cell subpopulations in each disease state of each tissue based on the regulon specific score inferred using pySCENIC and by calculating the average expression. |
| Page: 1 |
Top |
Somatic mutation of malignant transformation related genes |
| Annotation of somatic variants for genes involved in malignant transformation |
| Hugo Symbol | Variant Class | Variant Classification | dbSNP RS | HGVSc | HGVSp | HGVSp Short | SWISSPROT | BIOTYPE | SIFT | PolyPhen | Tumor Sample Barcode | Tissue | Histology | Sex | Age | Stage | Therapy Types | Drugs | Outcome |
| MCM4 | SNV | Missense_Mutation | rs751154452 | c.1579N>A | p.Val527Ile | p.V527I | P33991 | protein_coding | tolerated(0.06) | possibly_damaging(0.49) | TCGA-A8-A09Q-01 | Breast | breast invasive carcinoma | Female | >=65 | III/IV | Hormone Therapy | anastrozole | SD |
| MCM4 | SNV | Missense_Mutation | c.971A>T | p.Glu324Val | p.E324V | P33991 | protein_coding | deleterious(0) | probably_damaging(0.984) | TCGA-BH-A0AZ-01 | Breast | breast invasive carcinoma | Female | <65 | III/IV | Chemotherapy | doxorubicin | CR | |
| MCM4 | SNV | Missense_Mutation | c.2151N>A | p.Met717Ile | p.M717I | P33991 | protein_coding | deleterious(0.02) | probably_damaging(0.986) | TCGA-BH-A0H9-01 | Breast | breast invasive carcinoma | Female | >=65 | I/II | Hormone Therapy | arimidex | SD | |
| MCM4 | SNV | Missense_Mutation | c.655N>C | p.Asp219His | p.D219H | P33991 | protein_coding | tolerated(0.07) | benign(0.078) | TCGA-C8-A274-01 | Breast | breast invasive carcinoma | Female | <65 | I/II | Hormone Therapy | tamoxiphen | SD | |
| MCM4 | SNV | Missense_Mutation | c.2315N>G | p.Ser772Cys | p.S772C | P33991 | protein_coding | deleterious(0) | probably_damaging(0.982) | TCGA-D8-A27G-01 | Breast | breast invasive carcinoma | Female | >=65 | I/II | Unknown | Unknown | SD | |
| MCM4 | insertion | Frame_Shift_Ins | novel | c.2365_2365+1insACTACATTGCCTACGCGCACAGCACCATCATGCCGCGGCTAAGT | p.Gly789AspfsTer17 | p.G789Dfs*17 | P33991 | protein_coding | TCGA-A2-A0EY-01 | Breast | breast invasive carcinoma | Female | <65 | I/II | Chemotherapy | adriamycin | SD | ||
| MCM4 | insertion | Nonsense_Mutation | novel | c.2334_2335insCCTCCCATATTGCAAAATTGATCTTTCCAAATGTTGCAAAAGGG | p.Gly779ProfsTer7 | p.G779Pfs*7 | P33991 | protein_coding | TCGA-A8-A06P-01 | Breast | breast invasive carcinoma | Female | <65 | III/IV | Unspecific | SD | |||
| MCM4 | insertion | Frame_Shift_Ins | novel | c.2265_2266insGCGCCTAGCAATATACTATTTTTTATAACTGTTT | p.Ile756AlafsTer13 | p.I756Afs*13 | P33991 | protein_coding | TCGA-AN-A0FX-01 | Breast | breast invasive carcinoma | Female | <65 | I/II | Unknown | Unknown | SD | ||
| MCM4 | SNV | Missense_Mutation | novel | c.116N>A | p.Gly39Asp | p.G39D | P33991 | protein_coding | tolerated(0.64) | benign(0.001) | TCGA-2W-A8YY-01 | Cervix | cervical & endocervical cancer | Female | <65 | I/II | Chemotherapy | cisplatin | CR |
| MCM4 | SNV | Missense_Mutation | rs760155775 | c.1012N>A | p.Ala338Thr | p.A338T | P33991 | protein_coding | tolerated(0.37) | benign(0.015) | TCGA-2W-A8YY-01 | Cervix | cervical & endocervical cancer | Female | <65 | I/II | Chemotherapy | cisplatin | CR |
| Page: 1 2 3 4 5 6 7 8 9 10 11 |
Top |
Related drugs of malignant transformation related genes |
| Identification of chemicals and drugs interact with genes involved in malignant transfromation |
| (DGIdb 4.0) |
| Entrez ID | Symbol | Category | Interaction Types | Drug Claim Name | Drug Name | PMIDs |
| Page: 1 |

Copyright 2023-Present -The University of Texas Health Science Center at Houston |