
|
|||||
|
 | |
| |
| |
| |
| |
| |
|
Gene: MCM3AP |
Gene summary for MCM3AP |
| Gene information | Species | Human | Gene symbol | MCM3AP | Gene ID | 8888 |
| Gene name | minichromosome maintenance complex component 3 associated protein | |
| Gene Alias | GANP | |
| Cytomap | 21q22.3 | |
| Gene Type | protein-coding | GO ID | GO:0002200 | UniProtAcc | O60318 |
Top |
Malignant transformation analysis |
| Identification of the aberrant gene expression in precancerous and cancerous lesions by comparing the gene expression of stem-like cells in diseased tissues with normal stem cells |
| Entrez ID | Symbol | Replicates | Species | Organ | Tissue | Adj P-value | Log2FC | Malignancy |
| 8888 | MCM3AP | LZE4T | Human | Esophagus | ESCC | 2.68e-03 | 1.26e-01 | 0.0811 |
| 8888 | MCM3AP | LZE22T | Human | Esophagus | ESCC | 4.19e-03 | 2.72e-01 | 0.068 |
| 8888 | MCM3AP | LZE24T | Human | Esophagus | ESCC | 4.67e-19 | 5.72e-01 | 0.0596 |
| 8888 | MCM3AP | P1T-E | Human | Esophagus | ESCC | 3.70e-09 | 2.77e-01 | 0.0875 |
| 8888 | MCM3AP | P2T-E | Human | Esophagus | ESCC | 4.52e-10 | 2.15e-01 | 0.1177 |
| 8888 | MCM3AP | P4T-E | Human | Esophagus | ESCC | 3.24e-08 | 2.49e-01 | 0.1323 |
| 8888 | MCM3AP | P5T-E | Human | Esophagus | ESCC | 7.85e-14 | 1.10e-01 | 0.1327 |
| 8888 | MCM3AP | P8T-E | Human | Esophagus | ESCC | 8.51e-09 | 1.67e-01 | 0.0889 |
| 8888 | MCM3AP | P10T-E | Human | Esophagus | ESCC | 4.20e-20 | 3.14e-01 | 0.116 |
| 8888 | MCM3AP | P11T-E | Human | Esophagus | ESCC | 1.42e-08 | 4.42e-01 | 0.1426 |
| 8888 | MCM3AP | P12T-E | Human | Esophagus | ESCC | 3.43e-12 | 2.33e-01 | 0.1122 |
| 8888 | MCM3AP | P15T-E | Human | Esophagus | ESCC | 1.48e-08 | 1.61e-01 | 0.1149 |
| 8888 | MCM3AP | P16T-E | Human | Esophagus | ESCC | 2.84e-19 | 2.82e-01 | 0.1153 |
| 8888 | MCM3AP | P20T-E | Human | Esophagus | ESCC | 2.32e-07 | 1.42e-01 | 0.1124 |
| 8888 | MCM3AP | P21T-E | Human | Esophagus | ESCC | 2.02e-16 | 2.96e-01 | 0.1617 |
| 8888 | MCM3AP | P22T-E | Human | Esophagus | ESCC | 5.28e-12 | 2.55e-01 | 0.1236 |
| 8888 | MCM3AP | P23T-E | Human | Esophagus | ESCC | 2.51e-08 | 2.54e-01 | 0.108 |
| 8888 | MCM3AP | P24T-E | Human | Esophagus | ESCC | 1.79e-07 | 1.91e-01 | 0.1287 |
| 8888 | MCM3AP | P26T-E | Human | Esophagus | ESCC | 1.54e-06 | 1.80e-01 | 0.1276 |
| 8888 | MCM3AP | P27T-E | Human | Esophagus | ESCC | 2.46e-13 | 2.78e-01 | 0.1055 |
| Page: 1 2 3 4 |
| Tissue | Expression Dynamics | Abbreviation |
| Esophagus | 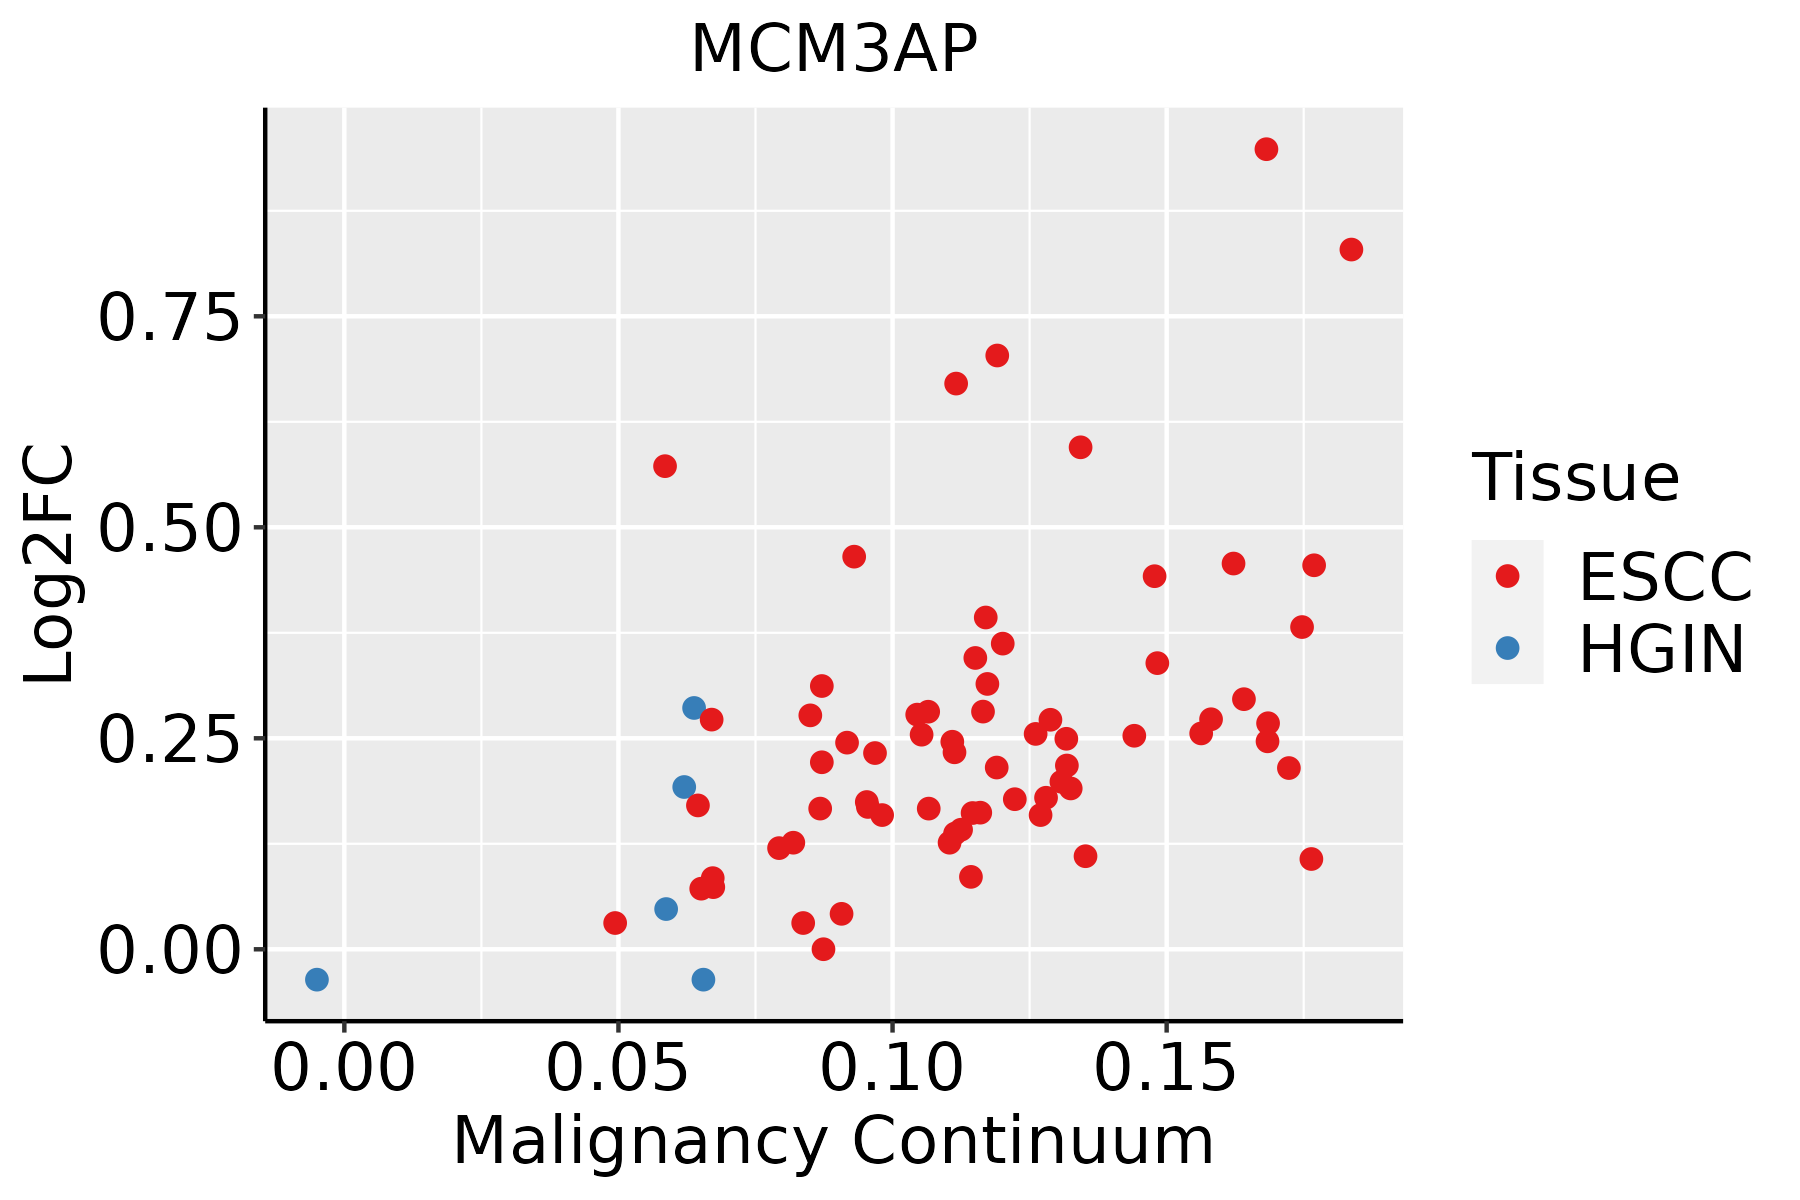 | ESCC: Esophageal squamous cell carcinoma |
| HGIN: High-grade intraepithelial neoplasias | ||
| LGIN: Low-grade intraepithelial neoplasias | ||
| Liver | 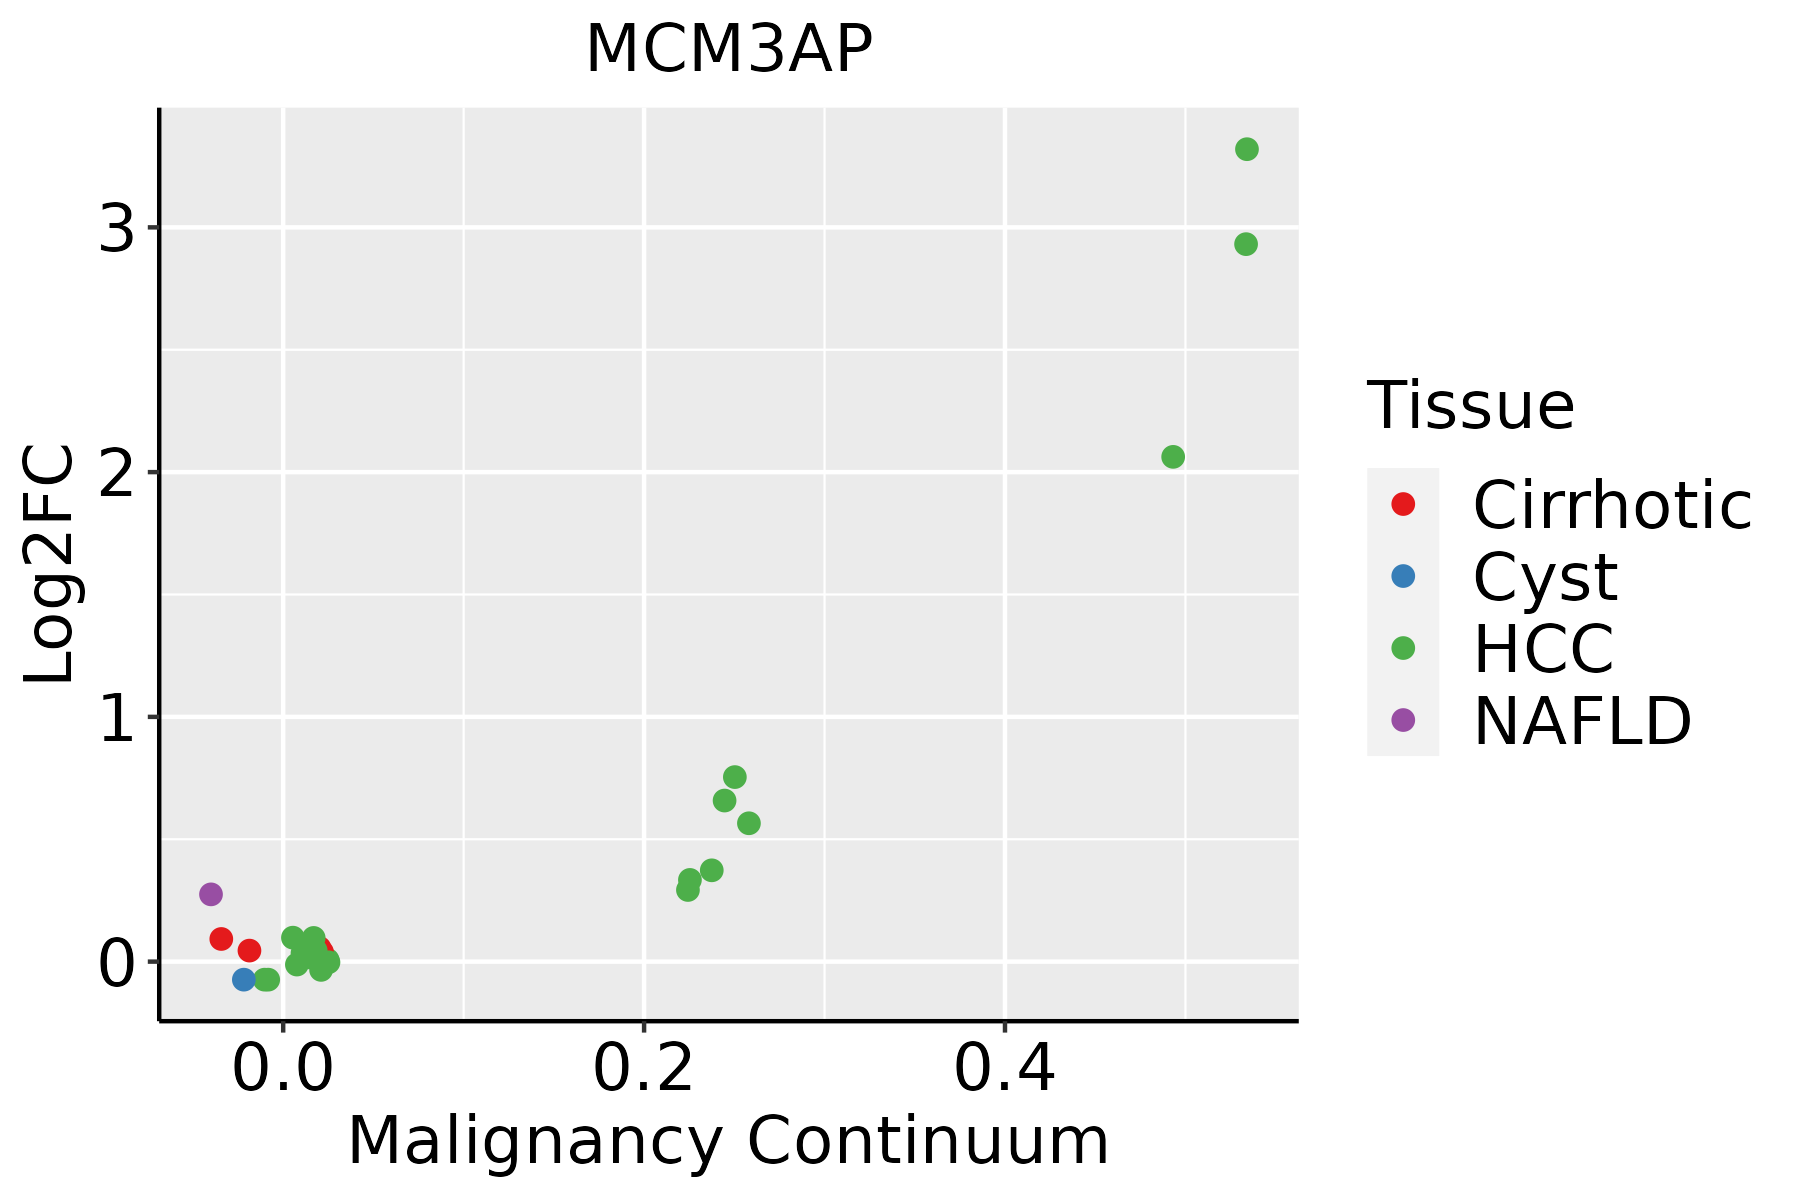 | HCC: Hepatocellular carcinoma |
| NAFLD: Non-alcoholic fatty liver disease | ||
| Thyroid |  | ATC: Anaplastic thyroid cancer |
| HT: Hashimoto's thyroiditis | ||
| PTC: Papillary thyroid cancer |
| ∗log2FC in expression of this searched gene in stem-like cells from each diseased tissue sample relative to stem-like cells in normal samples in each tissue plotted against the malignancy continuum. Samples are colored based on if they are from different disease stage. |
Top |
Malignant transformation related pathway analysis |
| Find out the enriched GO biological processes and KEGG pathways involved in transition from healthy to precancer to cancer |
| Tissue | Disease Stage | Enriched GO biological Processes |
| Colorectum | AD |  |
| Colorectum | SER |  |
| Colorectum | MSS |  |
| Colorectum | MSI-H |  |
| Colorectum | FAP |  |
| ∗Top 15 enriched GO BP terms are showed in the bar plot of each disease state in each tissue. Each row represents a significant GO biological process which is colored according to the -log10(p.adjust). |
| Page: 1 2 3 4 5 6 7 8 9 |
| GO ID | Tissue | Disease Stage | Description | Gene Ratio | Bg Ratio | pvalue | p.adjust | Count |
| GO:0006913110 | Esophagus | ESCC | nucleocytoplasmic transport | 230/8552 | 301/18723 | 6.04e-28 | 2.02e-25 | 230 |
| GO:0051169110 | Esophagus | ESCC | nuclear transport | 230/8552 | 301/18723 | 6.04e-28 | 2.02e-25 | 230 |
| GO:0006403110 | Esophagus | ESCC | RNA localization | 166/8552 | 201/18723 | 1.95e-27 | 6.18e-25 | 166 |
| GO:001657015 | Esophagus | ESCC | histone modification | 323/8552 | 463/18723 | 2.61e-26 | 7.88e-24 | 323 |
| GO:005123617 | Esophagus | ESCC | establishment of RNA localization | 134/8552 | 166/18723 | 1.23e-20 | 1.81e-18 | 134 |
| GO:0051168110 | Esophagus | ESCC | nuclear export | 126/8552 | 154/18723 | 1.88e-20 | 2.65e-18 | 126 |
| GO:005102815 | Esophagus | ESCC | mRNA transport | 110/8552 | 130/18723 | 2.76e-20 | 3.80e-18 | 110 |
| GO:001820514 | Esophagus | ESCC | peptidyl-lysine modification | 259/8552 | 376/18723 | 3.90e-20 | 5.26e-18 | 259 |
| GO:005065717 | Esophagus | ESCC | nucleic acid transport | 131/8552 | 163/18723 | 6.94e-20 | 8.46e-18 | 131 |
| GO:005065817 | Esophagus | ESCC | RNA transport | 131/8552 | 163/18723 | 6.94e-20 | 8.46e-18 | 131 |
| GO:001593117 | Esophagus | ESCC | nucleobase-containing compound transport | 162/8552 | 222/18723 | 9.87e-17 | 7.93e-15 | 162 |
| GO:007116612 | Esophagus | ESCC | ribonucleoprotein complex localization | 66/8552 | 77/18723 | 2.94e-13 | 1.38e-11 | 66 |
| GO:007142612 | Esophagus | ESCC | ribonucleoprotein complex export from nucleus | 65/8552 | 76/18723 | 5.56e-13 | 2.50e-11 | 65 |
| GO:001839413 | Esophagus | ESCC | peptidyl-lysine acetylation | 123/8552 | 169/18723 | 6.58e-13 | 2.94e-11 | 123 |
| GO:004354313 | Esophagus | ESCC | protein acylation | 165/8552 | 243/18723 | 1.69e-12 | 7.14e-11 | 165 |
| GO:000647313 | Esophagus | ESCC | protein acetylation | 140/8552 | 201/18723 | 4.37e-12 | 1.69e-10 | 140 |
| GO:001839313 | Esophagus | ESCC | internal peptidyl-lysine acetylation | 114/8552 | 158/18723 | 1.16e-11 | 4.24e-10 | 114 |
| GO:000647513 | Esophagus | ESCC | internal protein amino acid acetylation | 115/8552 | 160/18723 | 1.43e-11 | 5.08e-10 | 115 |
| GO:00165735 | Esophagus | ESCC | histone acetylation | 110/8552 | 152/18723 | 1.95e-11 | 6.81e-10 | 110 |
| GO:000640512 | Esophagus | ESCC | RNA export from nucleus | 68/8552 | 84/18723 | 2.99e-11 | 1.01e-09 | 68 |
| Page: 1 2 3 4 5 6 |
| Pathway ID | Tissue | Disease Stage | Description | Gene Ratio | Bg Ratio | pvalue | p.adjust | qvalue | Count |
| Page: 1 |
Top |
Cell-cell communication analysis |
| Identification of potential cell-cell interactions between two cell types and their ligand-receptor pairs for different disease states |
| Ligand | Receptor | LRpair | Pathway | Tissue | Disease Stage |
| Page: 1 |
Top |
Single-cell gene regulatory network inference analysis |
| Find out the significant the regulons (TFs) and the target genes of each regulon across cell types for different disease states |
| TF | Cell Type | Tissue | Disease Stage | Target Gene | RSS | Regulon Activity |
| ∗The dot plots of a searched regulon are shown for all cell subpopulations in each disease state of each tissue based on the regulon specific score inferred using pySCENIC and by calculating the average expression. |
| Page: 1 |
Top |
Somatic mutation of malignant transformation related genes |
| Annotation of somatic variants for genes involved in malignant transformation |
| Hugo Symbol | Variant Class | Variant Classification | dbSNP RS | HGVSc | HGVSp | HGVSp Short | SWISSPROT | BIOTYPE | SIFT | PolyPhen | Tumor Sample Barcode | Tissue | Histology | Sex | Age | Stage | Therapy Types | Drugs | Outcome |
| MCM3AP | SNV | Missense_Mutation | rs767712905 | c.1711N>A | p.Glu571Lys | p.E571K | O60318 | protein_coding | deleterious(0.01) | benign(0.13) | TCGA-A2-A0YD-01 | Breast | breast invasive carcinoma | Female | <65 | I/II | Chemotherapy | cytoxan | SD |
| MCM3AP | SNV | Missense_Mutation | novel | c.4687N>A | p.His1563Asn | p.H1563N | O60318 | protein_coding | tolerated(0.5) | benign(0) | TCGA-A7-A0DB-01 | Breast | breast invasive carcinoma | Female | <65 | I/II | Hormone Therapy | arimidex | SD |
| MCM3AP | SNV | Missense_Mutation | novel | c.4922C>A | p.Ala1641Glu | p.A1641E | O60318 | protein_coding | deleterious(0.01) | benign(0.081) | TCGA-A7-A5ZX-01 | Breast | breast invasive carcinoma | Female | <65 | III/IV | Chemotherapy | doxorubicin | CR |
| MCM3AP | SNV | Missense_Mutation | c.1256G>A | p.Arg419Lys | p.R419K | O60318 | protein_coding | tolerated(0.08) | benign(0.001) | TCGA-AC-A23H-01 | Breast | breast invasive carcinoma | Female | >=65 | I/II | Unknown | Unknown | PD | |
| MCM3AP | SNV | Missense_Mutation | c.1406N>A | p.Arg469His | p.R469H | O60318 | protein_coding | tolerated(0.08) | probably_damaging(0.967) | TCGA-AN-A0AJ-01 | Breast | breast invasive carcinoma | Female | >=65 | I/II | Unknown | Unknown | SD | |
| MCM3AP | SNV | Missense_Mutation | c.4760N>A | p.Arg1587His | p.R1587H | O60318 | protein_coding | deleterious(0) | probably_damaging(0.94) | TCGA-AO-A03O-01 | Breast | breast invasive carcinoma | Female | >=65 | I/II | Chemotherapy | doxorubicin | SD | |
| MCM3AP | SNV | Missense_Mutation | novel | c.3404N>T | p.Ala1135Val | p.A1135V | O60318 | protein_coding | tolerated(0.27) | benign(0.014) | TCGA-AO-A1KT-01 | Breast | breast invasive carcinoma | Female | >=65 | I/II | Chemotherapy | fluorouracil | SD |
| MCM3AP | SNV | Missense_Mutation | rs147295800 | c.5236N>A | p.Ala1746Thr | p.A1746T | O60318 | protein_coding | tolerated(0.26) | benign(0.018) | TCGA-BH-A0HA-01 | Breast | breast invasive carcinoma | Female | <65 | I/II | Unknown | Unknown | SD |
| MCM3AP | SNV | Missense_Mutation | rs201240379 | c.1969G>A | p.Val657Met | p.V657M | O60318 | protein_coding | deleterious(0.03) | benign(0.394) | TCGA-BH-A18G-01 | Breast | breast invasive carcinoma | Female | >=65 | I/II | Unknown | Unknown | SD |
| MCM3AP | SNV | Missense_Mutation | novel | c.1954N>T | p.Arg652Cys | p.R652C | O60318 | protein_coding | deleterious(0) | probably_damaging(0.991) | TCGA-EW-A423-01 | Breast | breast invasive carcinoma | Female | >=65 | I/II | Hormone Therapy | anastrozole | SD |
| Page: 1 2 3 4 5 6 7 8 9 10 11 12 13 14 15 16 17 18 |
Top |
Related drugs of malignant transformation related genes |
| Identification of chemicals and drugs interact with genes involved in malignant transfromation |
| (DGIdb 4.0) |
| Entrez ID | Symbol | Category | Interaction Types | Drug Claim Name | Drug Name | PMIDs |
| Page: 1 |

Copyright 2023-Present -The University of Texas Health Science Center at Houston |