
|
|||||
|
 | |
| |
| |
| |
| |
| |
|
Gene: MCM3 |
Gene summary for MCM3 |
| Gene information | Species | Human | Gene symbol | MCM3 | Gene ID | 4172 |
| Gene name | minichromosome maintenance complex component 3 | |
| Gene Alias | HCC5 | |
| Cytomap | 6p12.2 | |
| Gene Type | protein-coding | GO ID | GO:0000278 | UniProtAcc | B4DUQ9 |
Top |
Malignant transformation analysis |
| Identification of the aberrant gene expression in precancerous and cancerous lesions by comparing the gene expression of stem-like cells in diseased tissues with normal stem cells |
| Entrez ID | Symbol | Replicates | Species | Organ | Tissue | Adj P-value | Log2FC | Malignancy |
| 4172 | MCM3 | GSM4909281 | Human | Breast | IDC | 1.05e-24 | 5.09e-01 | 0.21 |
| 4172 | MCM3 | GSM4909282 | Human | Breast | IDC | 1.64e-24 | 5.69e-01 | -0.0288 |
| 4172 | MCM3 | GSM4909285 | Human | Breast | IDC | 1.88e-14 | 3.66e-01 | 0.21 |
| 4172 | MCM3 | GSM4909287 | Human | Breast | IDC | 3.24e-05 | 2.84e-01 | 0.2057 |
| 4172 | MCM3 | GSM4909293 | Human | Breast | IDC | 3.41e-04 | 1.31e-01 | 0.1581 |
| 4172 | MCM3 | brca2 | Human | Breast | Precancer | 1.44e-08 | 1.68e-01 | -0.024 |
| 4172 | MCM3 | M2 | Human | Breast | IDC | 1.39e-04 | 5.68e-01 | 0.21 |
| 4172 | MCM3 | DCIS2 | Human | Breast | DCIS | 3.36e-20 | 5.65e-02 | 0.0085 |
| 4172 | MCM3 | HTA11_696_2000001011 | Human | Colorectum | AD | 1.85e-02 | 2.10e-01 | -0.1464 |
| 4172 | MCM3 | HTA11_1391_2000001011 | Human | Colorectum | AD | 1.48e-03 | 3.94e-01 | -0.059 |
| 4172 | MCM3 | HTA11_866_3004761011 | Human | Colorectum | AD | 1.66e-03 | 3.11e-01 | 0.096 |
| 4172 | MCM3 | HTA11_7696_3000711011 | Human | Colorectum | AD | 2.42e-10 | 3.45e-01 | 0.0674 |
| 4172 | MCM3 | HTA11_99999970781_79442 | Human | Colorectum | MSS | 1.46e-10 | 4.65e-01 | 0.294 |
| 4172 | MCM3 | HTA11_99999965062_69753 | Human | Colorectum | MSI-H | 3.37e-04 | 9.16e-01 | 0.3487 |
| 4172 | MCM3 | HTA11_99999965104_69814 | Human | Colorectum | MSS | 1.51e-03 | 4.08e-01 | 0.281 |
| 4172 | MCM3 | HTA11_99999971662_82457 | Human | Colorectum | MSS | 1.05e-08 | 3.51e-01 | 0.3859 |
| 4172 | MCM3 | HTA11_99999974143_84620 | Human | Colorectum | MSS | 1.21e-02 | 1.56e-01 | 0.3005 |
| 4172 | MCM3 | LZE2T | Human | Esophagus | ESCC | 1.47e-04 | 1.07e+00 | 0.082 |
| 4172 | MCM3 | LZE4T | Human | Esophagus | ESCC | 4.28e-05 | 9.36e-02 | 0.0811 |
| 4172 | MCM3 | LZE7T | Human | Esophagus | ESCC | 2.47e-13 | 1.02e+00 | 0.0667 |
| Page: 1 2 3 4 5 6 7 |
| Tissue | Expression Dynamics | Abbreviation |
| Breast | 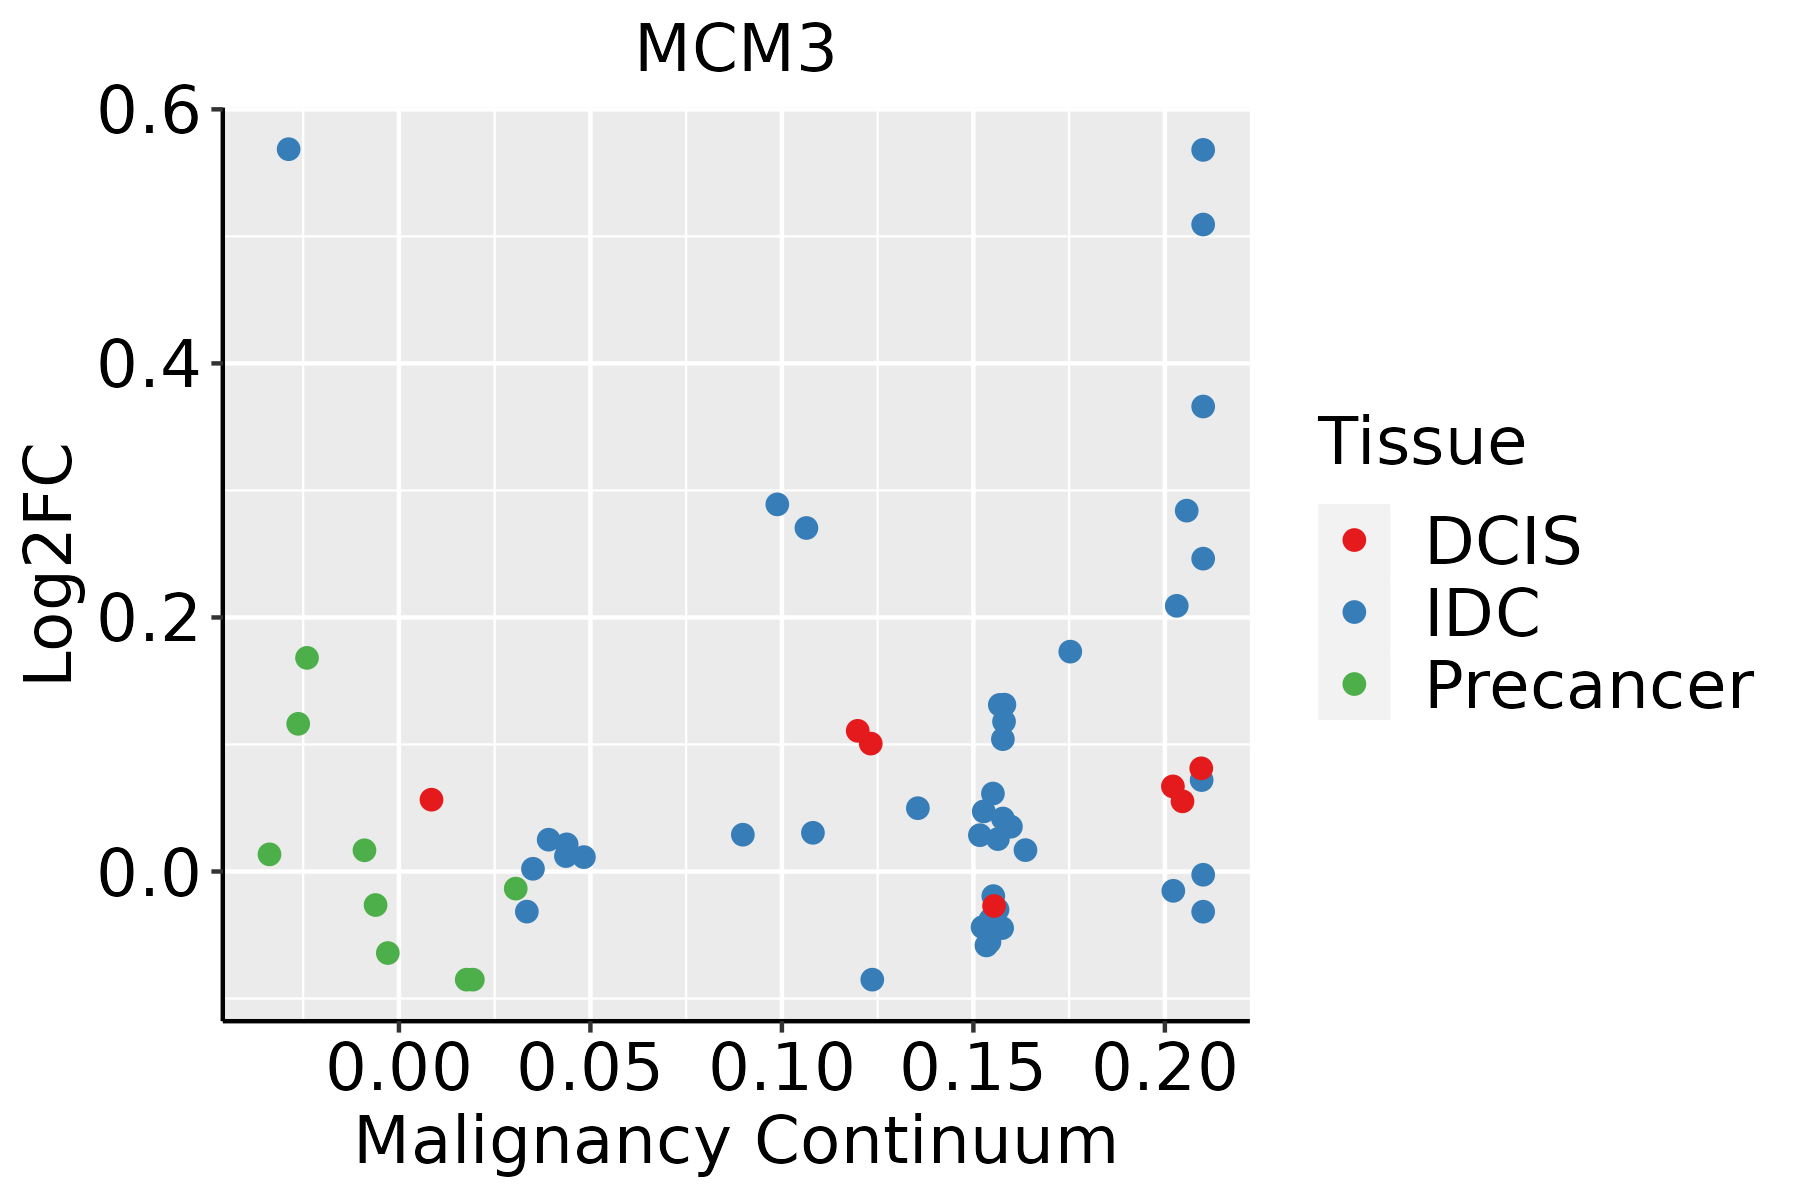 | IDC: Invasive ductal carcinoma |
| DCIS: Ductal carcinoma in situ | ||
| Precancer(BRCA1-mut): Precancerous lesion from BRCA1 mutation carriers | ||
| Colorectum (GSE201348) |  | FAP: Familial adenomatous polyposis |
| CRC: Colorectal cancer | ||
| Colorectum (HTA11) | 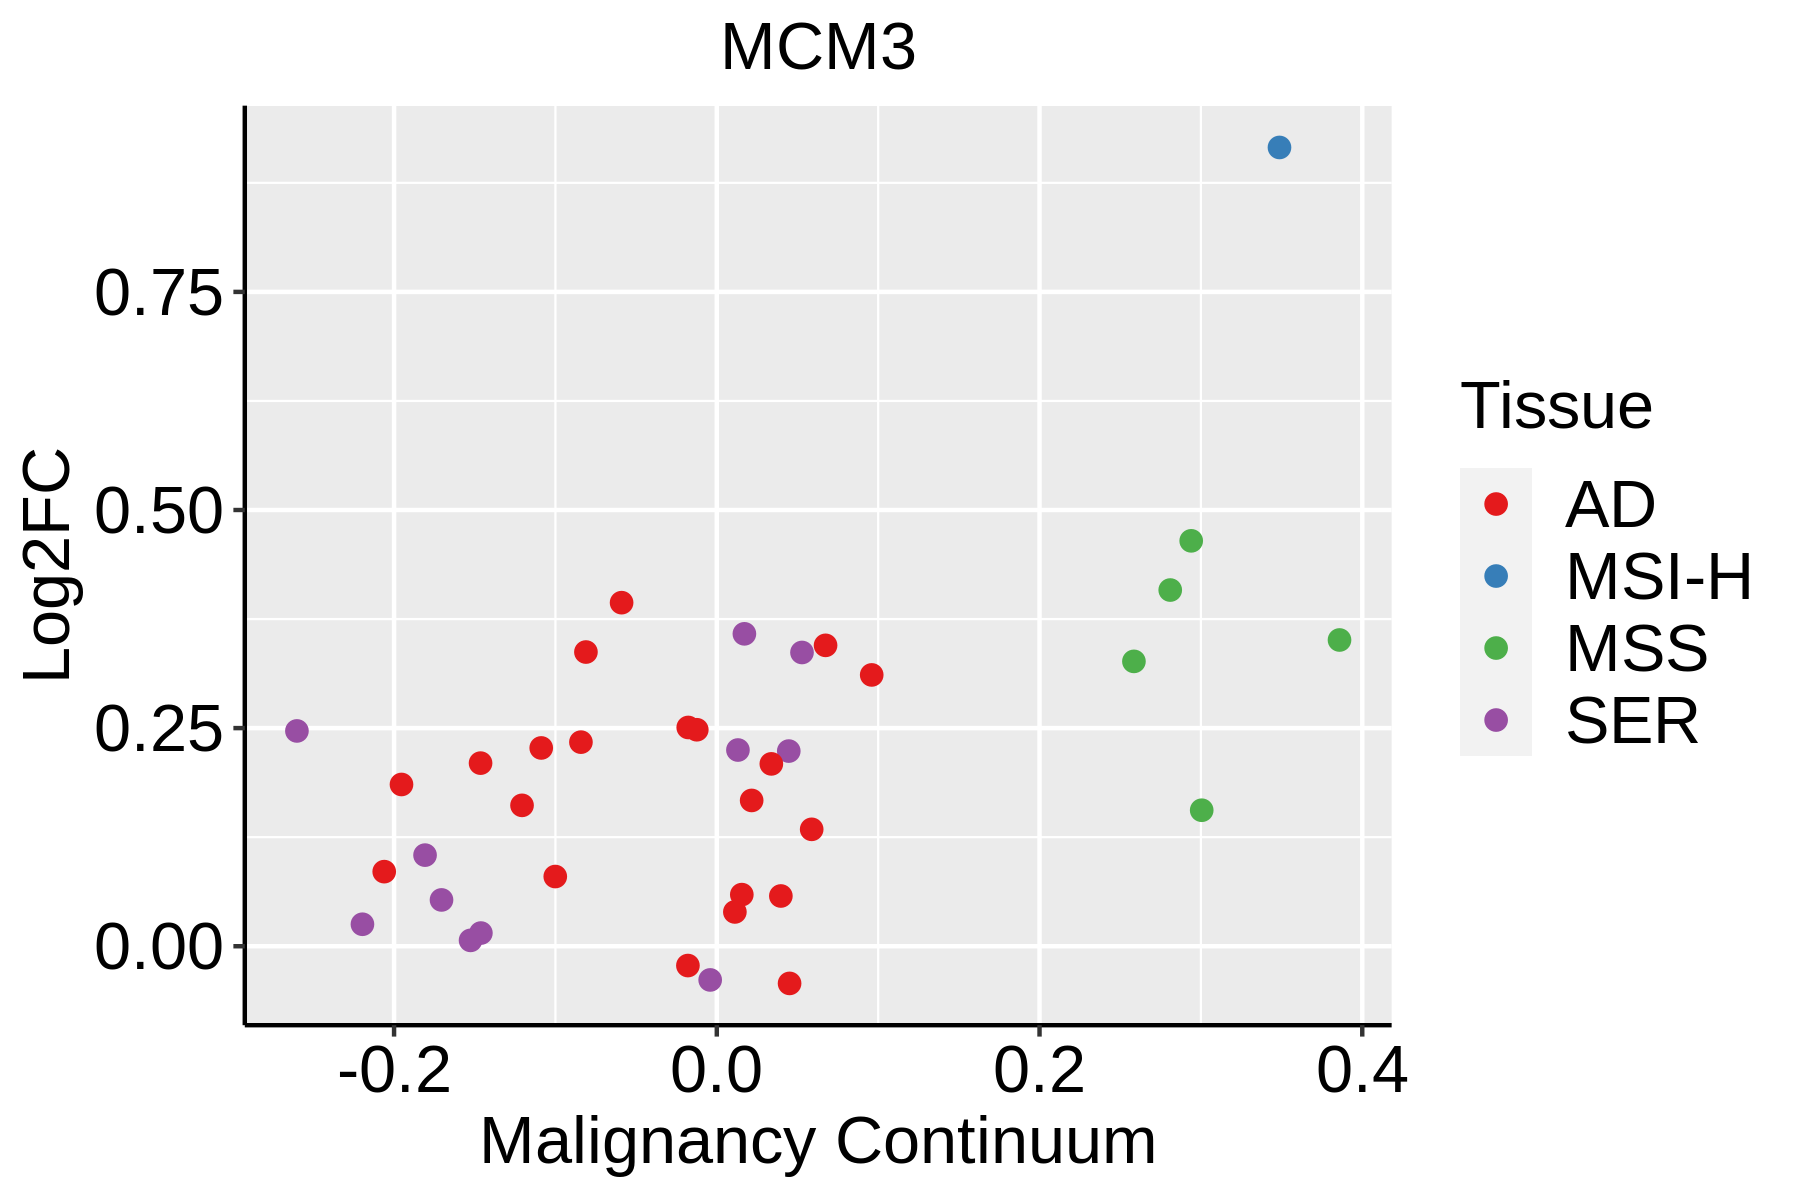 | AD: Adenomas |
| SER: Sessile serrated lesions | ||
| MSI-H: Microsatellite-high colorectal cancer | ||
| MSS: Microsatellite stable colorectal cancer | ||
| Esophagus | 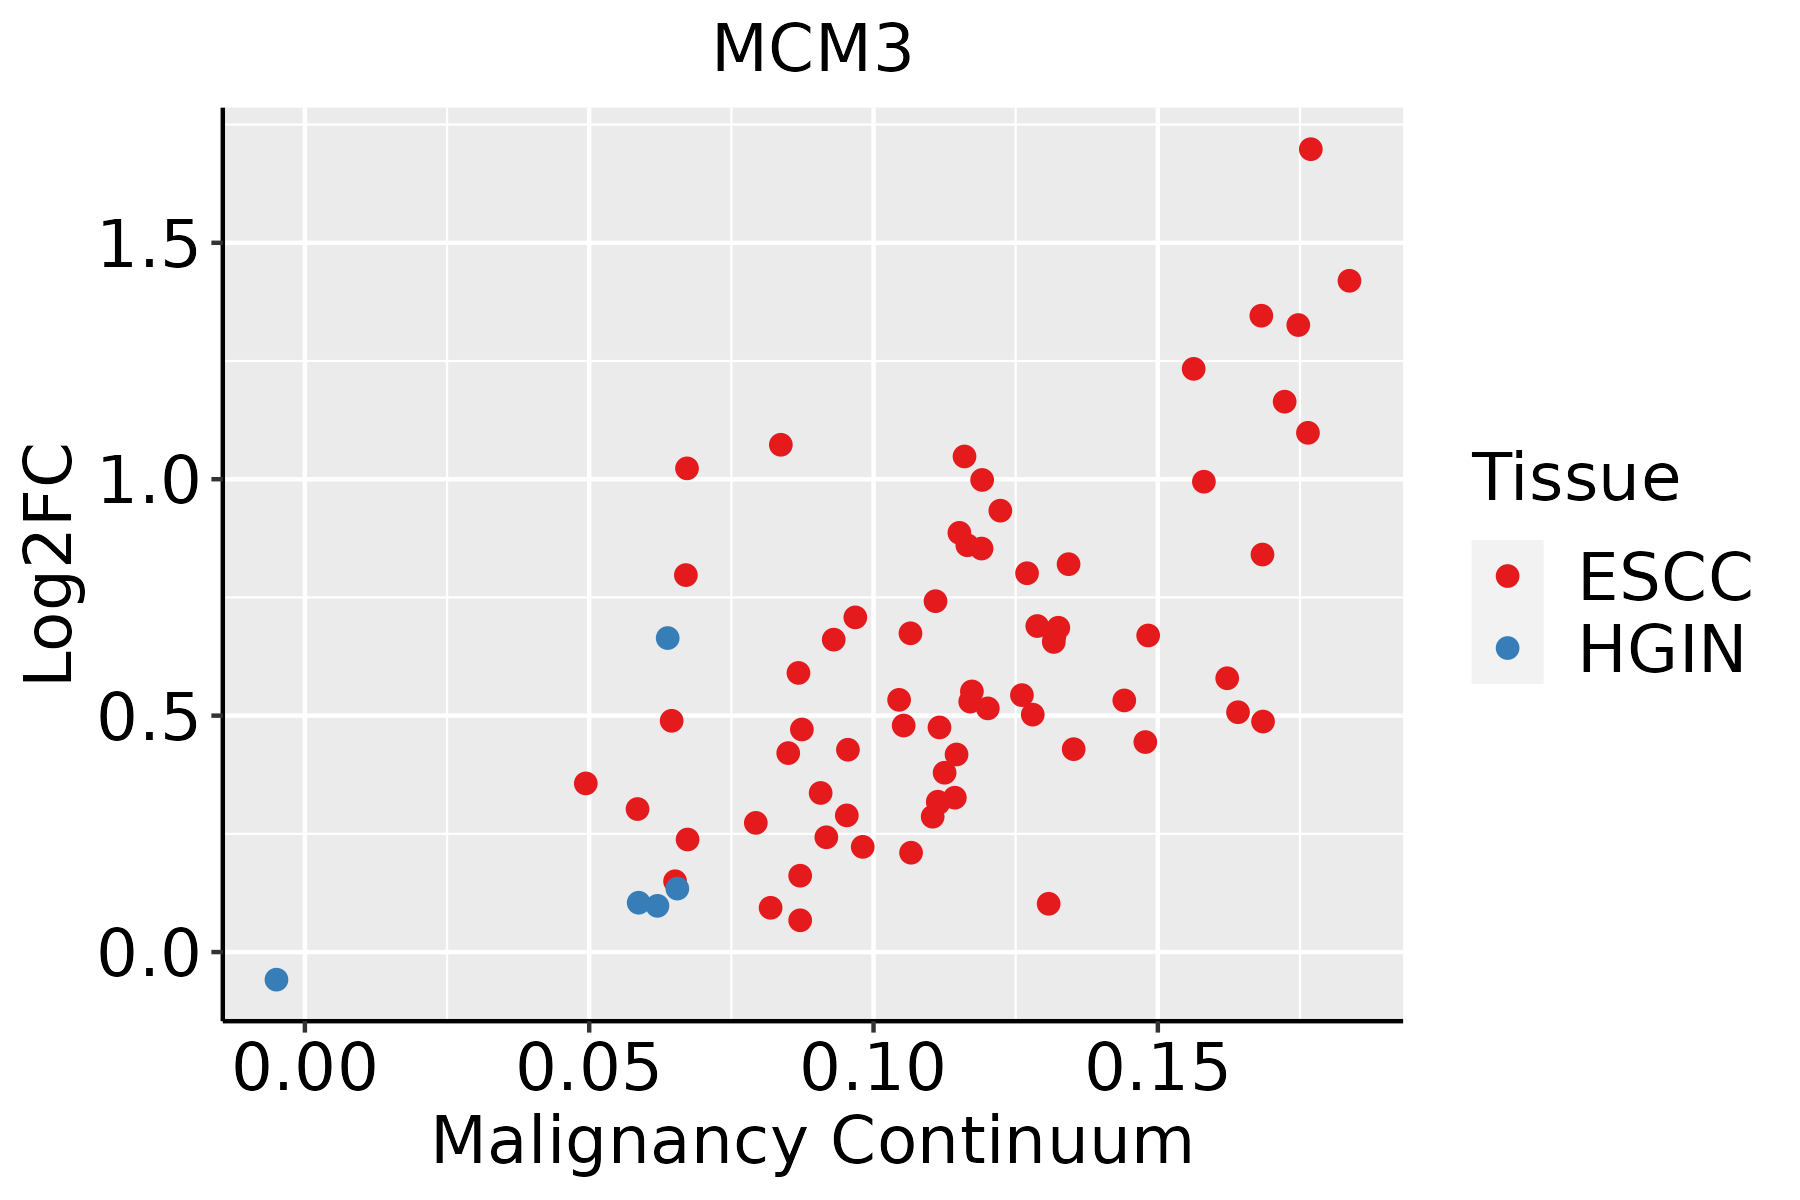 | ESCC: Esophageal squamous cell carcinoma |
| HGIN: High-grade intraepithelial neoplasias | ||
| LGIN: Low-grade intraepithelial neoplasias | ||
| Liver | 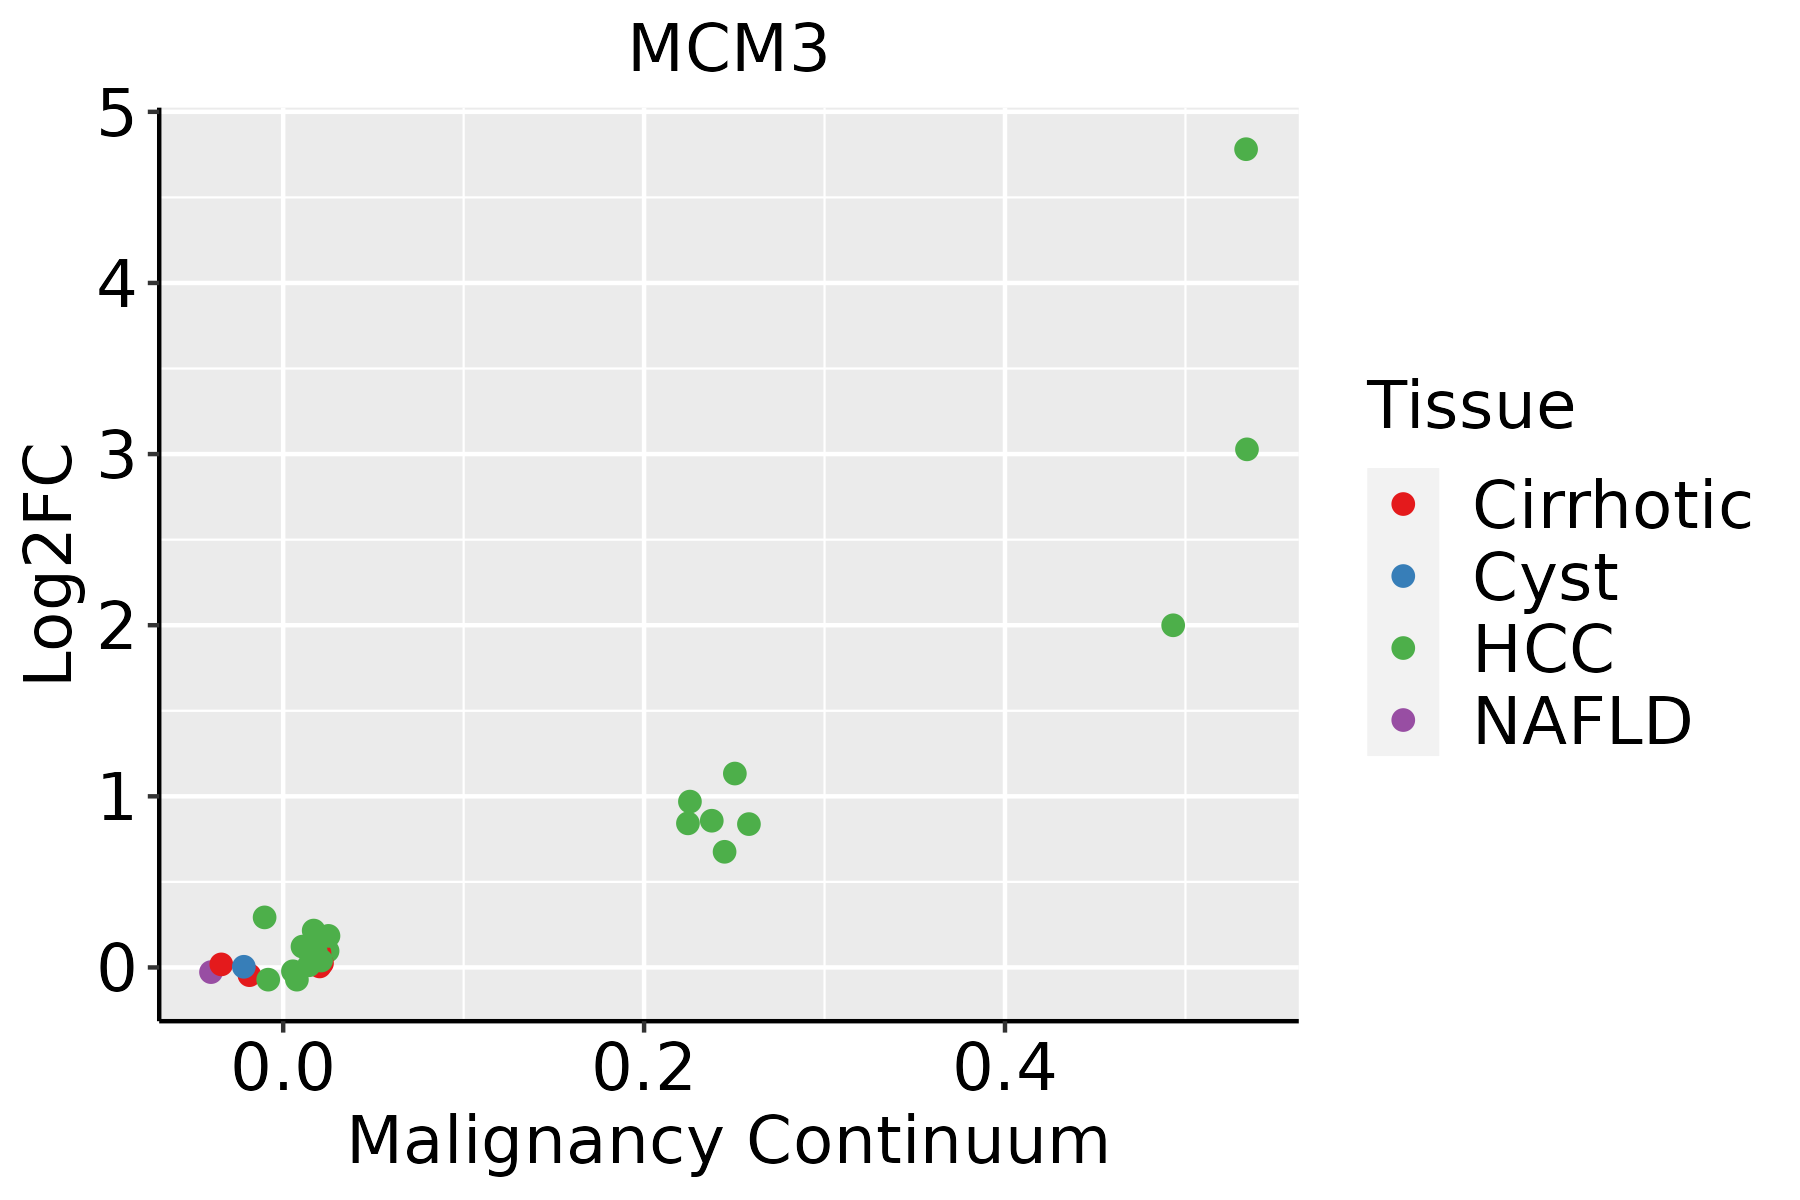 | HCC: Hepatocellular carcinoma |
| NAFLD: Non-alcoholic fatty liver disease | ||
| Oral Cavity | 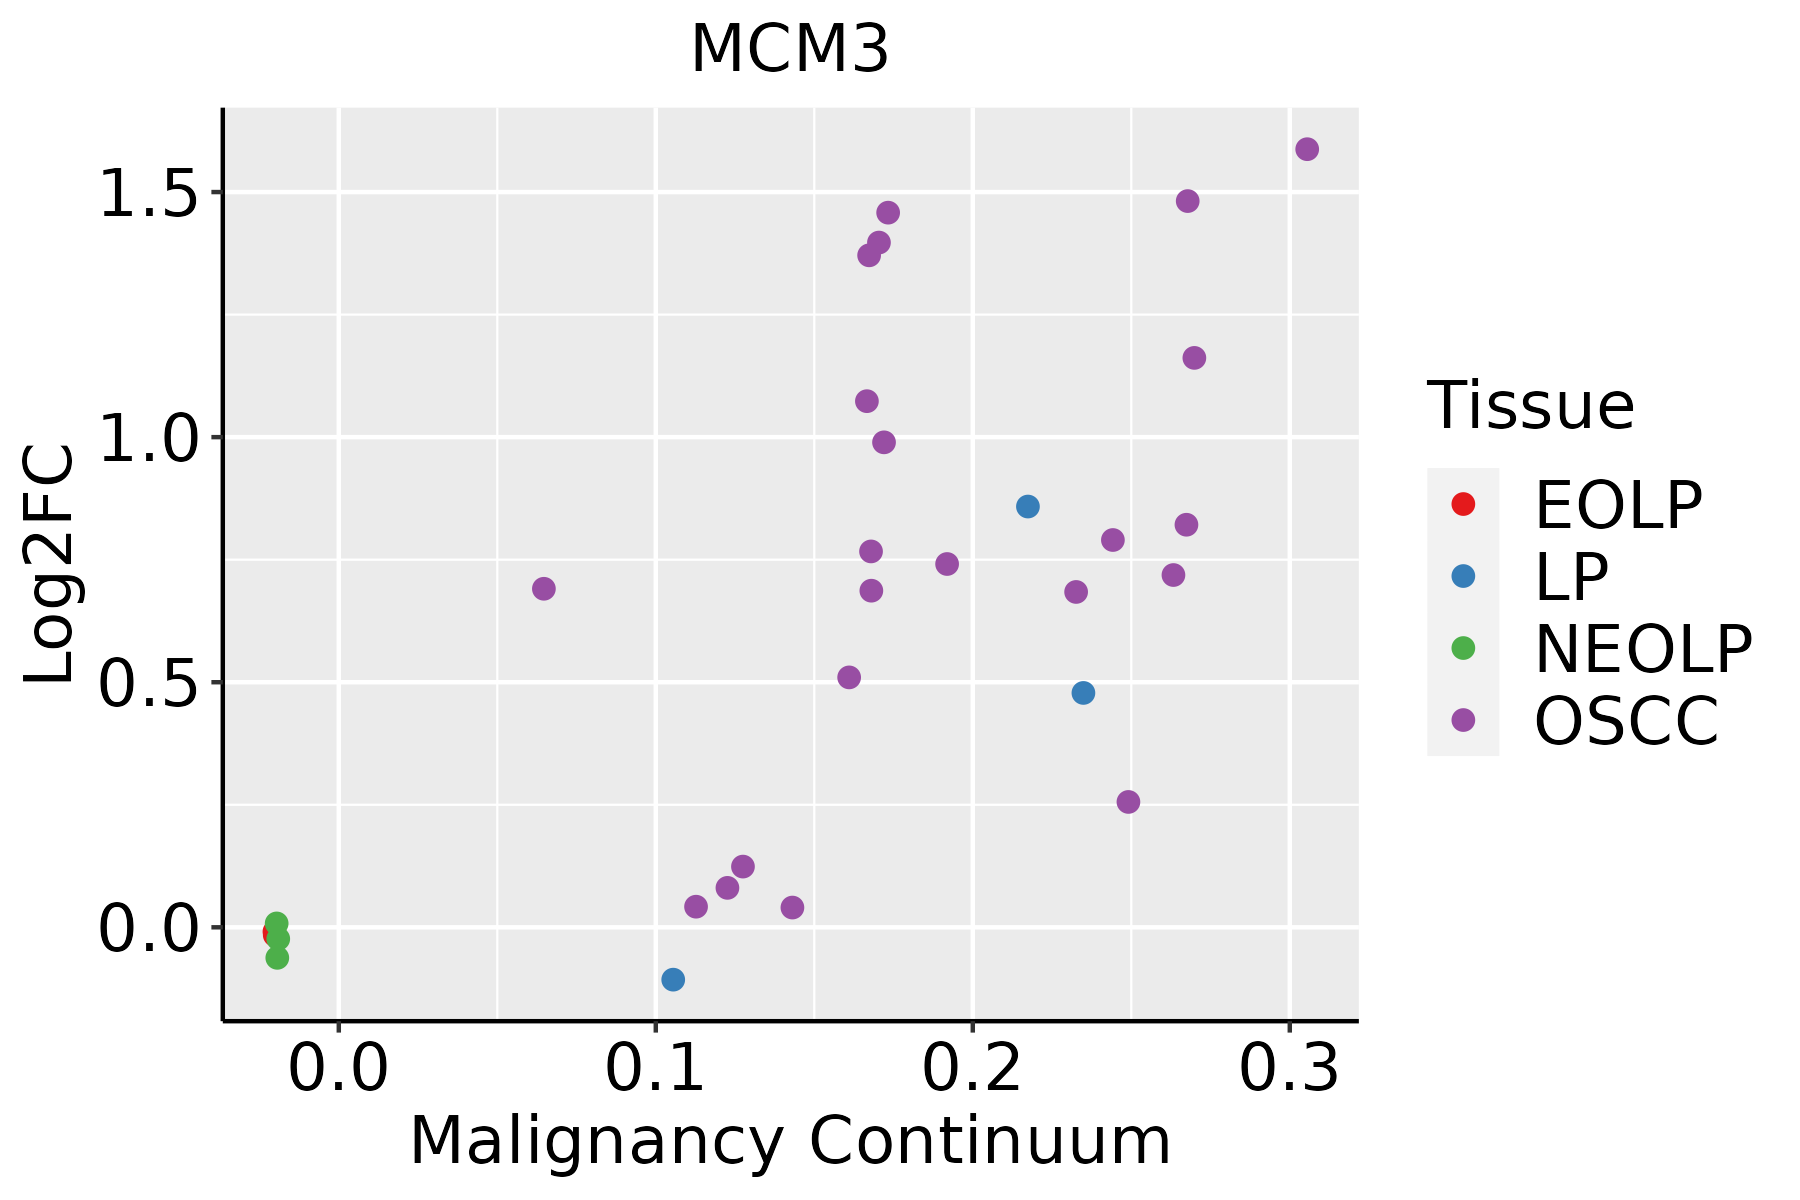 | EOLP: Erosive Oral lichen planus |
| LP: leukoplakia | ||
| NEOLP: Non-erosive oral lichen planus | ||
| OSCC: Oral squamous cell carcinoma | ||
| Skin | 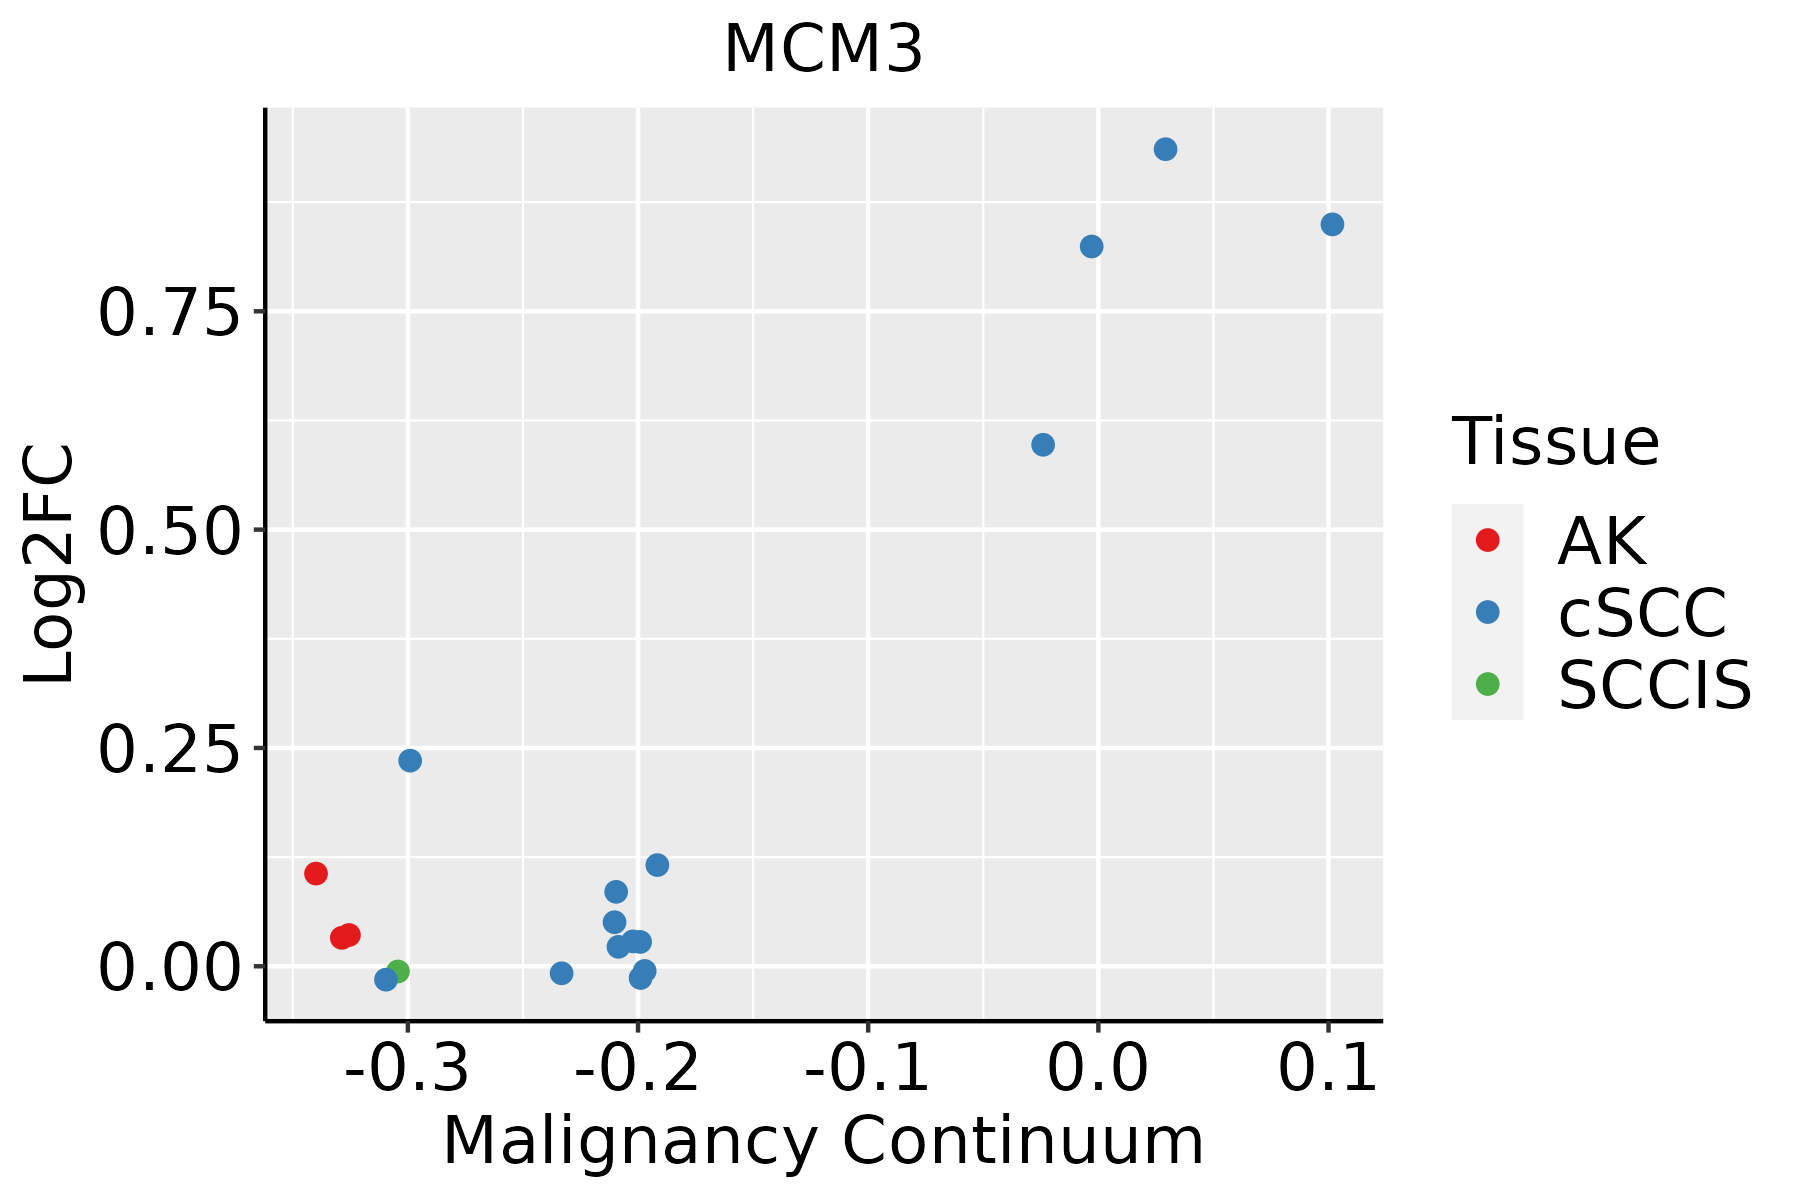 | AK: Actinic keratosis |
| cSCC: Cutaneous squamous cell carcinoma | ||
| SCCIS:squamous cell carcinoma in situ | ||
| Thyroid |  | ATC: Anaplastic thyroid cancer |
| HT: Hashimoto's thyroiditis | ||
| PTC: Papillary thyroid cancer |
| ∗log2FC in expression of this searched gene in stem-like cells from each diseased tissue sample relative to stem-like cells in normal samples in each tissue plotted against the malignancy continuum. Samples are colored based on if they are from different disease stage. |
Top |
Malignant transformation related pathway analysis |
| Find out the enriched GO biological processes and KEGG pathways involved in transition from healthy to precancer to cancer |
| Tissue | Disease Stage | Enriched GO biological Processes |
| Colorectum | AD |  |
| Colorectum | SER |  |
| Colorectum | MSS |  |
| Colorectum | MSI-H |  |
| Colorectum | FAP |  |
| ∗Top 15 enriched GO BP terms are showed in the bar plot of each disease state in each tissue. Each row represents a significant GO biological process which is colored according to the -log10(p.adjust). |
| Page: 1 2 3 4 5 6 7 8 9 |
| GO ID | Tissue | Disease Stage | Description | Gene Ratio | Bg Ratio | pvalue | p.adjust | Count |
| GO:0032392 | Colorectum | AD | DNA geometric change | 31/3918 | 90/18723 | 2.02e-03 | 1.63e-02 | 31 |
| GO:00323921 | Colorectum | MSS | DNA geometric change | 29/3467 | 90/18723 | 1.26e-03 | 1.20e-02 | 29 |
| GO:0006302 | Colorectum | MSS | double-strand break repair | 64/3467 | 251/18723 | 3.58e-03 | 2.65e-02 | 64 |
| GO:0032508 | Colorectum | MSS | DNA duplex unwinding | 25/3467 | 84/18723 | 8.27e-03 | 4.99e-02 | 25 |
| GO:0006260 | Colorectum | MSI-H | DNA replication | 31/1319 | 260/18723 | 2.83e-03 | 3.63e-02 | 31 |
| GO:0006913110 | Esophagus | ESCC | nucleocytoplasmic transport | 230/8552 | 301/18723 | 6.04e-28 | 2.02e-25 | 230 |
| GO:0051169110 | Esophagus | ESCC | nuclear transport | 230/8552 | 301/18723 | 6.04e-28 | 2.02e-25 | 230 |
| GO:0006403110 | Esophagus | ESCC | RNA localization | 166/8552 | 201/18723 | 1.95e-27 | 6.18e-25 | 166 |
| GO:001657015 | Esophagus | ESCC | histone modification | 323/8552 | 463/18723 | 2.61e-26 | 7.88e-24 | 323 |
| GO:005123617 | Esophagus | ESCC | establishment of RNA localization | 134/8552 | 166/18723 | 1.23e-20 | 1.81e-18 | 134 |
| GO:0051168110 | Esophagus | ESCC | nuclear export | 126/8552 | 154/18723 | 1.88e-20 | 2.65e-18 | 126 |
| GO:005102815 | Esophagus | ESCC | mRNA transport | 110/8552 | 130/18723 | 2.76e-20 | 3.80e-18 | 110 |
| GO:001820514 | Esophagus | ESCC | peptidyl-lysine modification | 259/8552 | 376/18723 | 3.90e-20 | 5.26e-18 | 259 |
| GO:005065717 | Esophagus | ESCC | nucleic acid transport | 131/8552 | 163/18723 | 6.94e-20 | 8.46e-18 | 131 |
| GO:005065817 | Esophagus | ESCC | RNA transport | 131/8552 | 163/18723 | 6.94e-20 | 8.46e-18 | 131 |
| GO:001593117 | Esophagus | ESCC | nucleobase-containing compound transport | 162/8552 | 222/18723 | 9.87e-17 | 7.93e-15 | 162 |
| GO:00062604 | Esophagus | ESCC | DNA replication | 181/8552 | 260/18723 | 3.55e-15 | 2.05e-13 | 181 |
| GO:007116612 | Esophagus | ESCC | ribonucleoprotein complex localization | 66/8552 | 77/18723 | 2.94e-13 | 1.38e-11 | 66 |
| GO:007142612 | Esophagus | ESCC | ribonucleoprotein complex export from nucleus | 65/8552 | 76/18723 | 5.56e-13 | 2.50e-11 | 65 |
| GO:001839413 | Esophagus | ESCC | peptidyl-lysine acetylation | 123/8552 | 169/18723 | 6.58e-13 | 2.94e-11 | 123 |
| Page: 1 2 3 4 5 6 7 8 |
| Pathway ID | Tissue | Disease Stage | Description | Gene Ratio | Bg Ratio | pvalue | p.adjust | qvalue | Count |
| hsa0411023 | Esophagus | ESCC | Cell cycle | 126/4205 | 157/8465 | 1.34e-15 | 5.60e-14 | 2.87e-14 | 126 |
| hsa030304 | Esophagus | ESCC | DNA replication | 32/4205 | 36/8465 | 7.71e-07 | 5.06e-06 | 2.59e-06 | 32 |
| hsa0411033 | Esophagus | ESCC | Cell cycle | 126/4205 | 157/8465 | 1.34e-15 | 5.60e-14 | 2.87e-14 | 126 |
| hsa0303011 | Esophagus | ESCC | DNA replication | 32/4205 | 36/8465 | 7.71e-07 | 5.06e-06 | 2.59e-06 | 32 |
| hsa041102 | Liver | HCC | Cell cycle | 106/4020 | 157/8465 | 2.54e-07 | 3.04e-06 | 1.69e-06 | 106 |
| hsa041103 | Liver | HCC | Cell cycle | 106/4020 | 157/8465 | 2.54e-07 | 3.04e-06 | 1.69e-06 | 106 |
| hsa041108 | Oral cavity | OSCC | Cell cycle | 118/3704 | 157/8465 | 7.15e-16 | 2.66e-14 | 1.35e-14 | 118 |
| hsa03030 | Oral cavity | OSCC | DNA replication | 31/3704 | 36/8465 | 1.70e-07 | 1.19e-06 | 6.03e-07 | 31 |
| hsa0411015 | Oral cavity | OSCC | Cell cycle | 118/3704 | 157/8465 | 7.15e-16 | 2.66e-14 | 1.35e-14 | 118 |
| hsa030301 | Oral cavity | OSCC | DNA replication | 31/3704 | 36/8465 | 1.70e-07 | 1.19e-06 | 6.03e-07 | 31 |
| Page: 1 |
Top |
Cell-cell communication analysis |
| Identification of potential cell-cell interactions between two cell types and their ligand-receptor pairs for different disease states |
| Ligand | Receptor | LRpair | Pathway | Tissue | Disease Stage |
| Page: 1 |
Top |
Single-cell gene regulatory network inference analysis |
| Find out the significant the regulons (TFs) and the target genes of each regulon across cell types for different disease states |
| TF | Cell Type | Tissue | Disease Stage | Target Gene | RSS | Regulon Activity |
| ∗The dot plots of a searched regulon are shown for all cell subpopulations in each disease state of each tissue based on the regulon specific score inferred using pySCENIC and by calculating the average expression. |
| Page: 1 |
Top |
Somatic mutation of malignant transformation related genes |
| Annotation of somatic variants for genes involved in malignant transformation |
| Hugo Symbol | Variant Class | Variant Classification | dbSNP RS | HGVSc | HGVSp | HGVSp Short | SWISSPROT | BIOTYPE | SIFT | PolyPhen | Tumor Sample Barcode | Tissue | Histology | Sex | Age | Stage | Therapy Types | Drugs | Outcome |
| MCM3 | SNV | Missense_Mutation | c.1723N>C | p.Asp575His | p.D575H | P25205 | protein_coding | tolerated(0.12) | benign(0.03) | TCGA-C8-A27B-01 | Breast | breast invasive carcinoma | Female | <65 | I/II | Chemotherapy | 5-fluorouracil | CR | |
| MCM3 | SNV | Missense_Mutation | c.1769A>C | p.Tyr590Ser | p.Y590S | P25205 | protein_coding | deleterious(0) | probably_damaging(0.985) | TCGA-E2-A1LA-01 | Breast | breast invasive carcinoma | Female | <65 | I/II | Hormone Therapy | arimidex | SD | |
| MCM3 | insertion | Frame_Shift_Ins | novel | c.2371_2372insTTTTTTA | p.Ala791ValfsTer41 | p.A791Vfs*41 | P25205 | protein_coding | TCGA-A8-A07U-01 | Breast | breast invasive carcinoma | Female | >=65 | III/IV | Chemotherapy | 5-fluorouracil | SD | ||
| MCM3 | insertion | Frame_Shift_Ins | novel | c.2370_2371insCCATTTCGTACACATGGTCTTAATAGTCATAGTGT | p.Ala791ProfsTer32 | p.A791Pfs*32 | P25205 | protein_coding | TCGA-A8-A07U-01 | Breast | breast invasive carcinoma | Female | >=65 | III/IV | Chemotherapy | 5-fluorouracil | SD | ||
| MCM3 | SNV | Missense_Mutation | rs748679863 | c.1839N>A | p.Met613Ile | p.M613I | P25205 | protein_coding | tolerated(0.48) | benign(0.05) | TCGA-HM-A4S6-01 | Cervix | cervical & endocervical cancer | Female | <65 | III/IV | Chemotherapy | cisplatin | CR |
| MCM3 | SNV | Missense_Mutation | rs537125531 | c.2161N>A | p.Asp721Asn | p.D721N | P25205 | protein_coding | tolerated(0.14) | benign(0.081) | TCGA-AA-3488-01 | Colorectum | colon adenocarcinoma | Male | <65 | III/IV | Unknown | Unknown | PD |
| MCM3 | SNV | Missense_Mutation | c.2554N>A | p.Leu852Ile | p.L852I | P25205 | protein_coding | tolerated(0.12) | probably_damaging(0.999) | TCGA-AA-3715-01 | Colorectum | colon adenocarcinoma | Male | >=65 | I/II | Unknown | Unknown | PD | |
| MCM3 | SNV | Missense_Mutation | c.1681N>A | p.Asp561Asn | p.D561N | P25205 | protein_coding | tolerated(0.14) | possibly_damaging(0.506) | TCGA-AZ-4323-01 | Colorectum | colon adenocarcinoma | Male | <65 | III/IV | Chemotherapy | oxaliplatin | PD | |
| MCM3 | SNV | Missense_Mutation | rs371347878 | c.547N>T | p.Arg183Cys | p.R183C | P25205 | protein_coding | deleterious(0.01) | probably_damaging(0.993) | TCGA-AG-A002-01 | Colorectum | rectum adenocarcinoma | Male | <65 | I/II | Unknown | Unknown | SD |
| MCM3 | SNV | Missense_Mutation | rs750663816 | c.299N>A | p.Arg100His | p.R100H | P25205 | protein_coding | tolerated(0.06) | probably_damaging(0.993) | TCGA-EI-6507-01 | Colorectum | rectum adenocarcinoma | Male | <65 | I/II | Unknown | Unknown | SD |
| Page: 1 2 3 4 5 6 7 |
Top |
Related drugs of malignant transformation related genes |
| Identification of chemicals and drugs interact with genes involved in malignant transfromation |
| (DGIdb 4.0) |
| Entrez ID | Symbol | Category | Interaction Types | Drug Claim Name | Drug Name | PMIDs |
| Page: 1 |

Copyright 2023-Present -The University of Texas Health Science Center at Houston |