
|
|||||
|
 | |
| |
| |
| |
| |
| |
|
Gene: MCEE |
Gene summary for MCEE |
| Gene information | Species | Human | Gene symbol | MCEE | Gene ID | 84693 |
| Gene name | methylmalonyl-CoA epimerase | |
| Gene Alias | GLOD2 | |
| Cytomap | 2p13.3 | |
| Gene Type | protein-coding | GO ID | GO:0006082 | UniProtAcc | Q96PE7 |
Top |
Malignant transformation analysis |
| Identification of the aberrant gene expression in precancerous and cancerous lesions by comparing the gene expression of stem-like cells in diseased tissues with normal stem cells |
| Entrez ID | Symbol | Replicates | Species | Organ | Tissue | Adj P-value | Log2FC | Malignancy |
| 84693 | MCEE | LZE4T | Human | Esophagus | ESCC | 5.67e-05 | 1.09e-01 | 0.0811 |
| 84693 | MCEE | LZE22T | Human | Esophagus | ESCC | 8.17e-04 | 1.67e-01 | 0.068 |
| 84693 | MCEE | LZE24T | Human | Esophagus | ESCC | 7.44e-11 | 2.83e-01 | 0.0596 |
| 84693 | MCEE | P1T-E | Human | Esophagus | ESCC | 3.03e-08 | 4.11e-01 | 0.0875 |
| 84693 | MCEE | P2T-E | Human | Esophagus | ESCC | 4.63e-17 | 2.58e-01 | 0.1177 |
| 84693 | MCEE | P4T-E | Human | Esophagus | ESCC | 2.12e-15 | 2.79e-01 | 0.1323 |
| 84693 | MCEE | P5T-E | Human | Esophagus | ESCC | 7.82e-06 | 1.10e-01 | 0.1327 |
| 84693 | MCEE | P8T-E | Human | Esophagus | ESCC | 8.13e-19 | 1.38e-01 | 0.0889 |
| 84693 | MCEE | P9T-E | Human | Esophagus | ESCC | 6.65e-09 | 1.63e-01 | 0.1131 |
| 84693 | MCEE | P10T-E | Human | Esophagus | ESCC | 1.38e-11 | 1.76e-01 | 0.116 |
| 84693 | MCEE | P11T-E | Human | Esophagus | ESCC | 6.20e-09 | 3.18e-01 | 0.1426 |
| 84693 | MCEE | P12T-E | Human | Esophagus | ESCC | 1.28e-26 | 2.57e-01 | 0.1122 |
| 84693 | MCEE | P15T-E | Human | Esophagus | ESCC | 2.41e-08 | 1.95e-01 | 0.1149 |
| 84693 | MCEE | P16T-E | Human | Esophagus | ESCC | 6.69e-13 | 1.71e-01 | 0.1153 |
| 84693 | MCEE | P19T-E | Human | Esophagus | ESCC | 1.10e-04 | 4.34e-01 | 0.1662 |
| 84693 | MCEE | P20T-E | Human | Esophagus | ESCC | 1.18e-16 | 4.44e-01 | 0.1124 |
| 84693 | MCEE | P21T-E | Human | Esophagus | ESCC | 8.10e-15 | 2.91e-01 | 0.1617 |
| 84693 | MCEE | P22T-E | Human | Esophagus | ESCC | 1.94e-23 | 2.18e-01 | 0.1236 |
| 84693 | MCEE | P23T-E | Human | Esophagus | ESCC | 3.12e-21 | 5.42e-01 | 0.108 |
| 84693 | MCEE | P24T-E | Human | Esophagus | ESCC | 2.70e-15 | 1.89e-01 | 0.1287 |
| Page: 1 2 3 4 |
| Tissue | Expression Dynamics | Abbreviation |
| Esophagus |  | ESCC: Esophageal squamous cell carcinoma |
| HGIN: High-grade intraepithelial neoplasias | ||
| LGIN: Low-grade intraepithelial neoplasias | ||
| Liver | 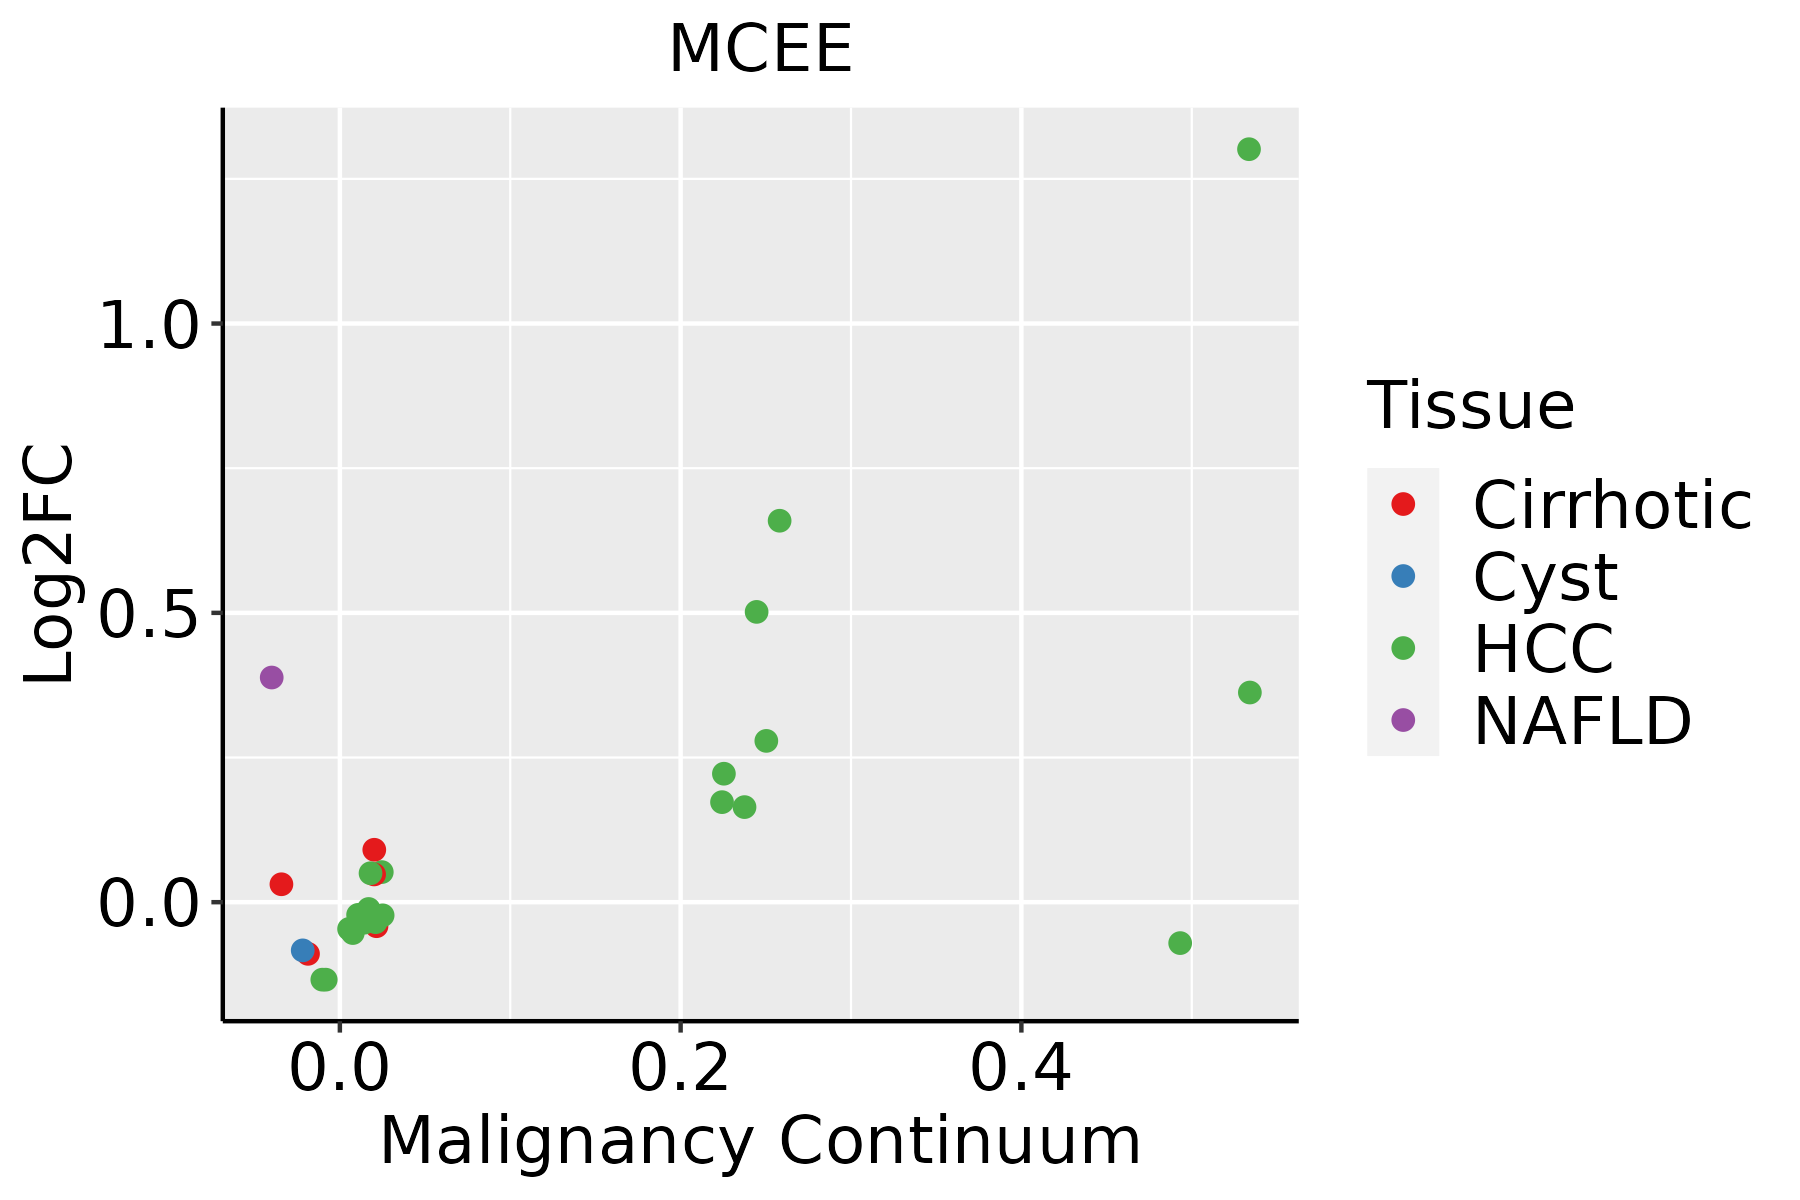 | HCC: Hepatocellular carcinoma |
| NAFLD: Non-alcoholic fatty liver disease | ||
| Oral Cavity | 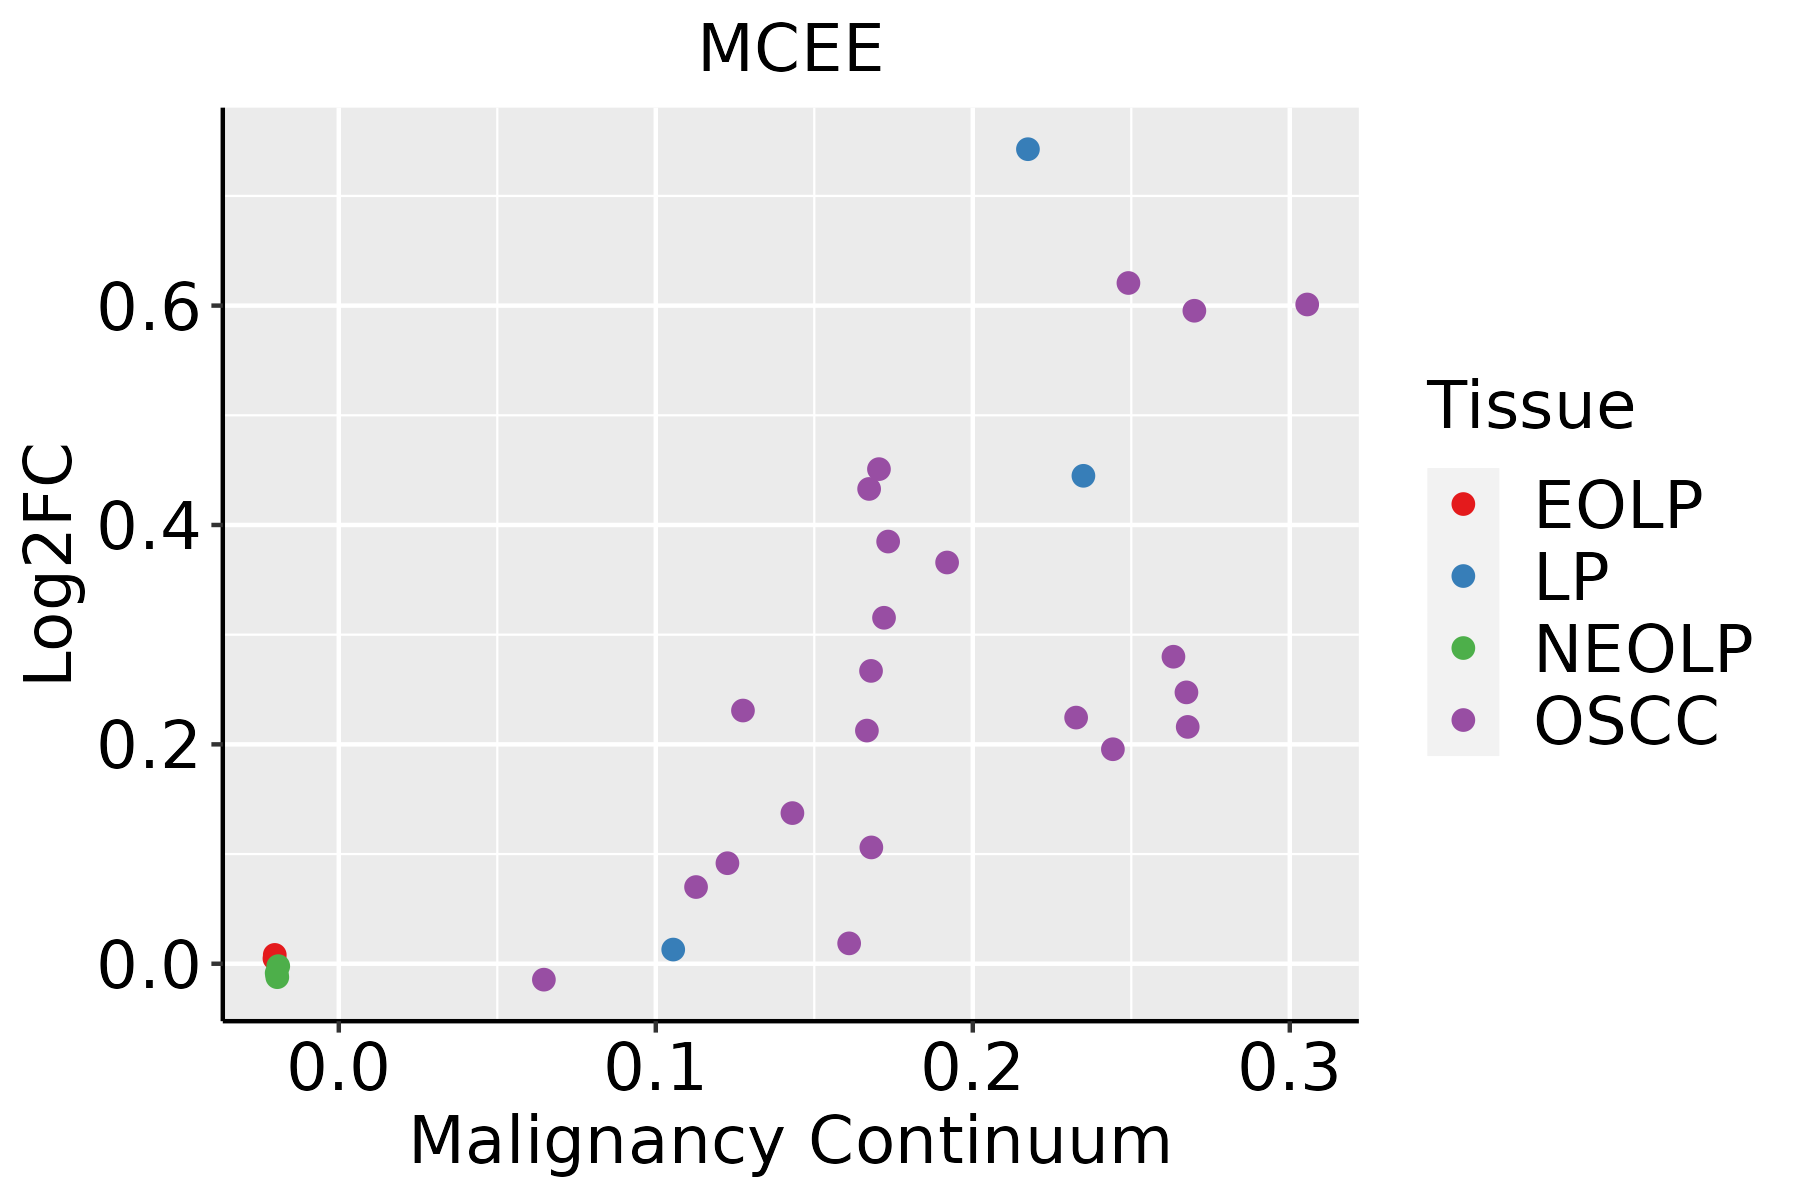 | EOLP: Erosive Oral lichen planus |
| LP: leukoplakia | ||
| NEOLP: Non-erosive oral lichen planus | ||
| OSCC: Oral squamous cell carcinoma |
| ∗log2FC in expression of this searched gene in stem-like cells from each diseased tissue sample relative to stem-like cells in normal samples in each tissue plotted against the malignancy continuum. Samples are colored based on if they are from different disease stage. |
Top |
Malignant transformation related pathway analysis |
| Find out the enriched GO biological processes and KEGG pathways involved in transition from healthy to precancer to cancer |
| Tissue | Disease Stage | Enriched GO biological Processes |
| Colorectum | AD |  |
| Colorectum | SER |  |
| Colorectum | MSS |  |
| Colorectum | MSI-H |  |
| Colorectum | FAP |  |
| ∗Top 15 enriched GO BP terms are showed in the bar plot of each disease state in each tissue. Each row represents a significant GO biological process which is colored according to the -log10(p.adjust). |
| Page: 1 2 3 4 5 6 7 8 9 |
| GO ID | Tissue | Disease Stage | Description | Gene Ratio | Bg Ratio | pvalue | p.adjust | Count |
| GO:0006753110 | Esophagus | ESCC | nucleoside phosphate metabolic process | 288/8552 | 497/18723 | 1.80e-08 | 3.50e-07 | 288 |
| GO:0019693111 | Esophagus | ESCC | ribose phosphate metabolic process | 234/8552 | 396/18723 | 4.24e-08 | 7.76e-07 | 234 |
| GO:0009117111 | Esophagus | ESCC | nucleotide metabolic process | 282/8552 | 489/18723 | 4.70e-08 | 8.50e-07 | 282 |
| GO:00067906 | Esophagus | ESCC | sulfur compound metabolic process | 201/8552 | 339/18723 | 2.64e-07 | 3.94e-06 | 201 |
| GO:0009259111 | Esophagus | ESCC | ribonucleotide metabolic process | 224/8552 | 385/18723 | 4.41e-07 | 6.00e-06 | 224 |
| GO:0072521111 | Esophagus | ESCC | purine-containing compound metabolic process | 238/8552 | 416/18723 | 1.20e-06 | 1.49e-05 | 238 |
| GO:0009150111 | Esophagus | ESCC | purine ribonucleotide metabolic process | 213/8552 | 368/18723 | 1.40e-06 | 1.69e-05 | 213 |
| GO:0006163111 | Esophagus | ESCC | purine nucleotide metabolic process | 226/8552 | 396/18723 | 2.81e-06 | 3.21e-05 | 226 |
| GO:00090628 | Esophagus | ESCC | fatty acid catabolic process | 66/8552 | 100/18723 | 3.21e-05 | 2.66e-04 | 66 |
| GO:00066318 | Esophagus | ESCC | fatty acid metabolic process | 217/8552 | 390/18723 | 4.21e-05 | 3.39e-04 | 217 |
| GO:00723297 | Esophagus | ESCC | monocarboxylic acid catabolic process | 74/8552 | 122/18723 | 6.03e-04 | 3.27e-03 | 74 |
| GO:00338655 | Esophagus | ESCC | nucleoside bisphosphate metabolic process | 77/8552 | 128/18723 | 6.71e-04 | 3.55e-03 | 77 |
| GO:00338755 | Esophagus | ESCC | ribonucleoside bisphosphate metabolic process | 77/8552 | 128/18723 | 6.71e-04 | 3.55e-03 | 77 |
| GO:00340325 | Esophagus | ESCC | purine nucleoside bisphosphate metabolic process | 77/8552 | 128/18723 | 6.71e-04 | 3.55e-03 | 77 |
| GO:00442427 | Esophagus | ESCC | cellular lipid catabolic process | 121/8552 | 214/18723 | 8.63e-04 | 4.43e-03 | 121 |
| GO:00442827 | Esophagus | ESCC | small molecule catabolic process | 201/8552 | 376/18723 | 1.35e-03 | 6.41e-03 | 201 |
| GO:00160427 | Esophagus | ESCC | lipid catabolic process | 168/8552 | 320/18723 | 7.97e-03 | 2.84e-02 | 168 |
| GO:00066374 | Esophagus | ESCC | acyl-CoA metabolic process | 55/8552 | 96/18723 | 1.45e-02 | 4.71e-02 | 55 |
| GO:00353834 | Esophagus | ESCC | thioester metabolic process | 55/8552 | 96/18723 | 1.45e-02 | 4.71e-02 | 55 |
| GO:00463953 | Liver | NAFLD | carboxylic acid catabolic process | 73/1882 | 236/18723 | 4.16e-19 | 1.22e-15 | 73 |
| Page: 1 2 3 4 5 |
| Pathway ID | Tissue | Disease Stage | Description | Gene Ratio | Bg Ratio | pvalue | p.adjust | qvalue | Count |
| hsa0120023 | Esophagus | ESCC | Carbon metabolism | 79/4205 | 115/8465 | 2.50e-05 | 1.21e-04 | 6.22e-05 | 79 |
| hsa002809 | Esophagus | ESCC | Valine, leucine and isoleucine degradation | 34/4205 | 48/8465 | 2.34e-03 | 6.54e-03 | 3.35e-03 | 34 |
| hsa006306 | Esophagus | ESCC | Glyoxylate and dicarboxylate metabolism | 21/4205 | 30/8465 | 1.95e-02 | 4.35e-02 | 2.23e-02 | 21 |
| hsa0120033 | Esophagus | ESCC | Carbon metabolism | 79/4205 | 115/8465 | 2.50e-05 | 1.21e-04 | 6.22e-05 | 79 |
| hsa0028014 | Esophagus | ESCC | Valine, leucine and isoleucine degradation | 34/4205 | 48/8465 | 2.34e-03 | 6.54e-03 | 3.35e-03 | 34 |
| hsa0063013 | Esophagus | ESCC | Glyoxylate and dicarboxylate metabolism | 21/4205 | 30/8465 | 1.95e-02 | 4.35e-02 | 2.23e-02 | 21 |
| hsa002806 | Liver | NAFLD | Valine, leucine and isoleucine degradation | 20/1043 | 48/8465 | 3.03e-07 | 1.65e-05 | 1.33e-05 | 20 |
| hsa0064010 | Liver | NAFLD | Propanoate metabolism | 12/1043 | 32/8465 | 2.44e-04 | 4.45e-03 | 3.58e-03 | 12 |
| hsa0120010 | Liver | NAFLD | Carbon metabolism | 26/1043 | 115/8465 | 1.39e-03 | 1.71e-02 | 1.38e-02 | 26 |
| hsa0028011 | Liver | NAFLD | Valine, leucine and isoleucine degradation | 20/1043 | 48/8465 | 3.03e-07 | 1.65e-05 | 1.33e-05 | 20 |
| hsa0064011 | Liver | NAFLD | Propanoate metabolism | 12/1043 | 32/8465 | 2.44e-04 | 4.45e-03 | 3.58e-03 | 12 |
| hsa0120011 | Liver | NAFLD | Carbon metabolism | 26/1043 | 115/8465 | 1.39e-03 | 1.71e-02 | 1.38e-02 | 26 |
| hsa0120041 | Liver | HCC | Carbon metabolism | 89/4020 | 115/8465 | 3.92e-11 | 6.56e-10 | 3.65e-10 | 89 |
| hsa0028041 | Liver | HCC | Valine, leucine and isoleucine degradation | 41/4020 | 48/8465 | 4.84e-08 | 7.05e-07 | 3.92e-07 | 41 |
| hsa0063021 | Liver | HCC | Glyoxylate and dicarboxylate metabolism | 24/4020 | 30/8465 | 2.66e-04 | 1.24e-03 | 6.88e-04 | 24 |
| hsa0064041 | Liver | HCC | Propanoate metabolism | 24/4020 | 32/8465 | 1.42e-03 | 5.07e-03 | 2.82e-03 | 24 |
| hsa0120051 | Liver | HCC | Carbon metabolism | 89/4020 | 115/8465 | 3.92e-11 | 6.56e-10 | 3.65e-10 | 89 |
| hsa0028051 | Liver | HCC | Valine, leucine and isoleucine degradation | 41/4020 | 48/8465 | 4.84e-08 | 7.05e-07 | 3.92e-07 | 41 |
| hsa0063031 | Liver | HCC | Glyoxylate and dicarboxylate metabolism | 24/4020 | 30/8465 | 2.66e-04 | 1.24e-03 | 6.88e-04 | 24 |
| hsa0064051 | Liver | HCC | Propanoate metabolism | 24/4020 | 32/8465 | 1.42e-03 | 5.07e-03 | 2.82e-03 | 24 |
| Page: 1 2 |
Top |
Cell-cell communication analysis |
| Identification of potential cell-cell interactions between two cell types and their ligand-receptor pairs for different disease states |
| Ligand | Receptor | LRpair | Pathway | Tissue | Disease Stage |
| Page: 1 |
Top |
Single-cell gene regulatory network inference analysis |
| Find out the significant the regulons (TFs) and the target genes of each regulon across cell types for different disease states |
| TF | Cell Type | Tissue | Disease Stage | Target Gene | RSS | Regulon Activity |
| ∗The dot plots of a searched regulon are shown for all cell subpopulations in each disease state of each tissue based on the regulon specific score inferred using pySCENIC and by calculating the average expression. |
| Page: 1 |
Top |
Somatic mutation of malignant transformation related genes |
| Annotation of somatic variants for genes involved in malignant transformation |
| Hugo Symbol | Variant Class | Variant Classification | dbSNP RS | HGVSc | HGVSp | HGVSp Short | SWISSPROT | BIOTYPE | SIFT | PolyPhen | Tumor Sample Barcode | Tissue | Histology | Sex | Age | Stage | Therapy Types | Drugs | Outcome |
| MCEE | SNV | Missense_Mutation | c.206T>C | p.Leu69Pro | p.L69P | Q96PE7 | protein_coding | deleterious(0) | probably_damaging(0.999) | TCGA-AA-3693-01 | Colorectum | colon adenocarcinoma | Female | >=65 | III/IV | Unknown | Unknown | SD | |
| MCEE | SNV | Missense_Mutation | c.244C>T | p.His82Tyr | p.H82Y | Q96PE7 | protein_coding | deleterious(0) | probably_damaging(0.975) | TCGA-DM-A0XF-01 | Colorectum | colon adenocarcinoma | Female | >=65 | III/IV | Chemotherapy | mayo | CR | |
| MCEE | SNV | Missense_Mutation | c.122N>A | p.Ser41Tyr | p.S41Y | Q96PE7 | protein_coding | deleterious(0) | benign(0.232) | TCGA-AG-A002-01 | Colorectum | rectum adenocarcinoma | Male | <65 | I/II | Unknown | Unknown | SD | |
| MCEE | SNV | Missense_Mutation | rs779113206 | c.376N>A | p.Glu126Lys | p.E126K | Q96PE7 | protein_coding | deleterious(0.01) | possibly_damaging(0.528) | TCGA-AP-A0LM-01 | Endometrium | uterine corpus endometrioid carcinoma | Female | <65 | III/IV | Chemotherapy | cisplatin | SD |
| MCEE | insertion | Frame_Shift_Ins | novel | c.419_420insA | p.Lys141GlufsTer7 | p.K141Efs*7 | Q96PE7 | protein_coding | TCGA-B5-A3FA-01 | Endometrium | uterine corpus endometrioid carcinoma | Female | >=65 | I/II | Unknown | Unknown | SD | ||
| MCEE | SNV | Missense_Mutation | novel | c.310N>A | p.Arg104Ser | p.R104S | Q96PE7 | protein_coding | tolerated(0.37) | benign(0) | TCGA-05-4427-01 | Lung | lung adenocarcinoma | Female | >=65 | I/II | Chemotherapy | cisplatin | CR |
| MCEE | SNV | Missense_Mutation | c.441N>T | p.Glu147Asp | p.E147D | Q96PE7 | protein_coding | tolerated(0.71) | benign(0.001) | TCGA-44-7670-01 | Lung | lung adenocarcinoma | Female | <65 | I/II | Chemotherapy | docetaxel | SD | |
| MCEE | SNV | Missense_Mutation | c.198N>T | p.Lys66Asn | p.K66N | Q96PE7 | protein_coding | deleterious(0) | benign(0.364) | TCGA-46-3769-01 | Lung | lung squamous cell carcinoma | Male | <65 | III/IV | Chemotherapy | cisplatin | SD | |
| MCEE | SNV | Missense_Mutation | novel | c.232N>T | p.Pro78Ser | p.P78S | Q96PE7 | protein_coding | tolerated(0.13) | benign(0.027) | TCGA-90-A4ED-01 | Lung | lung squamous cell carcinoma | Male | >=65 | I/II | Unknown | Unknown | SD |
| MCEE | SNV | Missense_Mutation | c.299N>T | p.His100Leu | p.H100L | Q96PE7 | protein_coding | tolerated(0.05) | benign(0.285) | TCGA-BR-4361-01 | Stomach | stomach adenocarcinoma | Female | >=65 | III/IV | Unknown | Unknown | SD |
| Page: 1 2 |
Top |
Related drugs of malignant transformation related genes |
| Identification of chemicals and drugs interact with genes involved in malignant transfromation |
| (DGIdb 4.0) |
| Entrez ID | Symbol | Category | Interaction Types | Drug Claim Name | Drug Name | PMIDs |
| Page: 1 |

Copyright 2023-Present -The University of Texas Health Science Center at Houston |