| Tissue | Expression Dynamics | Abbreviation |
| Breast | 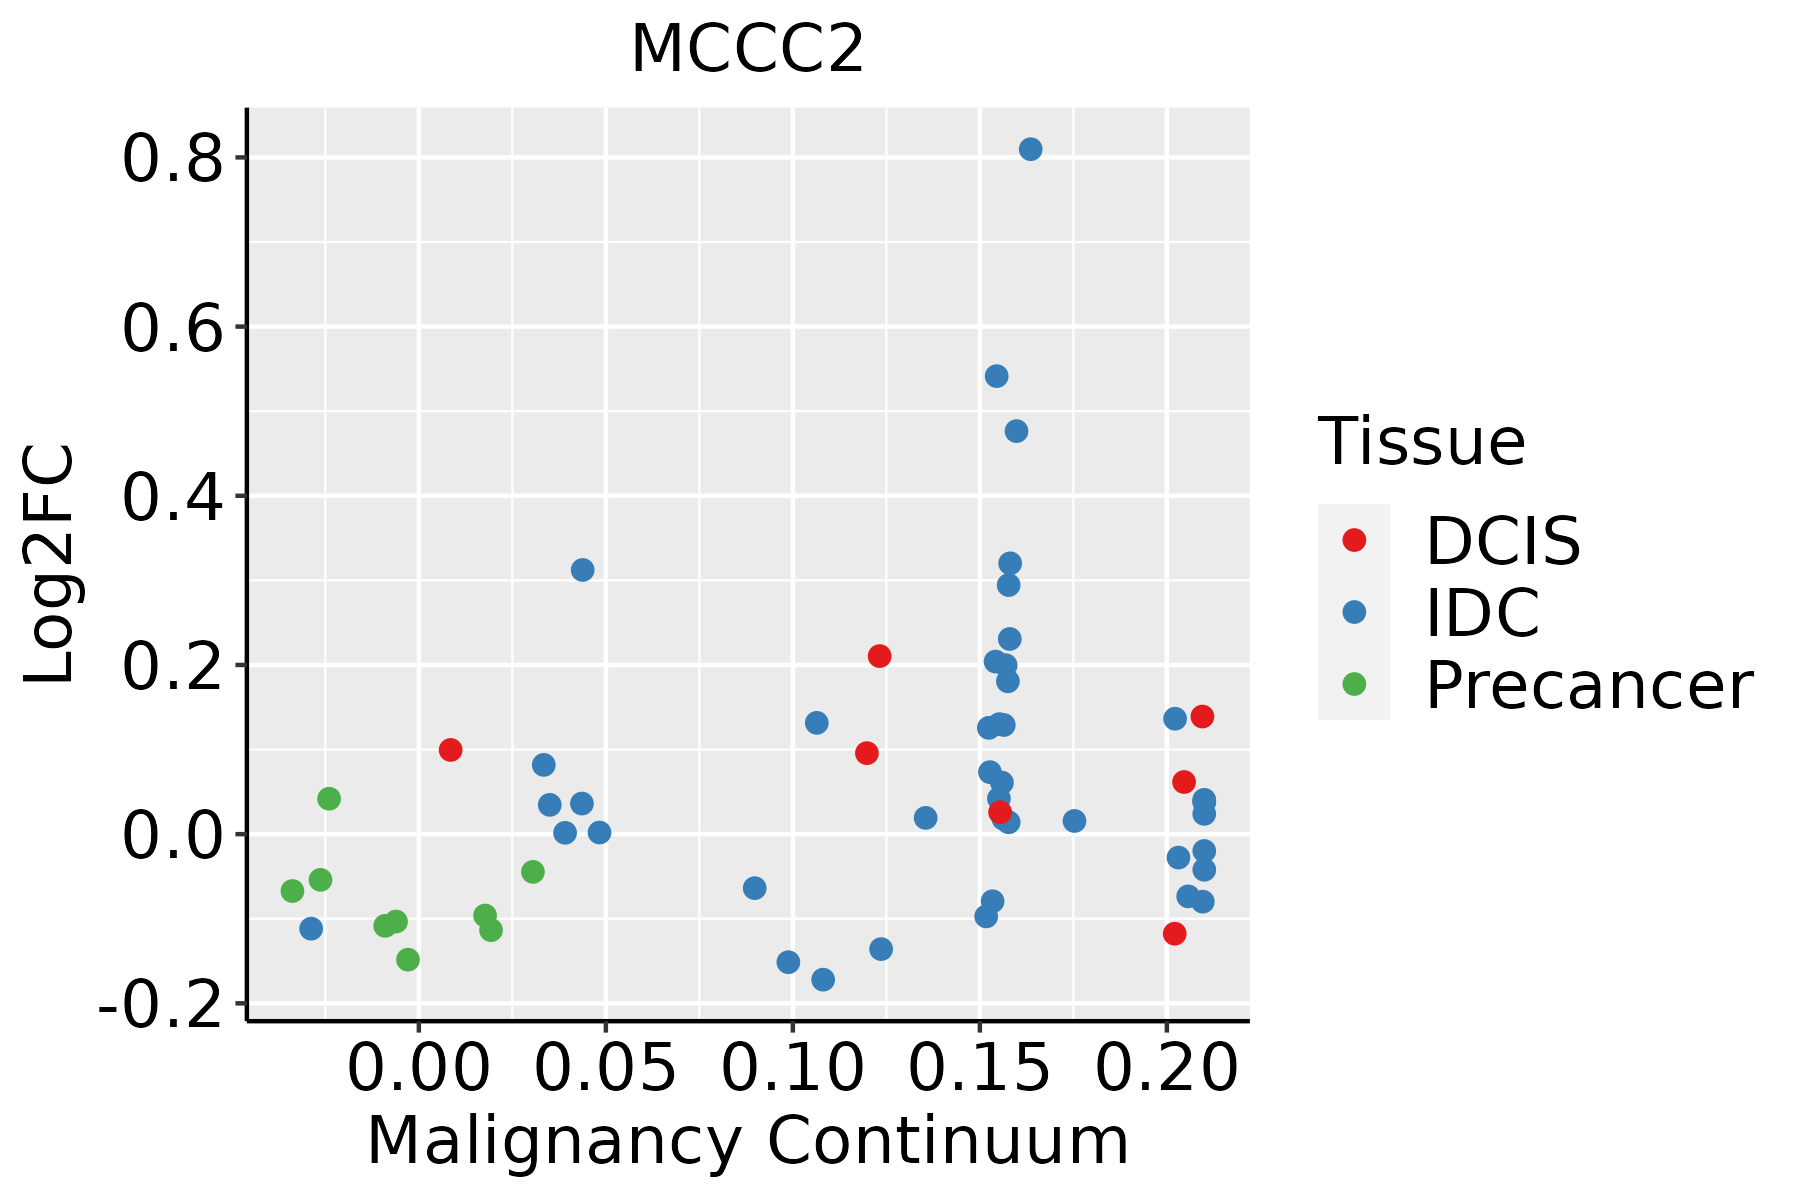 | IDC: Invasive ductal carcinoma |
| DCIS: Ductal carcinoma in situ |
| Precancer(BRCA1-mut): Precancerous lesion from BRCA1 mutation carriers |
| Esophagus | 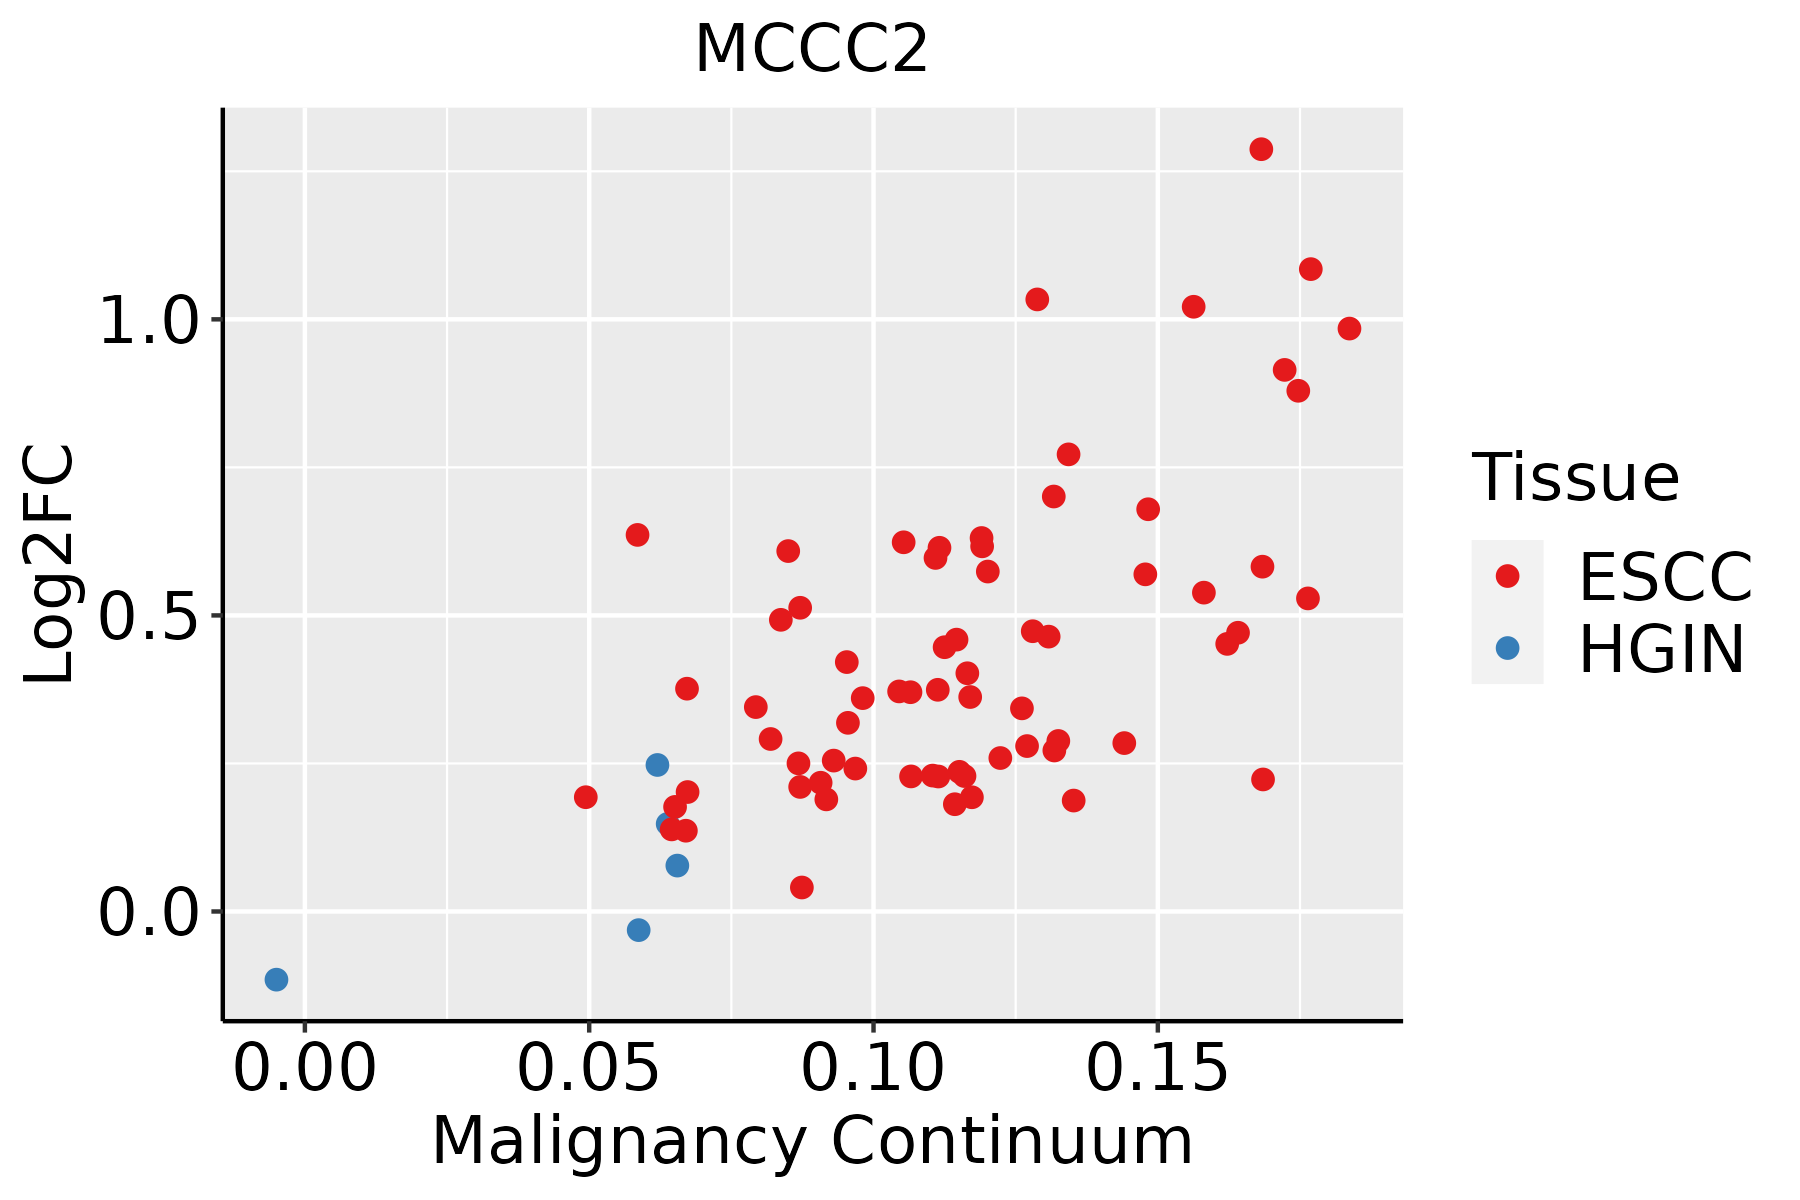 | ESCC: Esophageal squamous cell carcinoma |
| HGIN: High-grade intraepithelial neoplasias |
| LGIN: Low-grade intraepithelial neoplasias |
| Liver | 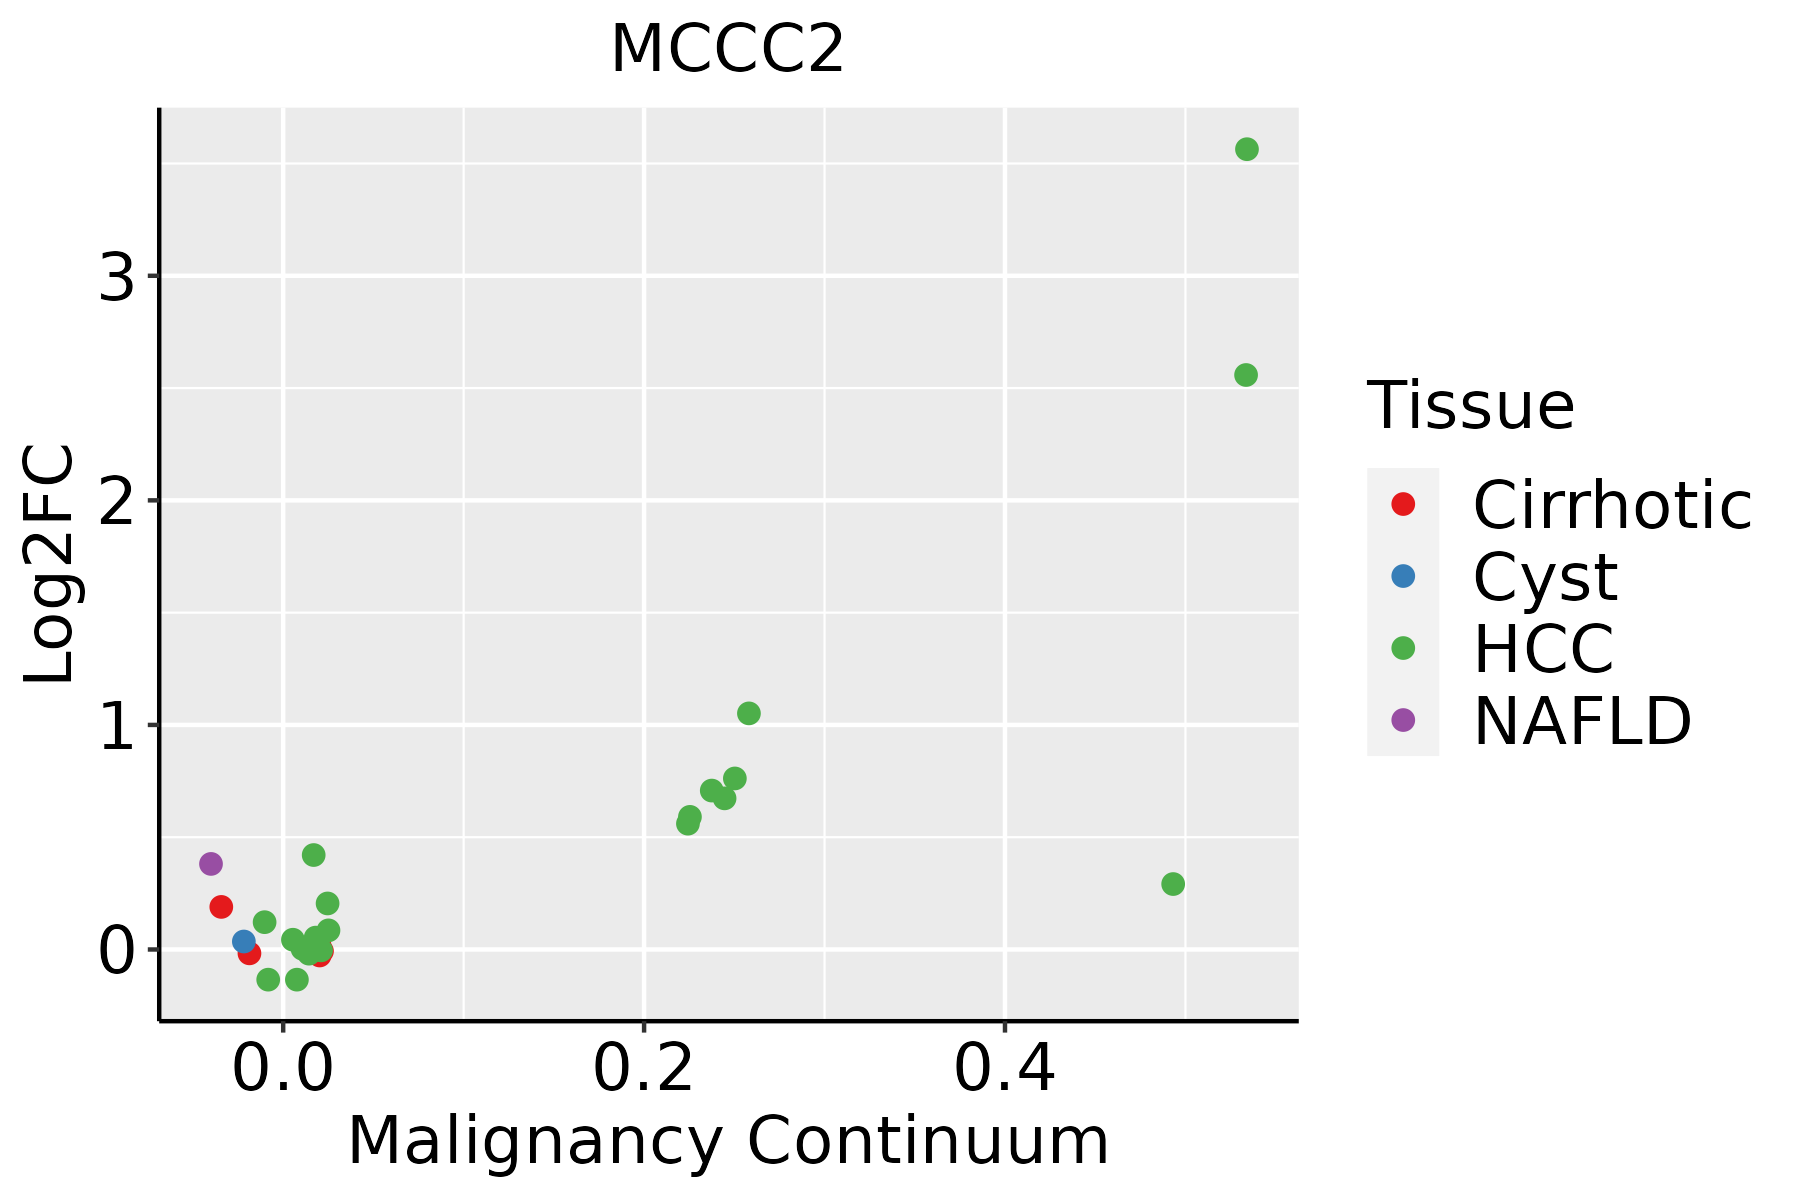 | HCC: Hepatocellular carcinoma |
| NAFLD: Non-alcoholic fatty liver disease |
| Oral Cavity | 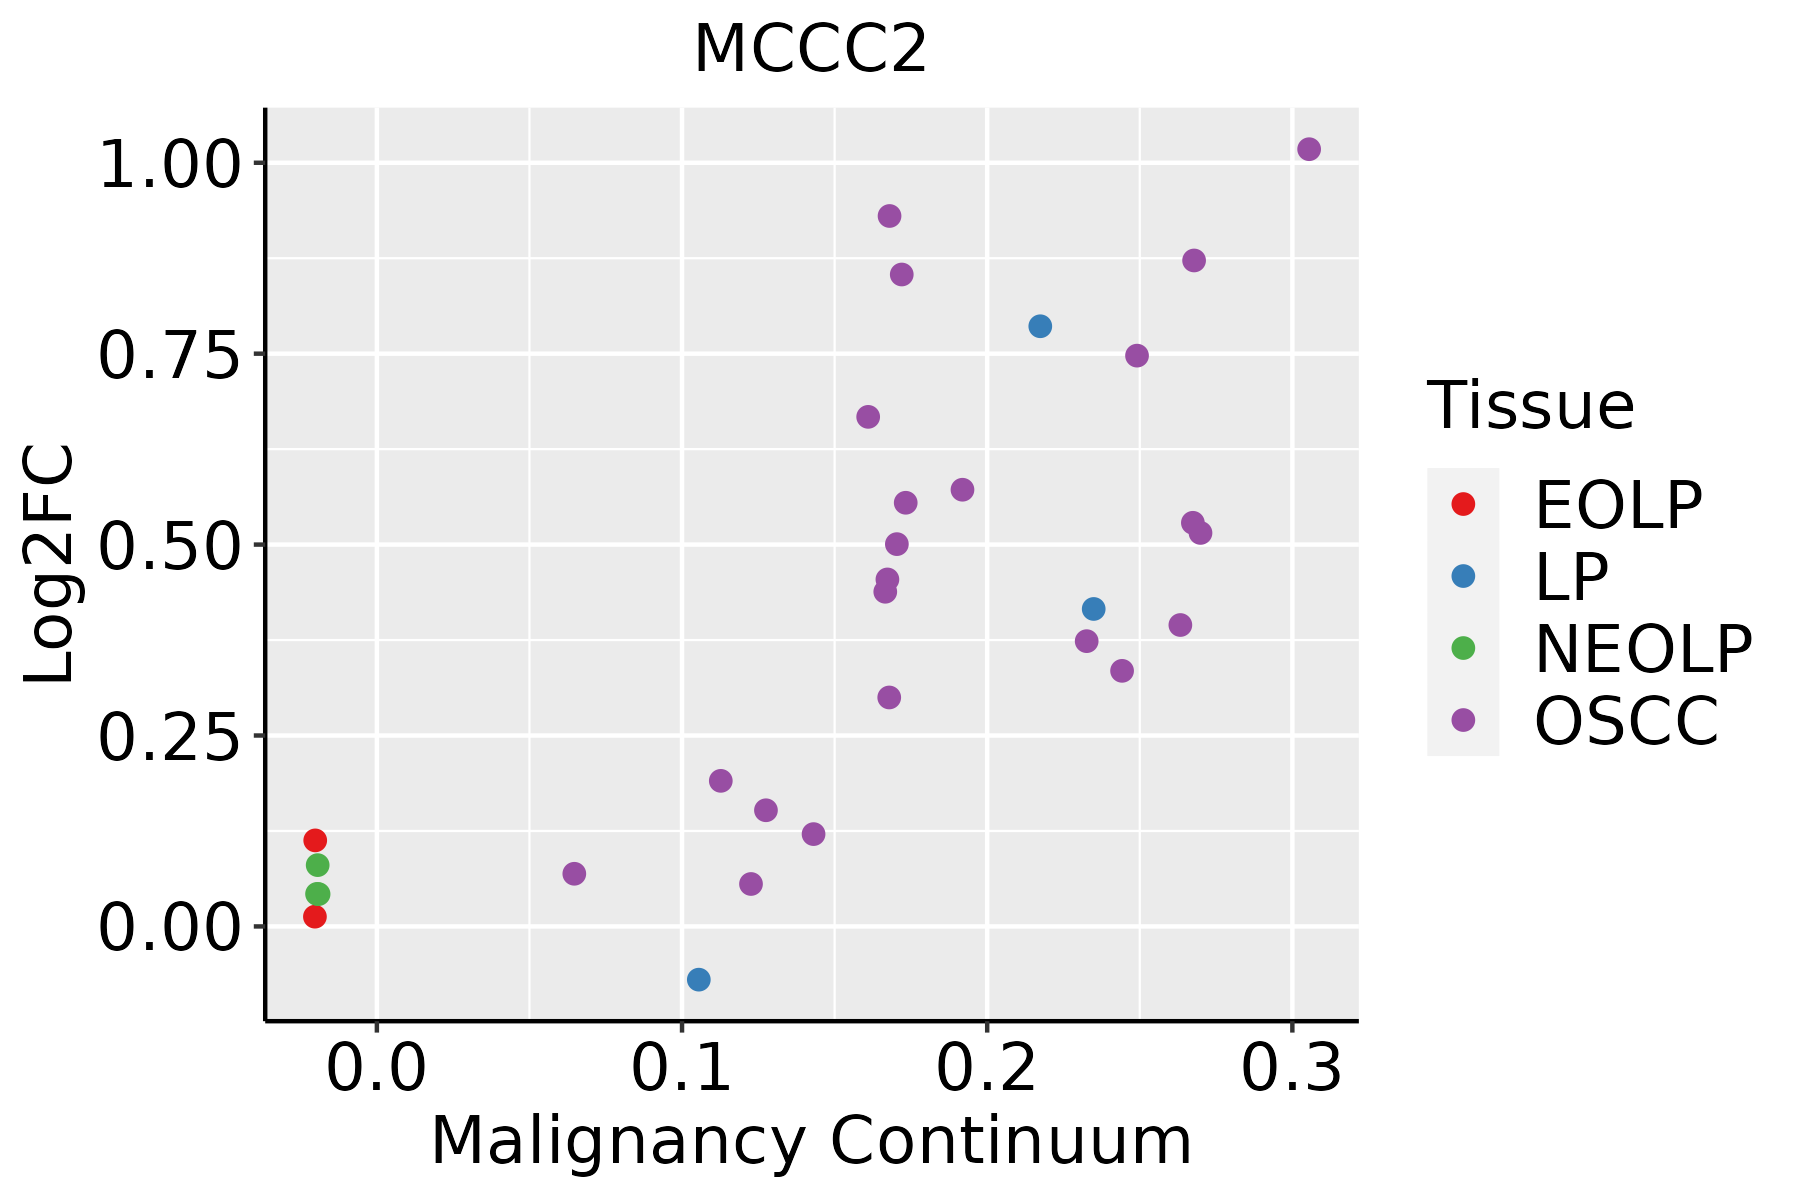 | EOLP: Erosive Oral lichen planus |
| LP: leukoplakia |
| NEOLP: Non-erosive oral lichen planus |
| OSCC: Oral squamous cell carcinoma |
| Prostate |  | BPH: Benign Prostatic Hyperplasia |
| Skin | 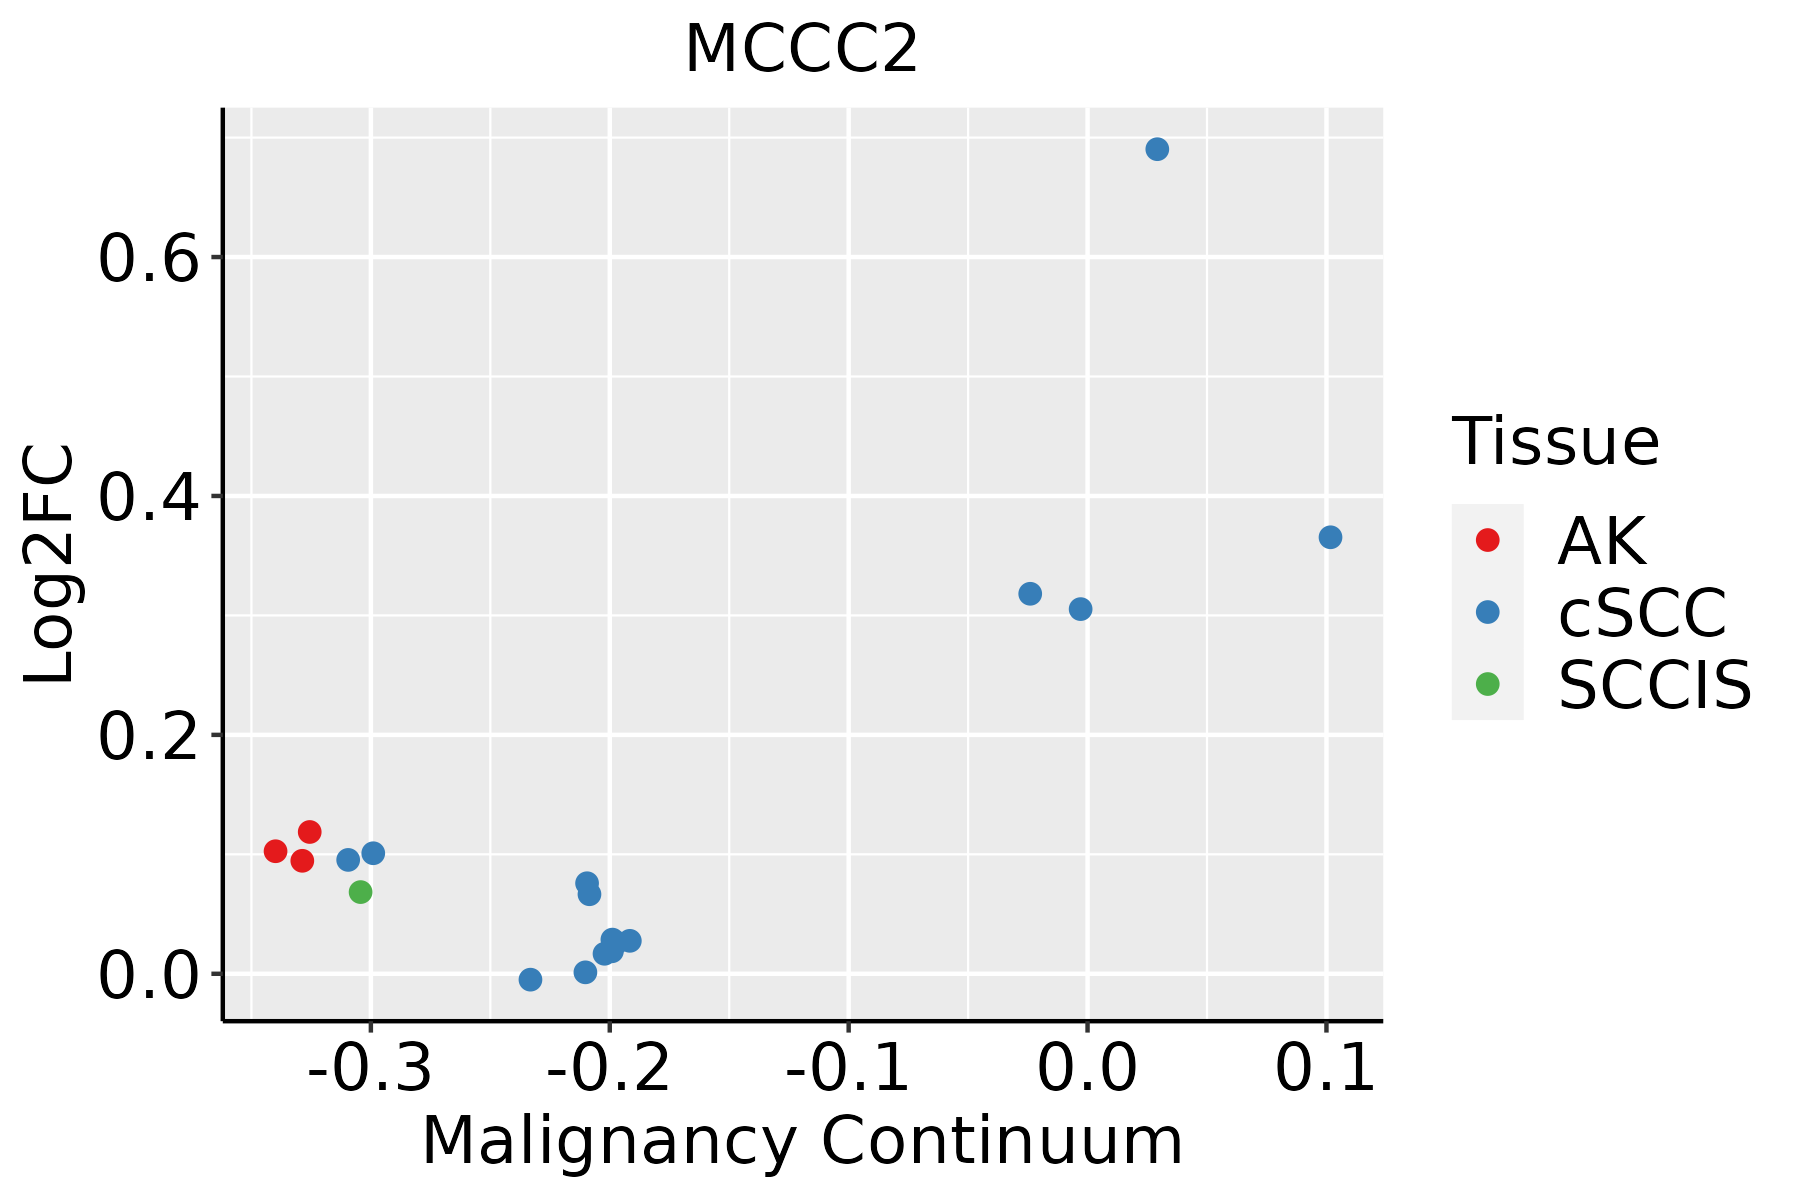 | AK: Actinic keratosis |
| cSCC: Cutaneous squamous cell carcinoma |
| SCCIS:squamous cell carcinoma in situ |
| Thyroid | 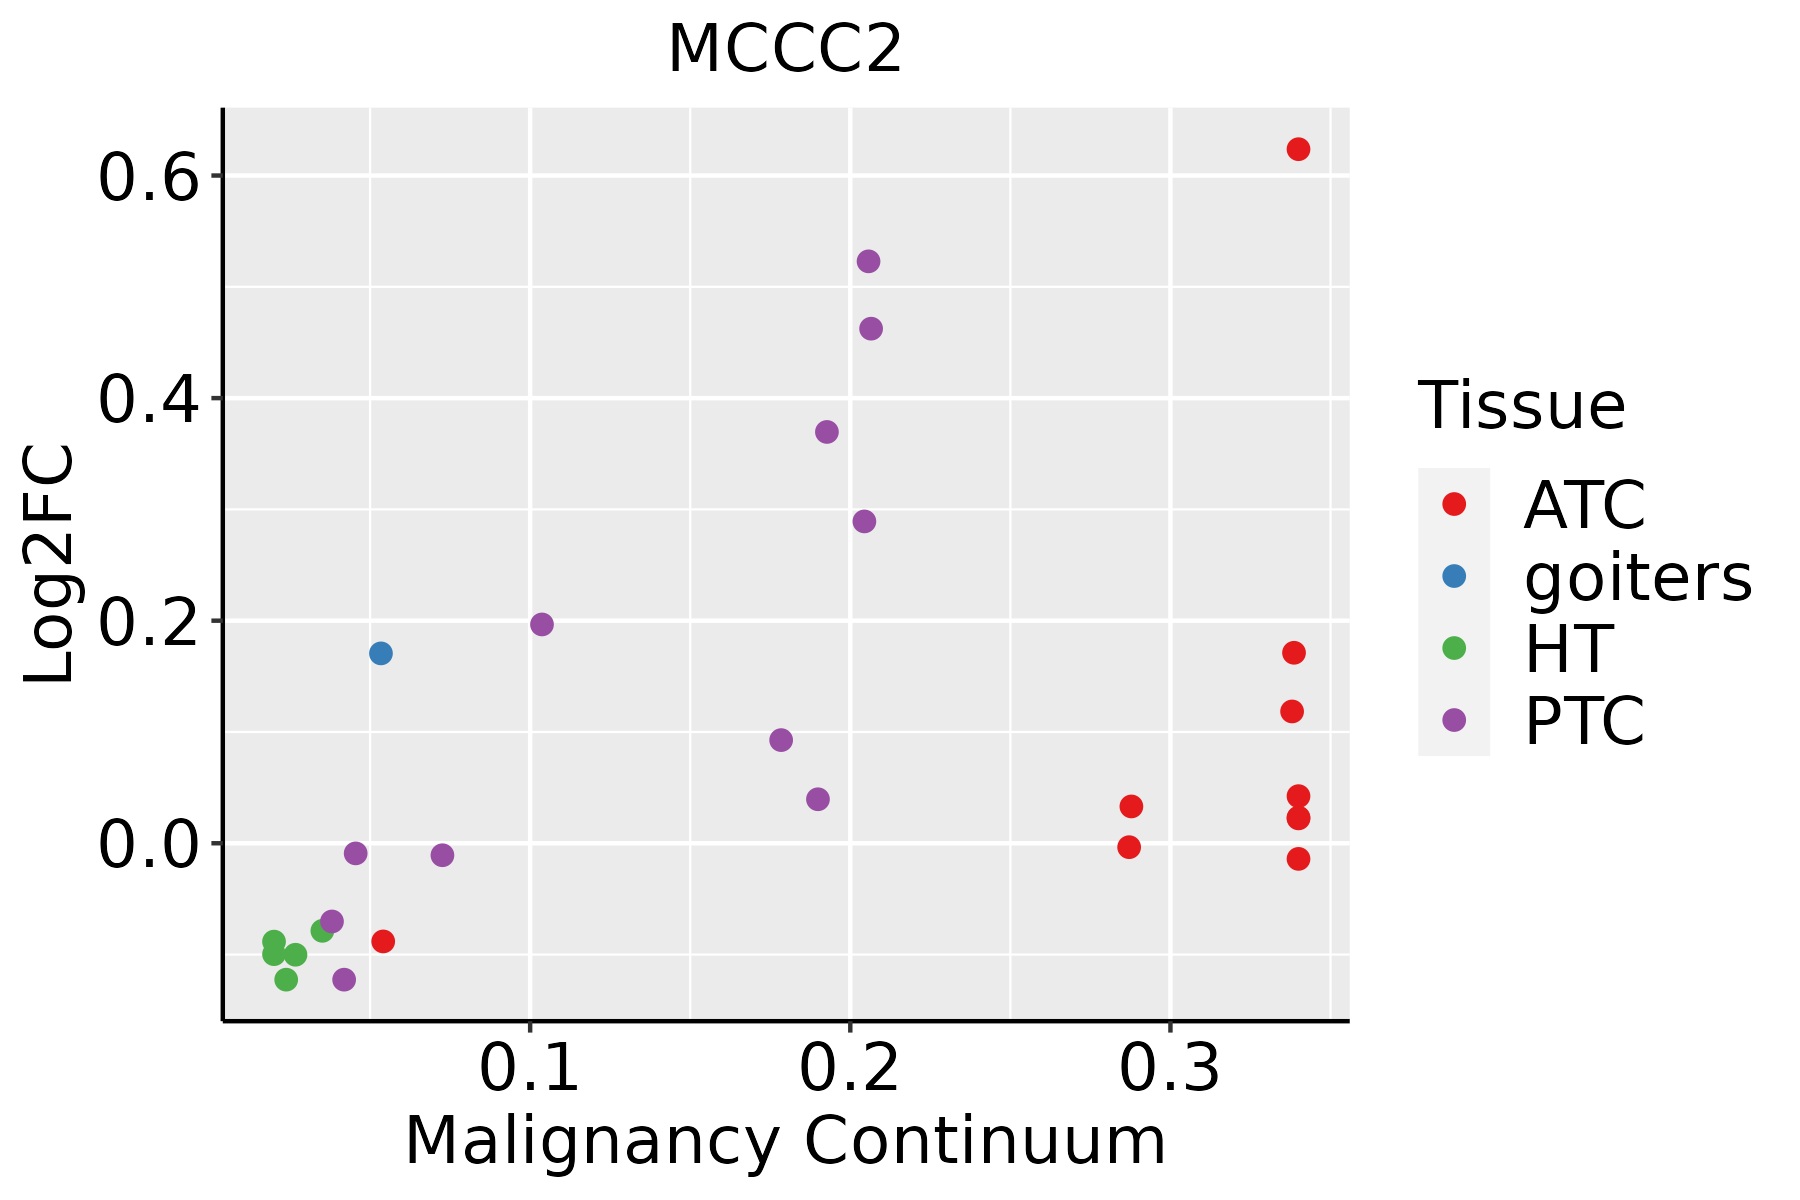 | ATC: Anaplastic thyroid cancer |
| HT: Hashimoto's thyroiditis |
| PTC: Papillary thyroid cancer |
| GO ID | Tissue | Disease Stage | Description | Gene Ratio | Bg Ratio | pvalue | p.adjust | Count |
| GO:000915014 | Breast | IDC | purine ribonucleotide metabolic process | 55/1434 | 368/18723 | 1.30e-06 | 5.72e-05 | 55 |
| GO:001969314 | Breast | IDC | ribose phosphate metabolic process | 58/1434 | 396/18723 | 1.31e-06 | 5.73e-05 | 58 |
| GO:000675313 | Breast | IDC | nucleoside phosphate metabolic process | 68/1434 | 497/18723 | 2.01e-06 | 8.23e-05 | 68 |
| GO:000911713 | Breast | IDC | nucleotide metabolic process | 67/1434 | 489/18723 | 2.28e-06 | 9.05e-05 | 67 |
| GO:000925914 | Breast | IDC | ribonucleotide metabolic process | 56/1434 | 385/18723 | 2.47e-06 | 9.63e-05 | 56 |
| GO:000616314 | Breast | IDC | purine nucleotide metabolic process | 56/1434 | 396/18723 | 5.90e-06 | 1.90e-04 | 56 |
| GO:007252114 | Breast | IDC | purine-containing compound metabolic process | 57/1434 | 416/18723 | 1.28e-05 | 3.31e-04 | 57 |
| GO:001969324 | Breast | DCIS | ribose phosphate metabolic process | 58/1390 | 396/18723 | 4.80e-07 | 2.11e-05 | 58 |
| GO:000915024 | Breast | DCIS | purine ribonucleotide metabolic process | 55/1390 | 368/18723 | 4.92e-07 | 2.14e-05 | 55 |
| GO:000925924 | Breast | DCIS | ribonucleotide metabolic process | 56/1390 | 385/18723 | 9.44e-07 | 3.79e-05 | 56 |
| GO:000616324 | Breast | DCIS | purine nucleotide metabolic process | 56/1390 | 396/18723 | 2.31e-06 | 8.29e-05 | 56 |
| GO:000911723 | Breast | DCIS | nucleotide metabolic process | 65/1390 | 489/18723 | 3.19e-06 | 1.03e-04 | 65 |
| GO:007252124 | Breast | DCIS | purine-containing compound metabolic process | 57/1390 | 416/18723 | 5.07e-06 | 1.48e-04 | 57 |
| GO:000675323 | Breast | DCIS | nucleoside phosphate metabolic process | 65/1390 | 497/18723 | 5.51e-06 | 1.59e-04 | 65 |
| GO:000911720 | Esophagus | HGIN | nucleotide metabolic process | 92/2587 | 489/18723 | 1.11e-03 | 1.36e-02 | 92 |
| GO:000675320 | Esophagus | HGIN | nucleoside phosphate metabolic process | 93/2587 | 497/18723 | 1.25e-03 | 1.49e-02 | 93 |
| GO:000915026 | Esophagus | HGIN | purine ribonucleotide metabolic process | 71/2587 | 368/18723 | 2.00e-03 | 2.11e-02 | 71 |
| GO:000616325 | Esophagus | HGIN | purine nucleotide metabolic process | 75/2587 | 396/18723 | 2.53e-03 | 2.51e-02 | 75 |
| GO:001969320 | Esophagus | HGIN | ribose phosphate metabolic process | 75/2587 | 396/18723 | 2.53e-03 | 2.51e-02 | 75 |
| GO:007252125 | Esophagus | HGIN | purine-containing compound metabolic process | 78/2587 | 416/18723 | 2.78e-03 | 2.73e-02 | 78 |
| Pathway ID | Tissue | Disease Stage | Description | Gene Ratio | Bg Ratio | pvalue | p.adjust | qvalue | Count |
| hsa002809 | Esophagus | ESCC | Valine, leucine and isoleucine degradation | 34/4205 | 48/8465 | 2.34e-03 | 6.54e-03 | 3.35e-03 | 34 |
| hsa0028014 | Esophagus | ESCC | Valine, leucine and isoleucine degradation | 34/4205 | 48/8465 | 2.34e-03 | 6.54e-03 | 3.35e-03 | 34 |
| hsa0028041 | Liver | HCC | Valine, leucine and isoleucine degradation | 41/4020 | 48/8465 | 4.84e-08 | 7.05e-07 | 3.92e-07 | 41 |
| hsa0028051 | Liver | HCC | Valine, leucine and isoleucine degradation | 41/4020 | 48/8465 | 4.84e-08 | 7.05e-07 | 3.92e-07 | 41 |
| hsa002808 | Oral cavity | OSCC | Valine, leucine and isoleucine degradation | 30/3704 | 48/8465 | 6.75e-03 | 1.57e-02 | 7.99e-03 | 30 |
| hsa0028013 | Oral cavity | OSCC | Valine, leucine and isoleucine degradation | 30/3704 | 48/8465 | 6.75e-03 | 1.57e-02 | 7.99e-03 | 30 |
| hsa0028022 | Oral cavity | LP | Valine, leucine and isoleucine degradation | 22/2418 | 48/8465 | 7.98e-03 | 3.02e-02 | 1.95e-02 | 22 |
| hsa0028032 | Oral cavity | LP | Valine, leucine and isoleucine degradation | 22/2418 | 48/8465 | 7.98e-03 | 3.02e-02 | 1.95e-02 | 22 |
| hsa002807 | Prostate | Tumor | Valine, leucine and isoleucine degradation | 20/1791 | 48/8465 | 1.03e-03 | 4.59e-03 | 2.84e-03 | 20 |
| hsa0028012 | Prostate | Tumor | Valine, leucine and isoleucine degradation | 20/1791 | 48/8465 | 1.03e-03 | 4.59e-03 | 2.84e-03 | 20 |
| Hugo Symbol | Variant Class | Variant Classification | dbSNP RS | HGVSc | HGVSp | HGVSp Short | SWISSPROT | BIOTYPE | SIFT | PolyPhen | Tumor Sample Barcode | Tissue | Histology | Sex | Age | Stage | Therapy Types | Drugs | Outcome |
| MCCC2 | SNV | Missense_Mutation | novel | c.760N>A | p.Glu254Lys | p.E254K | Q9HCC0 | protein_coding | tolerated_low_confidence(0.29) | possibly_damaging(0.597) | TCGA-A7-A56D-01 | Breast | breast invasive carcinoma | Female | >=65 | I/II | Hormone Therapy | arimidex | SD |
| MCCC2 | SNV | Missense_Mutation | | c.855N>A | p.His285Gln | p.H285Q | Q9HCC0 | protein_coding | tolerated_low_confidence(0.58) | benign(0.139) | TCGA-AA-3511-01 | Colorectum | colon adenocarcinoma | Male | <65 | I/II | Unknown | Unknown | PD |
| MCCC2 | SNV | Missense_Mutation | novel | c.1060N>G | p.Thr354Ala | p.T354A | Q9HCC0 | protein_coding | deleterious_low_confidence(0) | possibly_damaging(0.908) | TCGA-AA-A010-01 | Colorectum | colon adenocarcinoma | Female | <65 | I/II | Chemotherapy | folinic | CR |
| MCCC2 | SNV | Missense_Mutation | | c.257G>T | p.Arg86Ile | p.R86I | Q9HCC0 | protein_coding | deleterious_low_confidence(0) | probably_damaging(0.999) | TCGA-CA-6718-01 | Colorectum | colon adenocarcinoma | Male | <65 | I/II | Unknown | Unknown | PD |
| MCCC2 | SNV | Missense_Mutation | | c.1460A>C | p.Lys487Thr | p.K487T | Q9HCC0 | protein_coding | deleterious_low_confidence(0.01) | benign(0.371) | TCGA-CA-6718-01 | Colorectum | colon adenocarcinoma | Male | <65 | I/II | Unknown | Unknown | PD |
| MCCC2 | SNV | Missense_Mutation | | c.242N>G | p.Leu81Arg | p.L81R | Q9HCC0 | protein_coding | deleterious_low_confidence(0) | probably_damaging(0.978) | TCGA-D5-6928-01 | Colorectum | colon adenocarcinoma | Male | >=65 | I/II | Unknown | Unknown | SD |
| MCCC2 | SNV | Missense_Mutation | rs752866557 | c.518C>T | p.Ser173Leu | p.S173L | Q9HCC0 | protein_coding | deleterious_low_confidence(0) | probably_damaging(1) | TCGA-F4-6703-01 | Colorectum | colon adenocarcinoma | Male | <65 | I/II | Unknown | Unknown | SD |
| MCCC2 | SNV | Missense_Mutation | rs772144978 | c.166C>T | p.Leu56Phe | p.L56F | Q9HCC0 | protein_coding | deleterious_low_confidence(0.01) | probably_damaging(0.959) | TCGA-G4-6303-01 | Colorectum | colon adenocarcinoma | Female | <65 | III/IV | Chemotherapy | 5-fu | PD |
| MCCC2 | insertion | Frame_Shift_Ins | novel | c.1142_1143insA | p.Thr385TyrfsTer27 | p.T385Yfs*27 | Q9HCC0 | protein_coding | | | TCGA-AA-3947-01 | Colorectum | colon adenocarcinoma | Female | <65 | I/II | Unknown | Unknown | SD |
| MCCC2 | insertion | Frame_Shift_Ins | novel | c.1034_1035insAG | p.Glu346ValfsTer11 | p.E346Vfs*11 | Q9HCC0 | protein_coding | | | TCGA-AM-5820-01 | Colorectum | colon adenocarcinoma | Female | <65 | I/II | Unknown | Unknown | SD |


