
|
|||||
|
 | |
| |
| |
| |
| |
| |
|
Gene: MCC |
Gene summary for MCC |
| Gene information | Species | Human | Gene symbol | MCC | Gene ID | 4163 |
| Gene name | MCC regulator of WNT signaling pathway | |
| Gene Alias | MCC1 | |
| Cytomap | 5q22.2 | |
| Gene Type | protein-coding | GO ID | GO:0001667 | UniProtAcc | P23508 |
Top |
Malignant transformation analysis |
| Identification of the aberrant gene expression in precancerous and cancerous lesions by comparing the gene expression of stem-like cells in diseased tissues with normal stem cells |
| Entrez ID | Symbol | Replicates | Species | Organ | Tissue | Adj P-value | Log2FC | Malignancy |
| 4163 | MCC | CCI_2 | Human | Cervix | CC | 7.98e-16 | 1.53e+00 | 0.5249 |
| 4163 | MCC | CCI_3 | Human | Cervix | CC | 2.31e-24 | 1.41e+00 | 0.516 |
| 4163 | MCC | AEH-subject1 | Human | Endometrium | AEH | 3.67e-04 | 1.79e-01 | -0.3059 |
| 4163 | MCC | AEH-subject2 | Human | Endometrium | AEH | 1.76e-05 | 2.27e-01 | -0.2525 |
| 4163 | MCC | AEH-subject3 | Human | Endometrium | AEH | 4.52e-06 | 2.26e-01 | -0.2576 |
| 4163 | MCC | AEH-subject4 | Human | Endometrium | AEH | 9.63e-10 | 4.11e-01 | -0.2657 |
| 4163 | MCC | AEH-subject5 | Human | Endometrium | AEH | 1.06e-14 | 5.69e-01 | -0.2953 |
| 4163 | MCC | EEC-subject1 | Human | Endometrium | EEC | 1.11e-43 | 9.49e-01 | -0.2682 |
| 4163 | MCC | EEC-subject2 | Human | Endometrium | EEC | 1.49e-28 | 7.77e-01 | -0.2607 |
| 4163 | MCC | EEC-subject3 | Human | Endometrium | EEC | 4.77e-11 | 2.69e-01 | -0.2525 |
| 4163 | MCC | EEC-subject4 | Human | Endometrium | EEC | 1.21e-13 | 5.20e-01 | -0.2571 |
| 4163 | MCC | GSM5276934 | Human | Endometrium | EEC | 1.52e-04 | -9.70e-02 | -0.0913 |
| 4163 | MCC | GSM5276937 | Human | Endometrium | EEC | 5.91e-03 | -1.48e-01 | -0.0897 |
| 4163 | MCC | GSM6177620_NYU_UCEC1_lib1_lib1 | Human | Endometrium | EEC | 1.20e-08 | -1.07e-01 | -0.1869 |
| 4163 | MCC | GSM6177620_NYU_UCEC1_lib2_lib2 | Human | Endometrium | EEC | 2.33e-07 | -1.20e-01 | -0.1875 |
| 4163 | MCC | GSM6177620_NYU_UCEC1_lib3_lib3 | Human | Endometrium | EEC | 8.52e-10 | -9.56e-02 | -0.1883 |
| 4163 | MCC | GSM6177621_NYU_UCEC2_lib1_lib1 | Human | Endometrium | EEC | 5.04e-10 | 9.74e-02 | -0.1934 |
| 4163 | MCC | GSM6177622_NYU_UCEC3_lib1_lib1 | Human | Endometrium | EEC | 3.89e-10 | -1.69e-01 | -0.1917 |
| 4163 | MCC | GSM6177622_NYU_UCEC3_lib2_lib2 | Human | Endometrium | EEC | 5.36e-10 | -1.69e-01 | -0.1916 |
| 4163 | MCC | GSM6177623_NYU_UCEC3_Vis | Human | Endometrium | EEC | 1.14e-03 | -1.02e-01 | -0.1269 |
| Page: 1 2 3 4 5 6 7 |
| Tissue | Expression Dynamics | Abbreviation |
| Cervix | 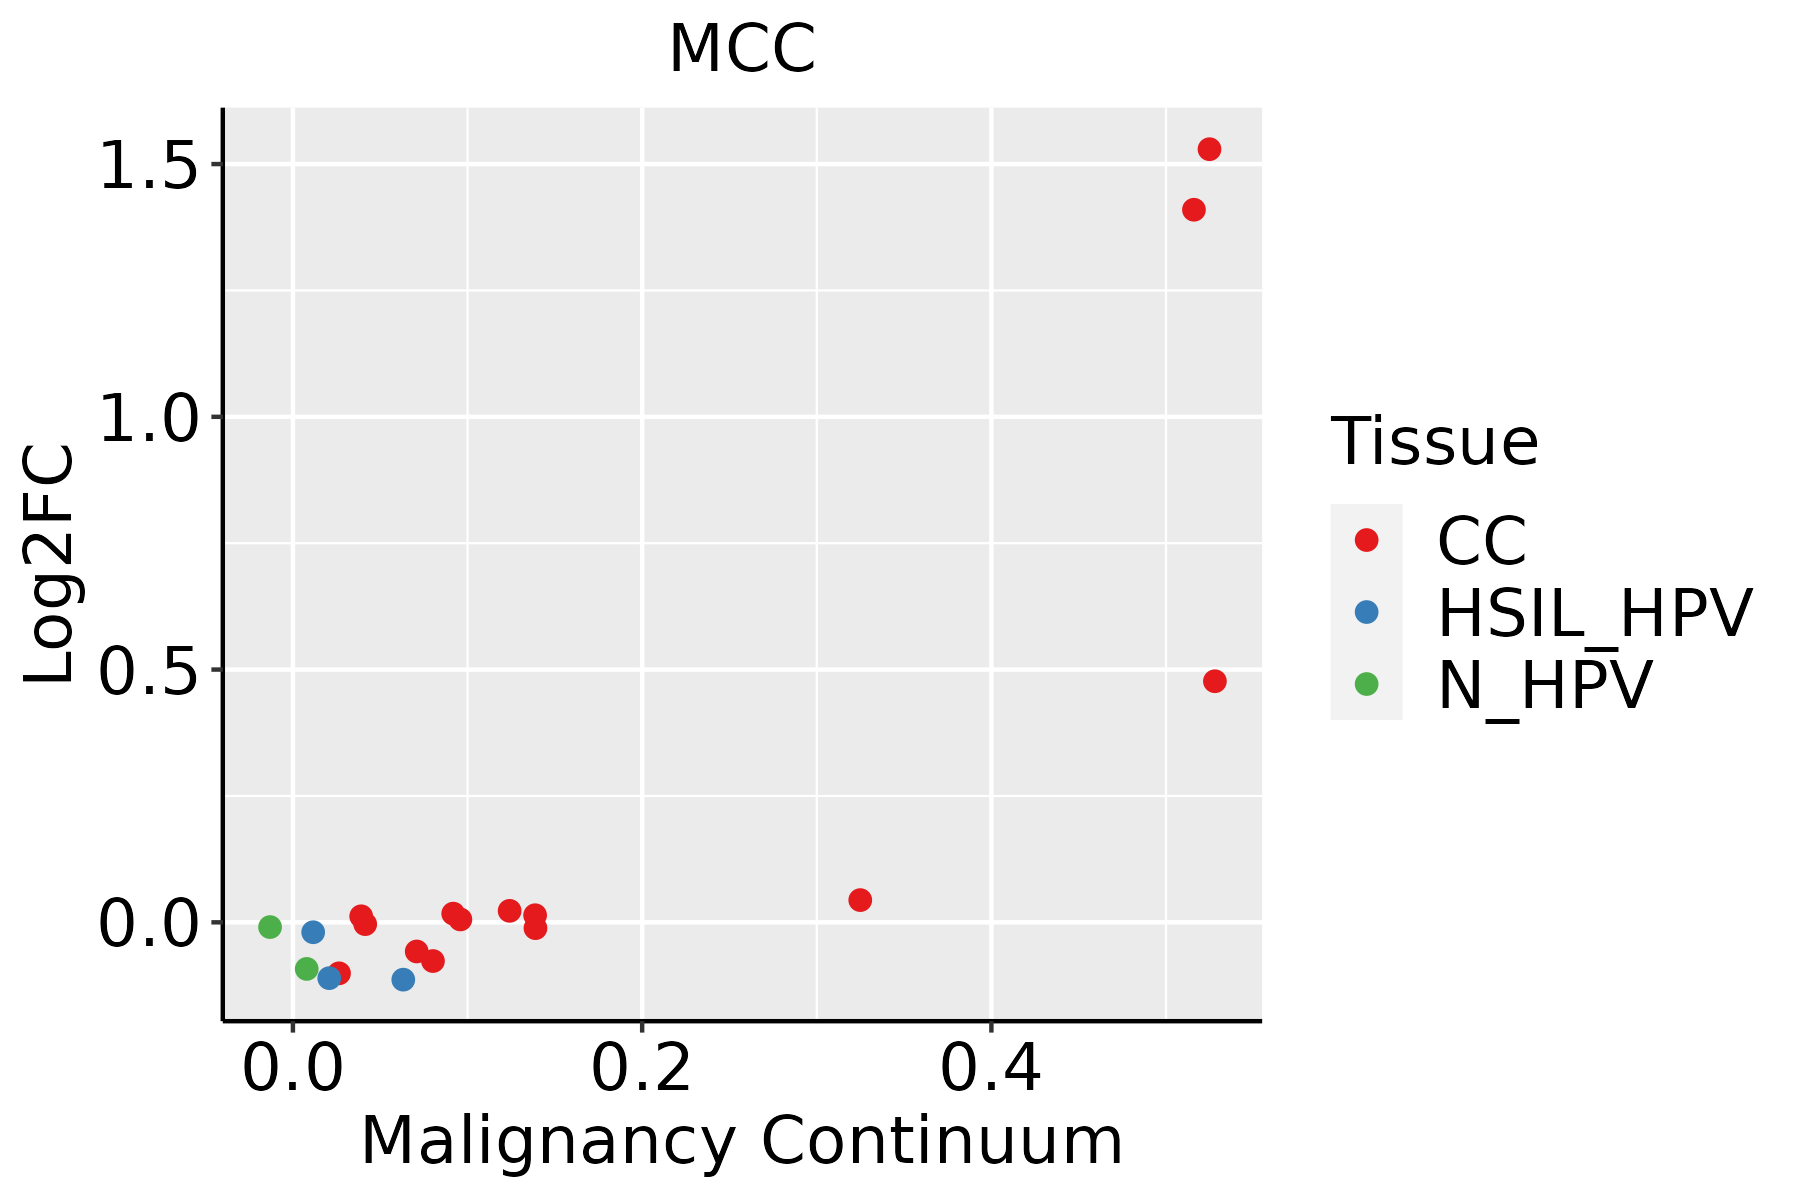 | CC: Cervix cancer |
| HSIL_HPV: HPV-infected high-grade squamous intraepithelial lesions | ||
| N_HPV: HPV-infected normal cervix | ||
| Endometrium | 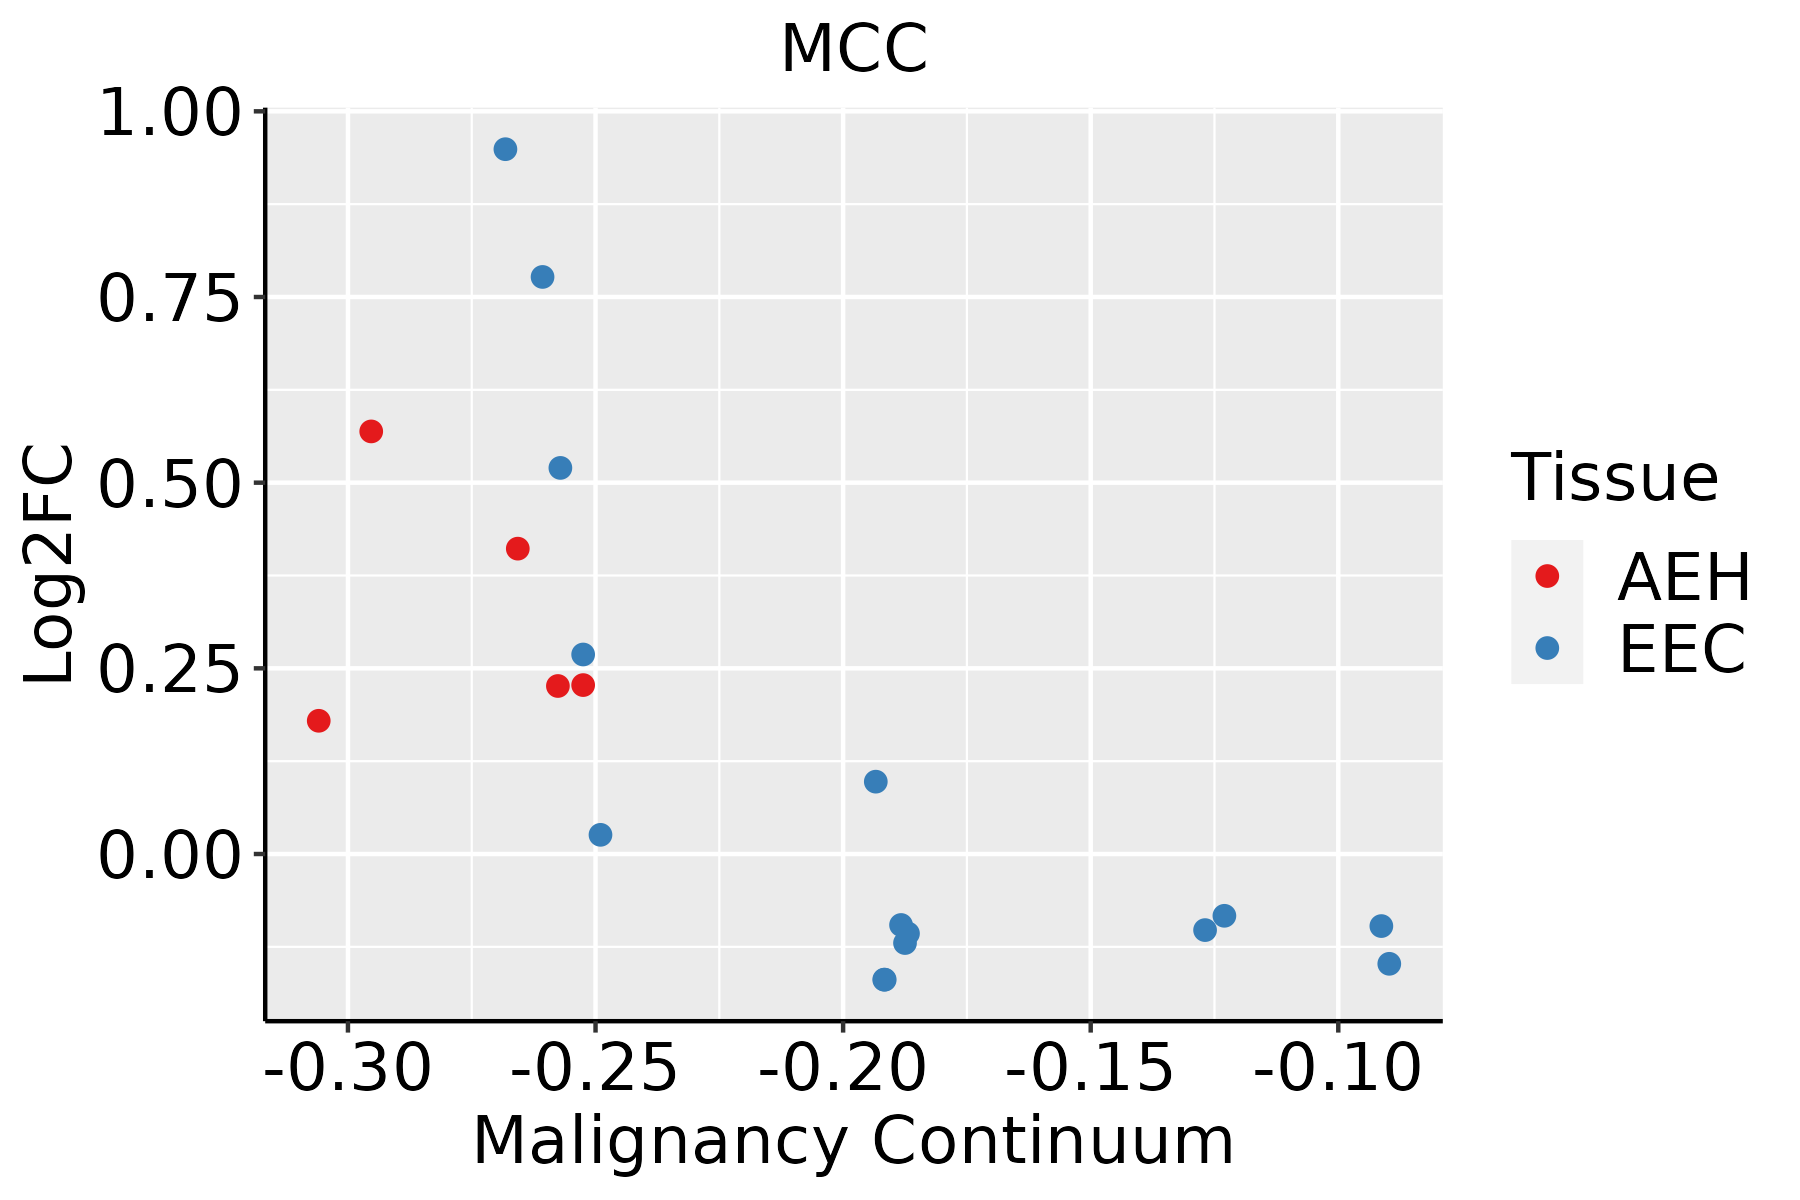 | AEH: Atypical endometrial hyperplasia |
| EEC: Endometrioid Cancer | ||
| Esophagus | 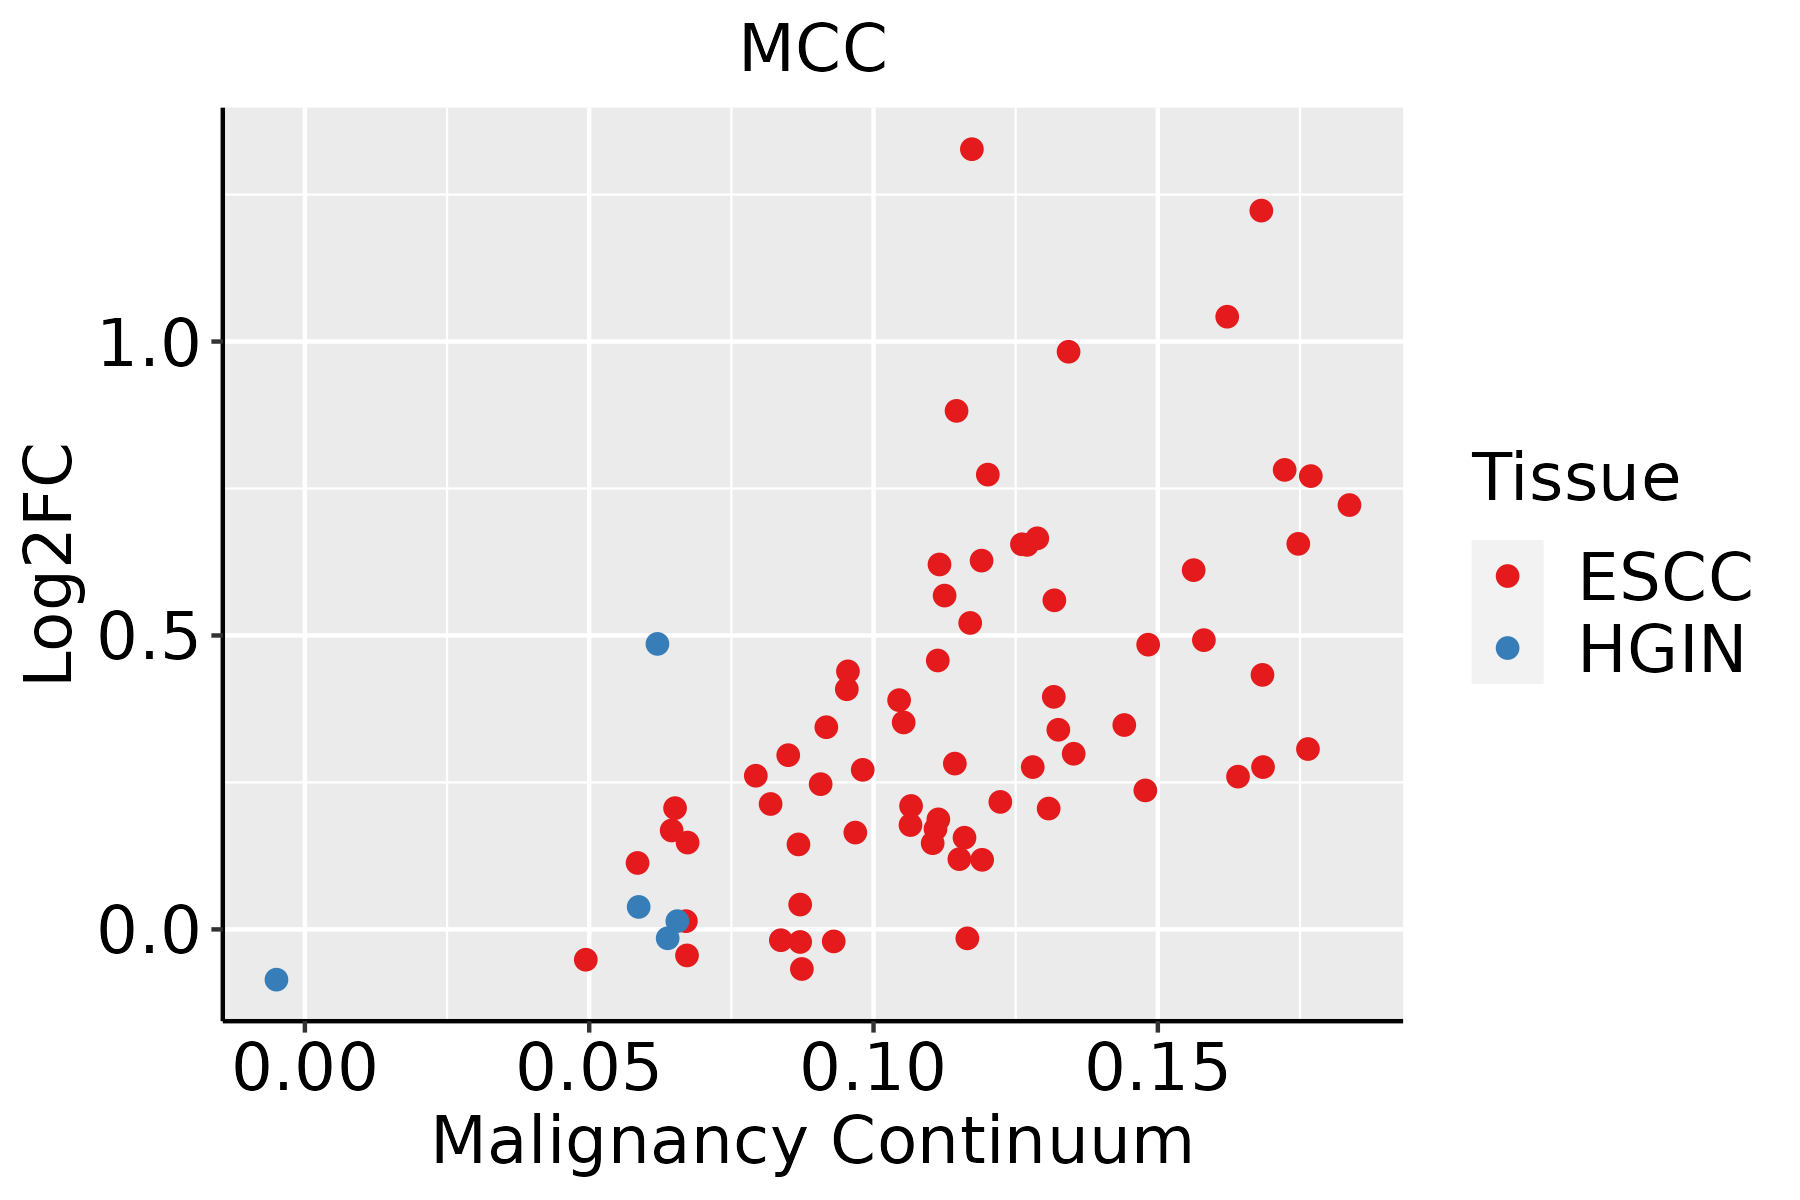 | ESCC: Esophageal squamous cell carcinoma |
| HGIN: High-grade intraepithelial neoplasias | ||
| LGIN: Low-grade intraepithelial neoplasias | ||
| Oral Cavity | 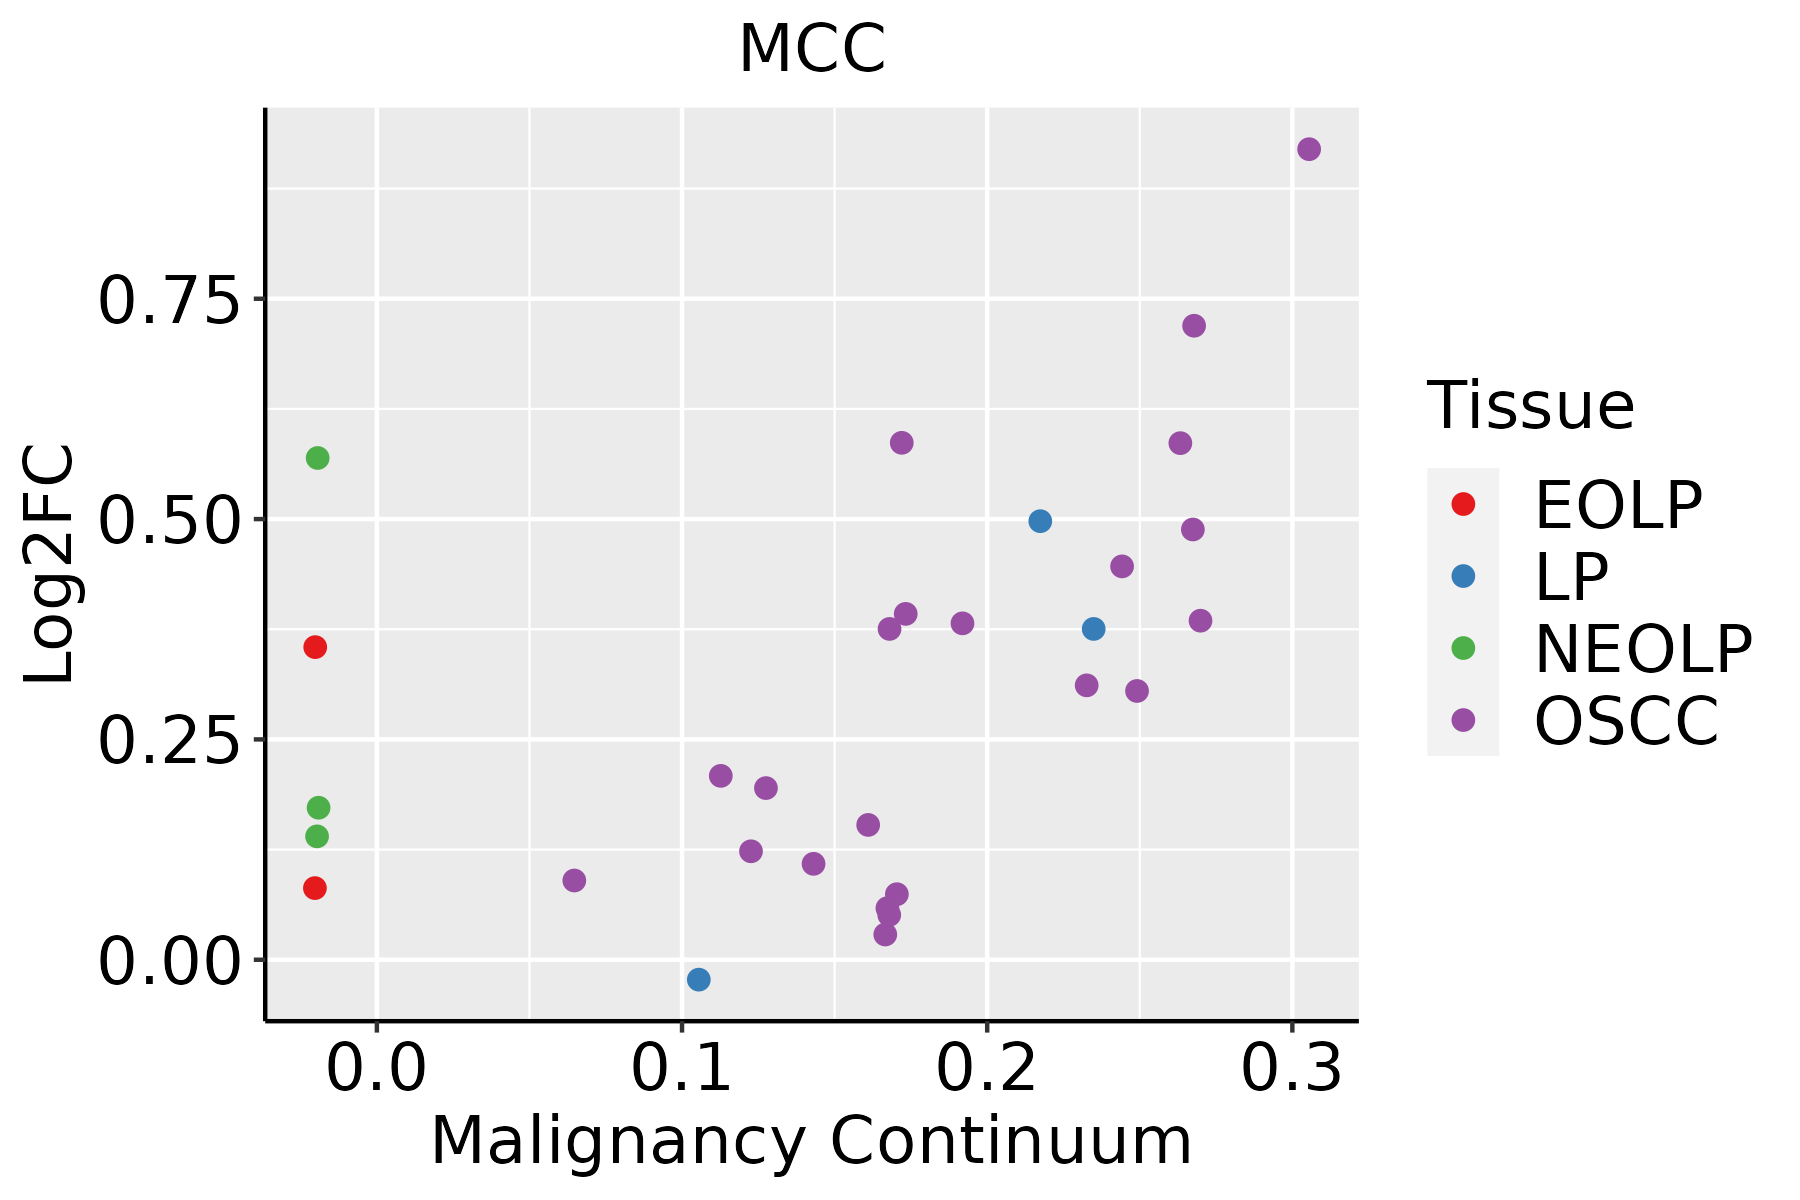 | EOLP: Erosive Oral lichen planus |
| LP: leukoplakia | ||
| NEOLP: Non-erosive oral lichen planus | ||
| OSCC: Oral squamous cell carcinoma | ||
| Prostate |  | BPH: Benign Prostatic Hyperplasia |
| Skin | 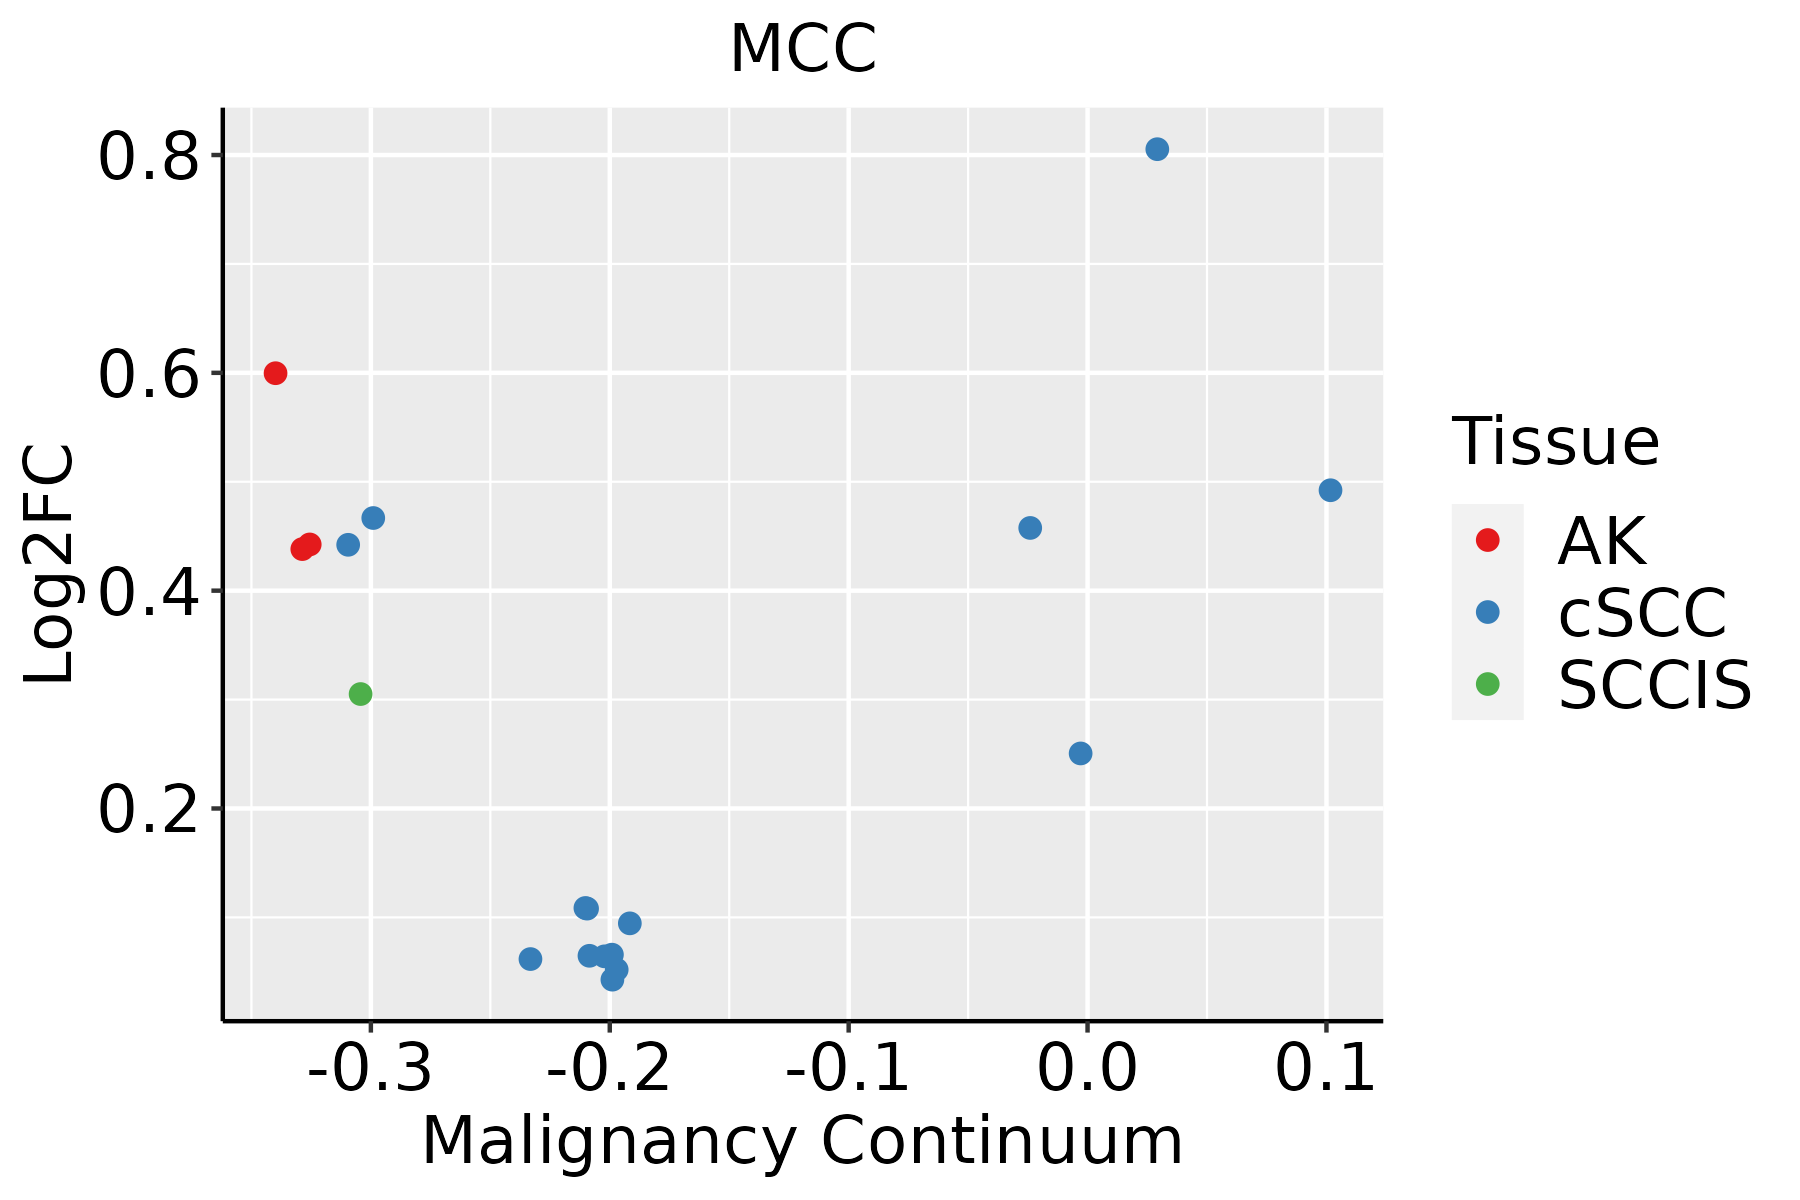 | AK: Actinic keratosis |
| cSCC: Cutaneous squamous cell carcinoma | ||
| SCCIS:squamous cell carcinoma in situ | ||
| Thyroid | 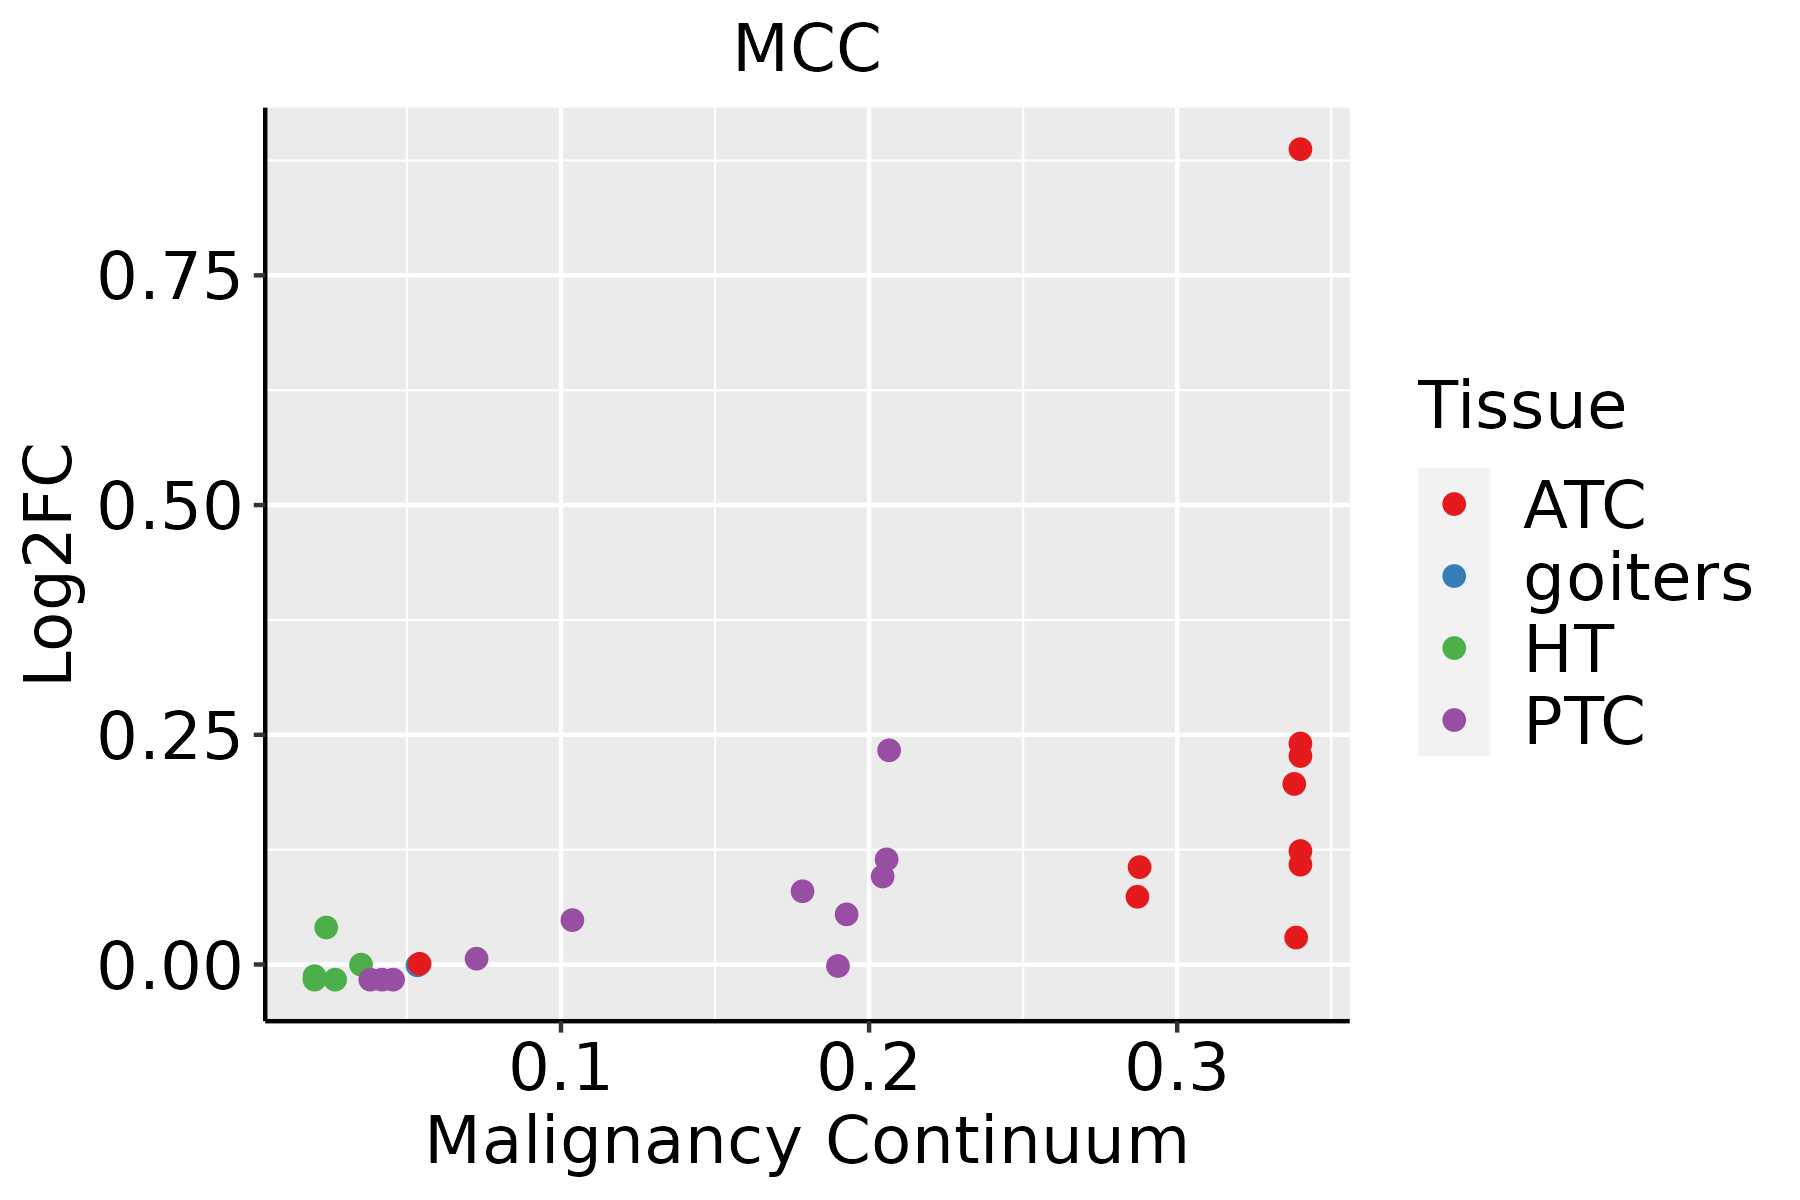 | ATC: Anaplastic thyroid cancer |
| HT: Hashimoto's thyroiditis | ||
| PTC: Papillary thyroid cancer |
| ∗log2FC in expression of this searched gene in stem-like cells from each diseased tissue sample relative to stem-like cells in normal samples in each tissue plotted against the malignancy continuum. Samples are colored based on if they are from different disease stage. |
Top |
Malignant transformation related pathway analysis |
| Find out the enriched GO biological processes and KEGG pathways involved in transition from healthy to precancer to cancer |
| Tissue | Disease Stage | Enriched GO biological Processes |
| Colorectum | AD |  |
| Colorectum | SER |  |
| Colorectum | MSS |  |
| Colorectum | MSI-H |  |
| Colorectum | FAP |  |
| ∗Top 15 enriched GO BP terms are showed in the bar plot of each disease state in each tissue. Each row represents a significant GO biological process which is colored according to the -log10(p.adjust). |
| Page: 1 2 3 4 5 6 7 8 9 |
| GO ID | Tissue | Disease Stage | Description | Gene Ratio | Bg Ratio | pvalue | p.adjust | Count |
| GO:000915014 | Breast | IDC | purine ribonucleotide metabolic process | 55/1434 | 368/18723 | 1.30e-06 | 5.72e-05 | 55 |
| GO:001969314 | Breast | IDC | ribose phosphate metabolic process | 58/1434 | 396/18723 | 1.31e-06 | 5.73e-05 | 58 |
| GO:000675313 | Breast | IDC | nucleoside phosphate metabolic process | 68/1434 | 497/18723 | 2.01e-06 | 8.23e-05 | 68 |
| GO:000911713 | Breast | IDC | nucleotide metabolic process | 67/1434 | 489/18723 | 2.28e-06 | 9.05e-05 | 67 |
| GO:000925914 | Breast | IDC | ribonucleotide metabolic process | 56/1434 | 385/18723 | 2.47e-06 | 9.63e-05 | 56 |
| GO:000616314 | Breast | IDC | purine nucleotide metabolic process | 56/1434 | 396/18723 | 5.90e-06 | 1.90e-04 | 56 |
| GO:007252114 | Breast | IDC | purine-containing compound metabolic process | 57/1434 | 416/18723 | 1.28e-05 | 3.31e-04 | 57 |
| GO:001969324 | Breast | DCIS | ribose phosphate metabolic process | 58/1390 | 396/18723 | 4.80e-07 | 2.11e-05 | 58 |
| GO:000915024 | Breast | DCIS | purine ribonucleotide metabolic process | 55/1390 | 368/18723 | 4.92e-07 | 2.14e-05 | 55 |
| GO:000925924 | Breast | DCIS | ribonucleotide metabolic process | 56/1390 | 385/18723 | 9.44e-07 | 3.79e-05 | 56 |
| GO:000616324 | Breast | DCIS | purine nucleotide metabolic process | 56/1390 | 396/18723 | 2.31e-06 | 8.29e-05 | 56 |
| GO:000911723 | Breast | DCIS | nucleotide metabolic process | 65/1390 | 489/18723 | 3.19e-06 | 1.03e-04 | 65 |
| GO:007252124 | Breast | DCIS | purine-containing compound metabolic process | 57/1390 | 416/18723 | 5.07e-06 | 1.48e-04 | 57 |
| GO:000675323 | Breast | DCIS | nucleoside phosphate metabolic process | 65/1390 | 497/18723 | 5.51e-06 | 1.59e-04 | 65 |
| GO:009013210 | Cervix | CC | epithelium migration | 90/2311 | 360/18723 | 2.45e-11 | 6.11e-09 | 90 |
| GO:00016679 | Cervix | CC | ameboidal-type cell migration | 110/2311 | 475/18723 | 2.66e-11 | 6.36e-09 | 110 |
| GO:001063110 | Cervix | CC | epithelial cell migration | 89/2311 | 357/18723 | 3.72e-11 | 8.54e-09 | 89 |
| GO:009013010 | Cervix | CC | tissue migration | 90/2311 | 365/18723 | 5.42e-11 | 1.05e-08 | 90 |
| GO:00506737 | Cervix | CC | epithelial cell proliferation | 98/2311 | 437/18723 | 2.01e-09 | 2.15e-07 | 98 |
| GO:001063210 | Cervix | CC | regulation of epithelial cell migration | 72/2311 | 292/18723 | 4.52e-09 | 4.43e-07 | 72 |
| Page: 1 2 3 4 5 6 7 8 9 10 11 12 13 14 15 16 17 18 19 20 |
| Pathway ID | Tissue | Disease Stage | Description | Gene Ratio | Bg Ratio | pvalue | p.adjust | qvalue | Count |
| Page: 1 |
Top |
Cell-cell communication analysis |
| Identification of potential cell-cell interactions between two cell types and their ligand-receptor pairs for different disease states |
| Ligand | Receptor | LRpair | Pathway | Tissue | Disease Stage |
| Page: 1 |
Top |
Single-cell gene regulatory network inference analysis |
| Find out the significant the regulons (TFs) and the target genes of each regulon across cell types for different disease states |
| TF | Cell Type | Tissue | Disease Stage | Target Gene | RSS | Regulon Activity |
| ∗The dot plots of a searched regulon are shown for all cell subpopulations in each disease state of each tissue based on the regulon specific score inferred using pySCENIC and by calculating the average expression. |
| Page: 1 |
Top |
Somatic mutation of malignant transformation related genes |
| Annotation of somatic variants for genes involved in malignant transformation |
| Hugo Symbol | Variant Class | Variant Classification | dbSNP RS | HGVSc | HGVSp | HGVSp Short | SWISSPROT | BIOTYPE | SIFT | PolyPhen | Tumor Sample Barcode | Tissue | Histology | Sex | Age | Stage | Therapy Types | Drugs | Outcome |
| MCC | SNV | Missense_Mutation | novel | c.2910N>C | p.Lys970Asn | p.K970N | P23508 | protein_coding | deleterious(0.05) | probably_damaging(0.99) | TCGA-5L-AAT1-01 | Breast | breast invasive carcinoma | Female | <65 | III/IV | Hormone Therapy | letrozol | SD |
| MCC | SNV | Missense_Mutation | c.284N>C | p.Arg95Thr | p.R95T | P23508 | protein_coding | deleterious_low_confidence(0.01) | benign(0.172) | TCGA-AC-A23H-01 | Breast | breast invasive carcinoma | Female | >=65 | I/II | Unknown | Unknown | PD | |
| MCC | SNV | Missense_Mutation | c.1539N>G | p.Ile513Met | p.I513M | P23508 | protein_coding | deleterious(0.01) | probably_damaging(0.987) | TCGA-C8-A132-01 | Breast | breast invasive carcinoma | Female | <65 | I/II | Unknown | Unknown | SD | |
| MCC | SNV | Missense_Mutation | c.3046N>A | p.Glu1016Lys | p.E1016K | P23508 | protein_coding | deleterious(0.01) | probably_damaging(0.979) | TCGA-D8-A145-01 | Breast | breast invasive carcinoma | Female | >=65 | I/II | Hormone Therapy | tamoxiphen | SD | |
| MCC | SNV | Missense_Mutation | novel | c.1436N>A | p.Ala479Asp | p.A479D | P23508 | protein_coding | tolerated(0.33) | probably_damaging(0.994) | TCGA-D8-A27M-01 | Breast | breast invasive carcinoma | Female | <65 | I/II | Chemotherapy | methotrexate+5 | SD |
| MCC | insertion | Frame_Shift_Ins | novel | c.2771_2772insTGGAGTGCCCCAACTCAACCCTTGGGGTGACTGG | p.Lys924AsnfsTer30 | p.K924Nfs*30 | P23508 | protein_coding | TCGA-A8-A0A1-01 | Breast | breast invasive carcinoma | Female | >=65 | I/II | Hormone Therapy | tamoxiphen | SD | ||
| MCC | insertion | Nonsense_Mutation | novel | c.1679_1680insTTAAA | p.Cys561Ter | p.C561* | P23508 | protein_coding | TCGA-BH-A0AY-01 | Breast | breast invasive carcinoma | Female | <65 | I/II | Chemotherapy | SD | |||
| MCC | insertion | Nonsense_Mutation | novel | c.1677_1678insATAATCGTGTGGTTTTTGTCTTTGGTTCTATTTATATGATG | p.Asp560IlefsTer13 | p.D560Ifs*13 | P23508 | protein_coding | TCGA-BH-A0AY-01 | Breast | breast invasive carcinoma | Female | <65 | I/II | Chemotherapy | SD | |||
| MCC | SNV | Missense_Mutation | c.2899G>C | p.Glu967Gln | p.E967Q | P23508 | protein_coding | deleterious(0.01) | probably_damaging(0.986) | TCGA-IR-A3LA-01 | Cervix | cervical & endocervical cancer | Female | <65 | I/II | Chemotherapy | cisplatin | CR | |
| MCC | SNV | Missense_Mutation | rs369310896 | c.1723N>A | p.Gly575Arg | p.G575R | P23508 | protein_coding | tolerated(0.24) | probably_damaging(0.998) | TCGA-Q1-A73P-01 | Cervix | cervical & endocervical cancer | Female | <65 | I/II | Unknown | Unknown | SD |
| Page: 1 2 3 4 5 6 7 8 9 10 11 12 13 |
Top |
Related drugs of malignant transformation related genes |
| Identification of chemicals and drugs interact with genes involved in malignant transfromation |
| (DGIdb 4.0) |
| Entrez ID | Symbol | Category | Interaction Types | Drug Claim Name | Drug Name | PMIDs |
| Page: 1 |

Copyright 2023-Present -The University of Texas Health Science Center at Houston |