
|
|||||
|
 | |
| |
| |
| |
| |
| |
|
Gene: MCAM |
Gene summary for MCAM |
| Gene information | Species | Human | Gene symbol | MCAM | Gene ID | 4162 |
| Gene name | melanoma cell adhesion molecule | |
| Gene Alias | CD146 | |
| Cytomap | 11q23.3 | |
| Gene Type | protein-coding | GO ID | GO:0001525 | UniProtAcc | A0A024R3I5 |
Top |
Malignant transformation analysis |
| Identification of the aberrant gene expression in precancerous and cancerous lesions by comparing the gene expression of stem-like cells in diseased tissues with normal stem cells |
| Entrez ID | Symbol | Replicates | Species | Organ | Tissue | Adj P-value | Log2FC | Malignancy |
| 4162 | MCAM | LZE6T | Human | Esophagus | ESCC | 6.64e-04 | 1.17e-01 | 0.0845 |
| 4162 | MCAM | P2T-E | Human | Esophagus | ESCC | 1.30e-11 | 1.82e-01 | 0.1177 |
| 4162 | MCAM | P4T-E | Human | Esophagus | ESCC | 1.98e-03 | 2.57e-01 | 0.1323 |
| 4162 | MCAM | P5T-E | Human | Esophagus | ESCC | 3.05e-12 | 3.38e-01 | 0.1327 |
| 4162 | MCAM | P8T-E | Human | Esophagus | ESCC | 2.74e-03 | 4.63e-02 | 0.0889 |
| 4162 | MCAM | P10T-E | Human | Esophagus | ESCC | 9.70e-04 | 1.44e-01 | 0.116 |
| 4162 | MCAM | P11T-E | Human | Esophagus | ESCC | 2.30e-13 | 7.75e-01 | 0.1426 |
| 4162 | MCAM | P12T-E | Human | Esophagus | ESCC | 1.15e-11 | 2.87e-01 | 0.1122 |
| 4162 | MCAM | P15T-E | Human | Esophagus | ESCC | 4.23e-03 | 3.94e-03 | 0.1149 |
| 4162 | MCAM | P16T-E | Human | Esophagus | ESCC | 6.16e-11 | 1.34e-01 | 0.1153 |
| 4162 | MCAM | P19T-E | Human | Esophagus | ESCC | 1.93e-05 | 8.69e-01 | 0.1662 |
| 4162 | MCAM | P21T-E | Human | Esophagus | ESCC | 2.85e-03 | 2.35e-01 | 0.1617 |
| 4162 | MCAM | P24T-E | Human | Esophagus | ESCC | 2.14e-08 | 5.50e-01 | 0.1287 |
| 4162 | MCAM | P30T-E | Human | Esophagus | ESCC | 3.25e-03 | 1.04e-01 | 0.137 |
| 4162 | MCAM | P31T-E | Human | Esophagus | ESCC | 5.26e-03 | 1.17e-01 | 0.1251 |
| 4162 | MCAM | P32T-E | Human | Esophagus | ESCC | 2.22e-02 | 3.93e-01 | 0.1666 |
| 4162 | MCAM | P36T-E | Human | Esophagus | ESCC | 6.03e-04 | 1.17e-01 | 0.1187 |
| 4162 | MCAM | P37T-E | Human | Esophagus | ESCC | 9.60e-13 | 3.62e-01 | 0.1371 |
| 4162 | MCAM | P42T-E | Human | Esophagus | ESCC | 2.35e-03 | 3.51e-01 | 0.1175 |
| 4162 | MCAM | P47T-E | Human | Esophagus | ESCC | 2.92e-02 | 1.11e-01 | 0.1067 |
| Page: 1 2 3 4 |
| Tissue | Expression Dynamics | Abbreviation |
| Esophagus | 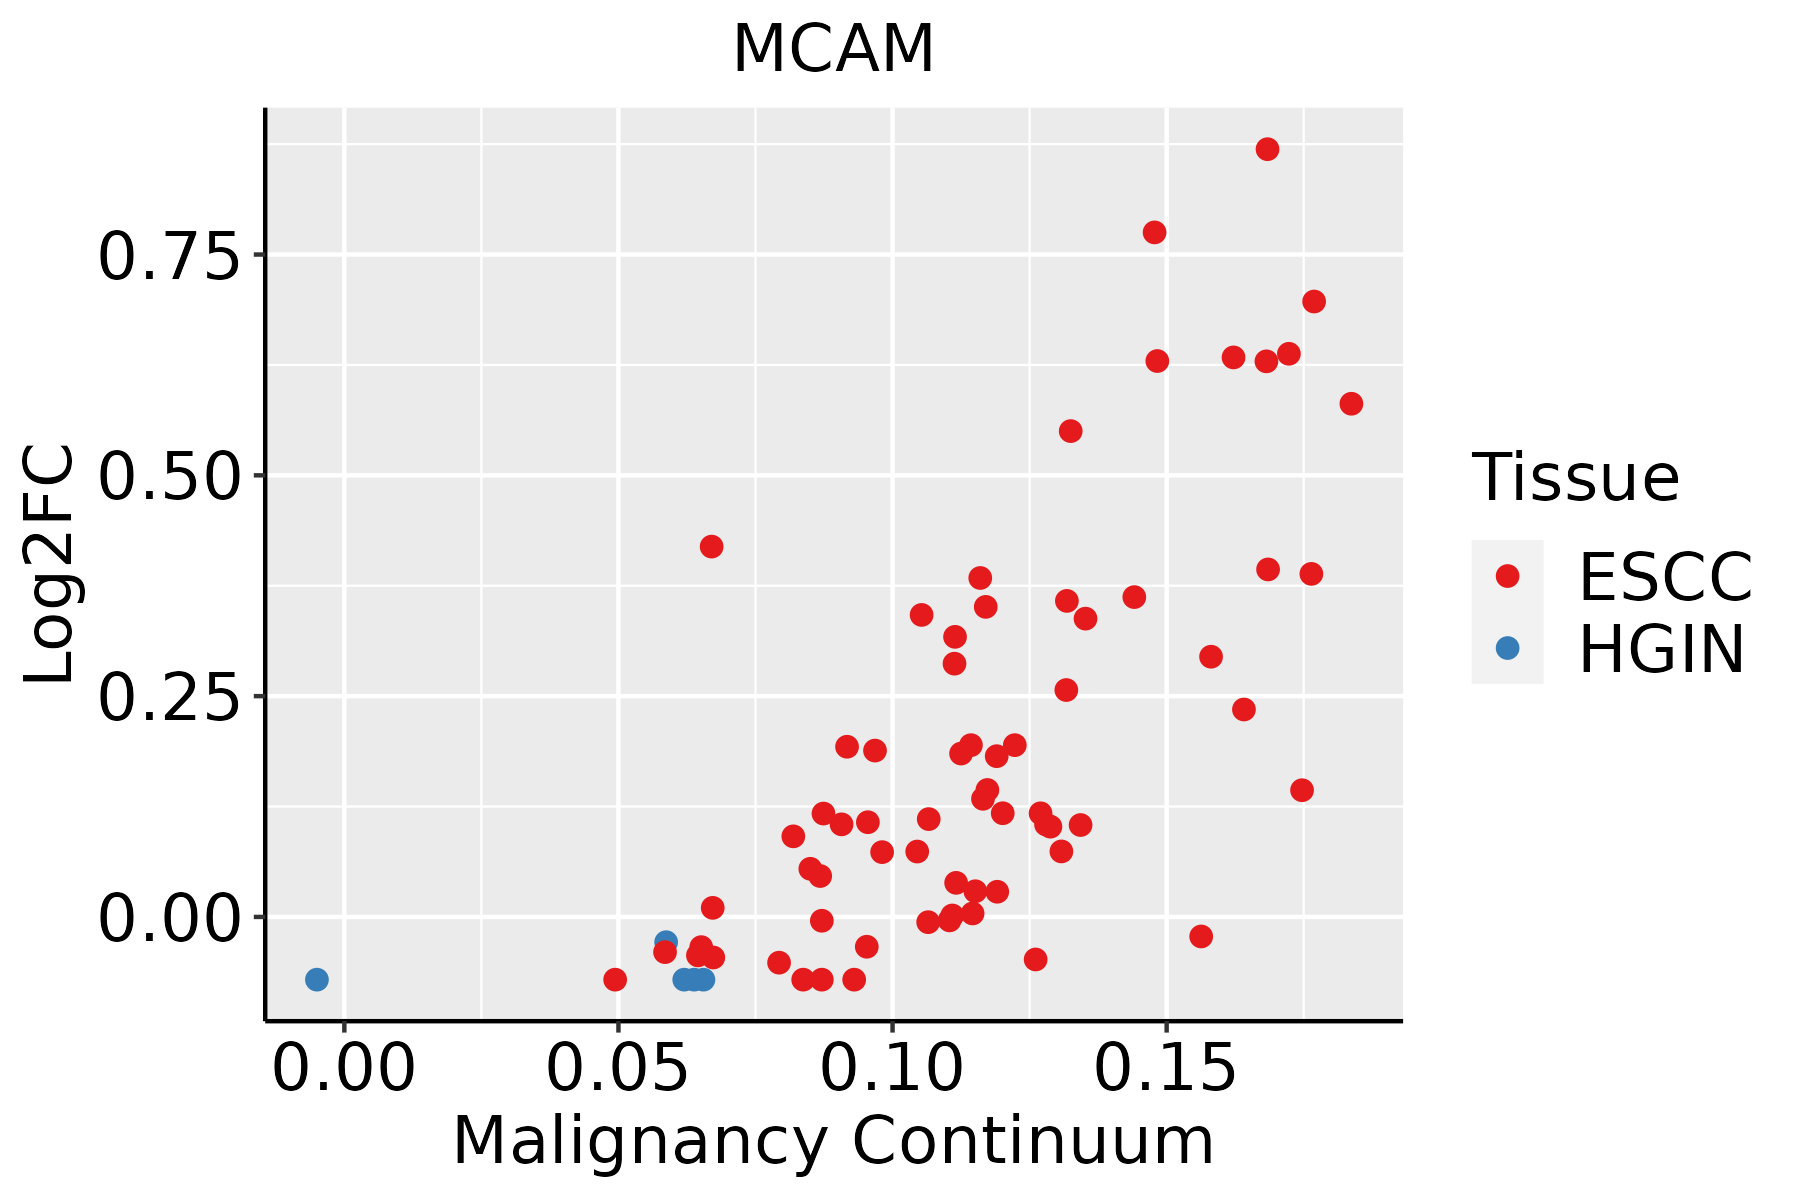 | ESCC: Esophageal squamous cell carcinoma |
| HGIN: High-grade intraepithelial neoplasias | ||
| LGIN: Low-grade intraepithelial neoplasias | ||
| Liver | 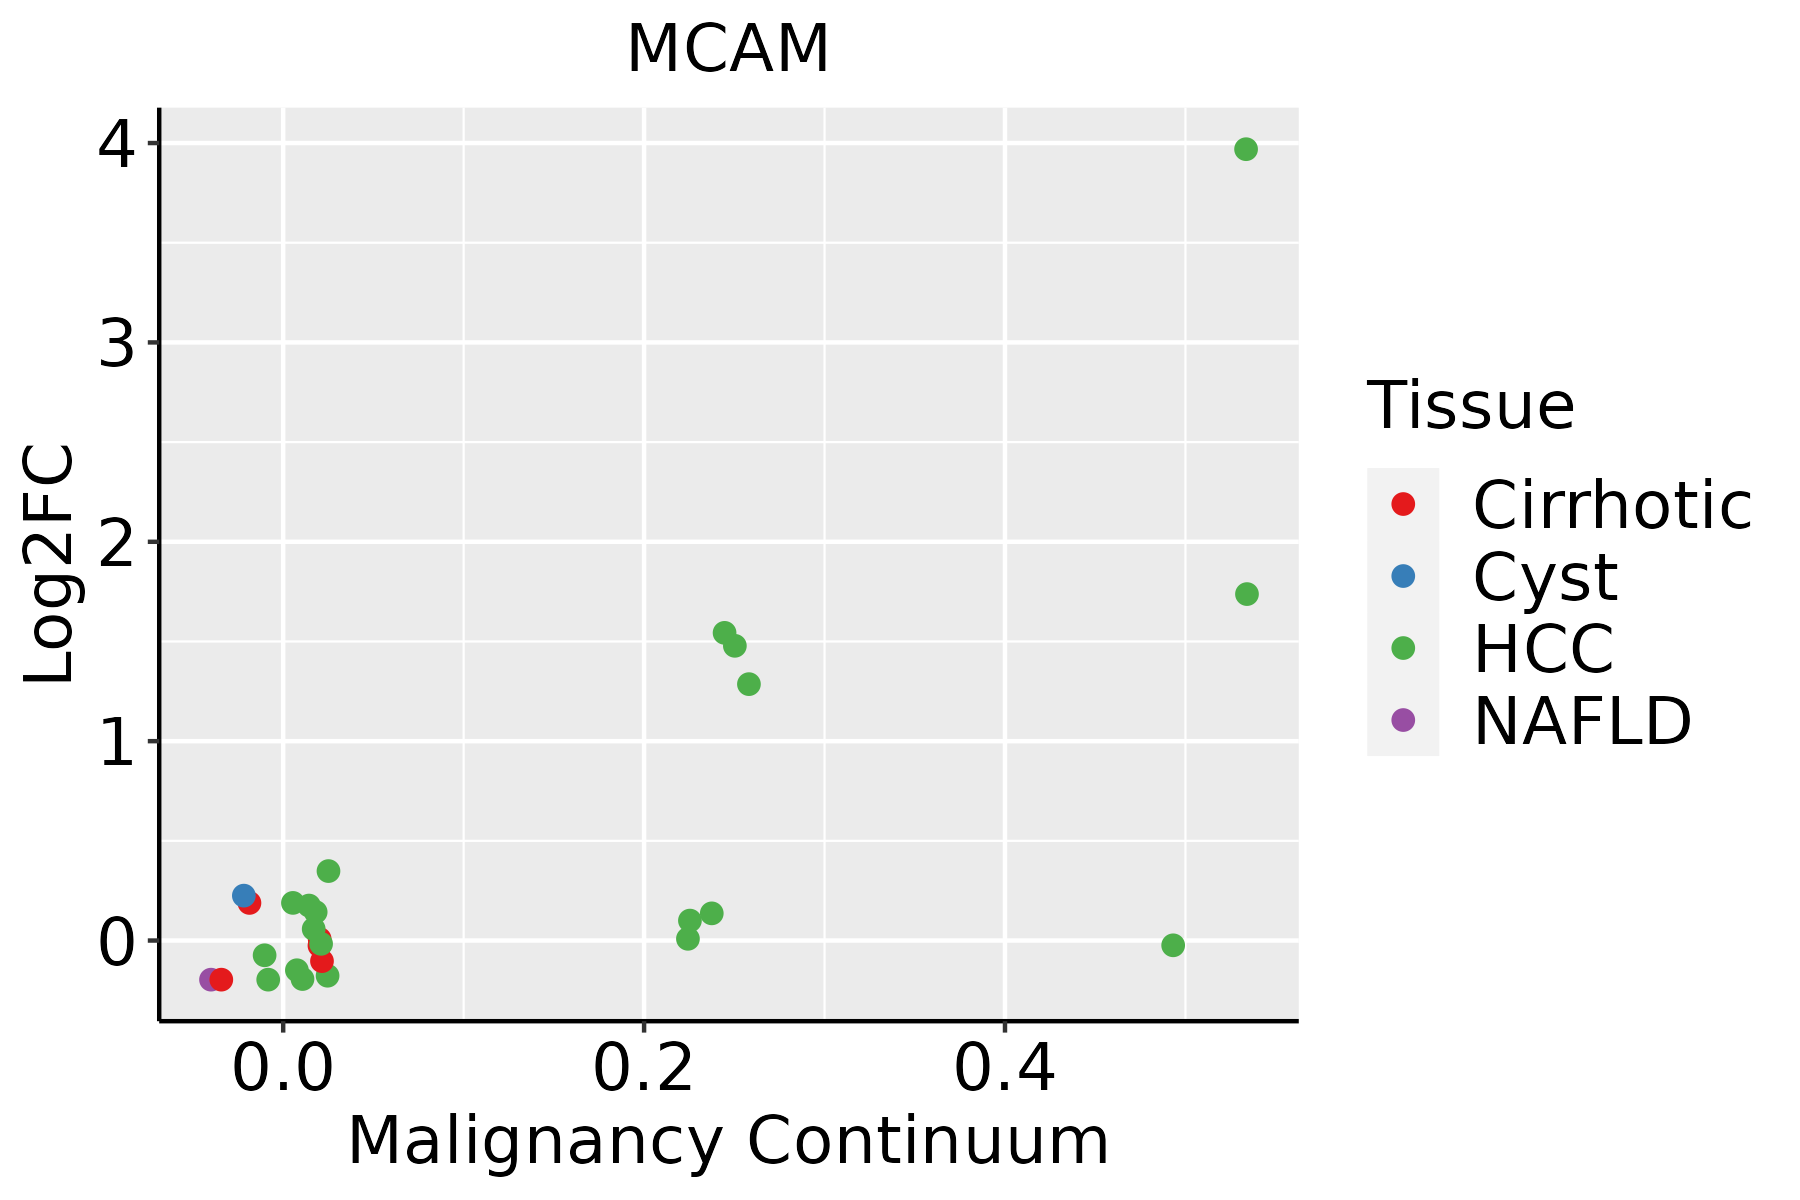 | HCC: Hepatocellular carcinoma |
| NAFLD: Non-alcoholic fatty liver disease | ||
| Oral Cavity | 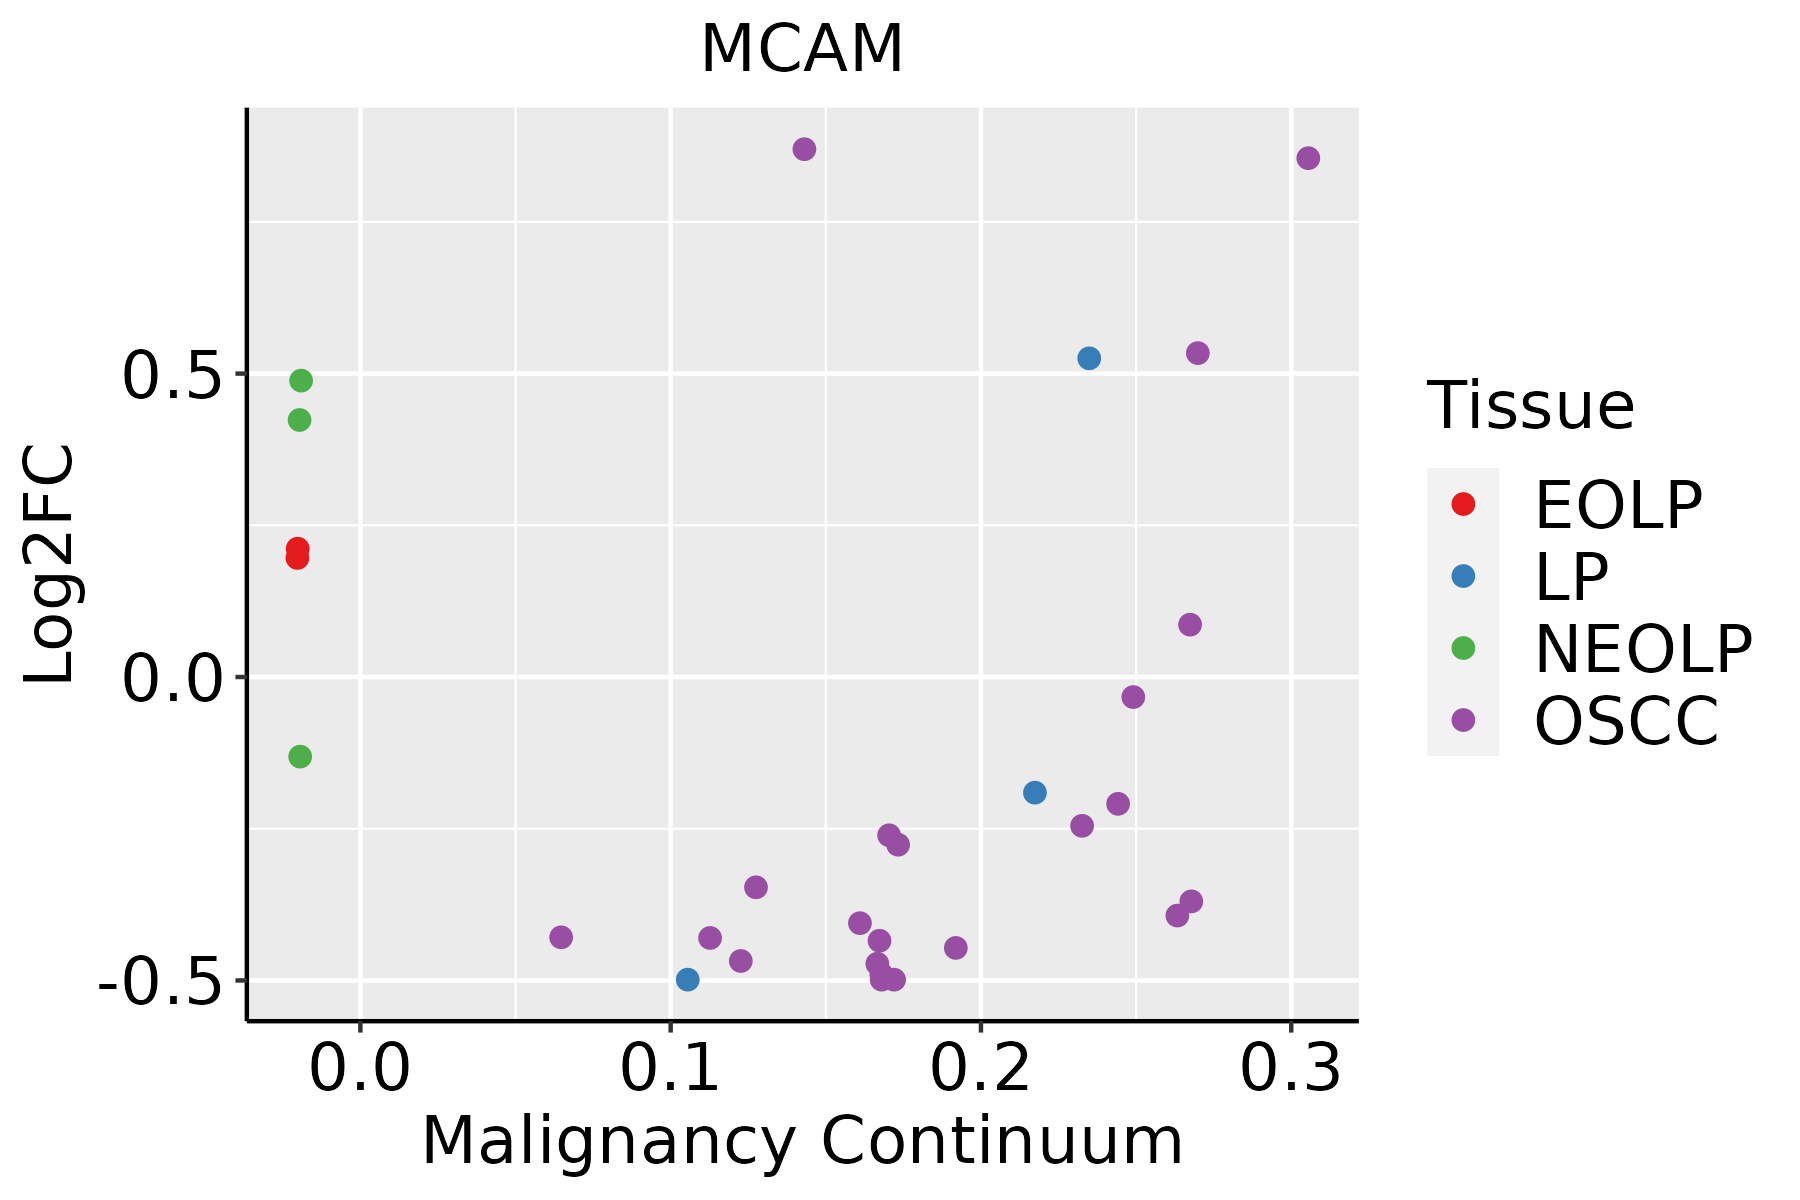 | EOLP: Erosive Oral lichen planus |
| LP: leukoplakia | ||
| NEOLP: Non-erosive oral lichen planus | ||
| OSCC: Oral squamous cell carcinoma | ||
| Thyroid |  | ATC: Anaplastic thyroid cancer |
| HT: Hashimoto's thyroiditis | ||
| PTC: Papillary thyroid cancer |
| ∗log2FC in expression of this searched gene in stem-like cells from each diseased tissue sample relative to stem-like cells in normal samples in each tissue plotted against the malignancy continuum. Samples are colored based on if they are from different disease stage. |
Top |
Malignant transformation related pathway analysis |
| Find out the enriched GO biological processes and KEGG pathways involved in transition from healthy to precancer to cancer |
| Tissue | Disease Stage | Enriched GO biological Processes |
| Colorectum | AD |  |
| Colorectum | SER |  |
| Colorectum | MSS |  |
| Colorectum | MSI-H |  |
| Colorectum | FAP |  |
| ∗Top 15 enriched GO BP terms are showed in the bar plot of each disease state in each tissue. Each row represents a significant GO biological process which is colored according to the -log10(p.adjust). |
| Page: 1 2 3 4 5 6 7 8 9 |
| GO ID | Tissue | Disease Stage | Description | Gene Ratio | Bg Ratio | pvalue | p.adjust | Count |
| GO:004206027 | Esophagus | ESCC | wound healing | 243/8552 | 422/18723 | 4.62e-07 | 6.25e-06 | 243 |
| GO:004206012 | Liver | Cirrhotic | wound healing | 155/4634 | 422/18723 | 2.12e-08 | 7.56e-07 | 155 |
| GO:004206022 | Liver | HCC | wound healing | 219/7958 | 422/18723 | 5.34e-05 | 5.04e-04 | 219 |
| GO:004206020 | Oral cavity | OSCC | wound healing | 237/7305 | 422/18723 | 4.51e-13 | 2.18e-11 | 237 |
| GO:00600553 | Oral cavity | OSCC | angiogenesis involved in wound healing | 19/7305 | 31/18723 | 9.93e-03 | 3.48e-02 | 19 |
| GO:004206033 | Oral cavity | NEOLP | wound healing | 106/2005 | 422/18723 | 1.93e-17 | 1.91e-14 | 106 |
| GO:00600552 | Oral cavity | NEOLP | angiogenesis involved in wound healing | 11/2005 | 31/18723 | 2.28e-04 | 2.38e-03 | 11 |
| GO:0061042 | Oral cavity | NEOLP | vascular wound healing | 9/2005 | 22/18723 | 2.46e-04 | 2.54e-03 | 9 |
| GO:0042060112 | Thyroid | PTC | wound healing | 190/5968 | 422/18723 | 7.72e-09 | 1.92e-07 | 190 |
| GO:004206034 | Thyroid | ATC | wound healing | 210/6293 | 422/18723 | 3.33e-12 | 1.37e-10 | 210 |
| Page: 1 |
| Pathway ID | Tissue | Disease Stage | Description | Gene Ratio | Bg Ratio | pvalue | p.adjust | qvalue | Count |
| Page: 1 |
Top |
Cell-cell communication analysis |
| Identification of potential cell-cell interactions between two cell types and their ligand-receptor pairs for different disease states |
| Ligand | Receptor | LRpair | Pathway | Tissue | Disease Stage |
| WNT5A | MCAM | WNT5A_MCAM | ncWNT | Cervix | ADJ |
| WNT5A | MCAM | WNT5A_MCAM | ncWNT | Cervix | CC |
| WNT5A | MCAM | WNT5A_MCAM | ncWNT | Cervix | Precancer |
| WNT5A | MCAM | WNT5A_MCAM | ncWNT | Endometrium | ADJ |
| WNT5A | MCAM | WNT5A_MCAM | ncWNT | Endometrium | AEH |
| WNT5A | MCAM | WNT5A_MCAM | ncWNT | Endometrium | Healthy |
| WNT5A | MCAM | WNT5A_MCAM | ncWNT | Esophagus | ESCC |
| WNT5A | MCAM | WNT5A_MCAM | ncWNT | HNSCC | Healthy |
| WNT5A | MCAM | WNT5A_MCAM | ncWNT | HNSCC | OSCC |
| WNT5A | MCAM | WNT5A_MCAM | ncWNT | HNSCC | Precancer |
| WNT5A | MCAM | WNT5A_MCAM | ncWNT | Skin | cSCC |
| WNT5A | MCAM | WNT5A_MCAM | ncWNT | THCA | Cancer |
| WNT5A | MCAM | WNT5A_MCAM | ncWNT | THCA | PTC |
| Page: 1 |
Top |
Single-cell gene regulatory network inference analysis |
| Find out the significant the regulons (TFs) and the target genes of each regulon across cell types for different disease states |
| TF | Cell Type | Tissue | Disease Stage | Target Gene | RSS | Regulon Activity |
| ∗The dot plots of a searched regulon are shown for all cell subpopulations in each disease state of each tissue based on the regulon specific score inferred using pySCENIC and by calculating the average expression. |
| Page: 1 |
Top |
Somatic mutation of malignant transformation related genes |
| Annotation of somatic variants for genes involved in malignant transformation |
| Hugo Symbol | Variant Class | Variant Classification | dbSNP RS | HGVSc | HGVSp | HGVSp Short | SWISSPROT | BIOTYPE | SIFT | PolyPhen | Tumor Sample Barcode | Tissue | Histology | Sex | Age | Stage | Therapy Types | Drugs | Outcome |
| MCAM | SNV | Missense_Mutation | rs765792211 | c.496N>A | p.Gly166Arg | p.G166R | P43121 | protein_coding | deleterious(0) | probably_damaging(0.999) | TCGA-A2-A1G1-01 | Breast | breast invasive carcinoma | Female | >=65 | I/II | Unknown | Unknown | SD |
| MCAM | SNV | Missense_Mutation | c.658C>G | p.Gln220Glu | p.Q220E | P43121 | protein_coding | tolerated(0.28) | benign(0.044) | TCGA-A8-A07R-01 | Breast | breast invasive carcinoma | Female | >=65 | III/IV | Ancillary | zoledronic | SD | |
| MCAM | SNV | Missense_Mutation | rs201149343 | c.1819N>A | p.Glu607Lys | p.E607K | P43121 | protein_coding | tolerated(0.54) | benign(0.048) | TCGA-AN-A046-01 | Breast | breast invasive carcinoma | Female | >=65 | I/II | Unknown | Unknown | SD |
| MCAM | SNV | Missense_Mutation | c.224N>C | p.Arg75Pro | p.R75P | P43121 | protein_coding | tolerated(0.19) | possibly_damaging(0.746) | TCGA-VS-A958-01 | Cervix | cervical & endocervical cancer | Female | <65 | I/II | Chemotherapy | cisplatin | CR | |
| MCAM | SNV | Missense_Mutation | rs772127034 | c.905N>G | p.Asn302Ser | p.N302S | P43121 | protein_coding | tolerated(0.5) | benign(0.314) | TCGA-5M-AAT6-01 | Colorectum | colon adenocarcinoma | Female | <65 | III/IV | Unknown | Unknown | PD |
| MCAM | SNV | Missense_Mutation | c.1376N>A | p.Arg459Gln | p.R459Q | P43121 | protein_coding | tolerated(0.2) | benign(0.059) | TCGA-AA-3492-01 | Colorectum | colon adenocarcinoma | Female | >=65 | I/II | Unknown | Unknown | SD | |
| MCAM | SNV | Missense_Mutation | c.1927N>A | p.Asp643Asn | p.D643N | P43121 | protein_coding | deleterious(0) | benign(0.397) | TCGA-AA-3510-01 | Colorectum | colon adenocarcinoma | Male | >=65 | I/II | Unknown | Unknown | SD | |
| MCAM | SNV | Missense_Mutation | novel | c.176A>G | p.His59Arg | p.H59R | P43121 | protein_coding | deleterious(0.01) | benign(0.216) | TCGA-AA-3947-01 | Colorectum | colon adenocarcinoma | Female | <65 | I/II | Unknown | Unknown | SD |
| MCAM | SNV | Missense_Mutation | c.1469C>G | p.Pro490Arg | p.P490R | P43121 | protein_coding | tolerated(0.42) | possibly_damaging(0.889) | TCGA-AA-A00O-01 | Colorectum | colon adenocarcinoma | Female | >=65 | III/IV | Unknown | Unknown | SD | |
| MCAM | SNV | Missense_Mutation | rs201149343 | c.1819N>A | p.Glu607Lys | p.E607K | P43121 | protein_coding | tolerated(0.54) | benign(0.048) | TCGA-G4-6302-01 | Colorectum | colon adenocarcinoma | Female | >=65 | I/II | Unknown | Unknown | SD |
| Page: 1 2 3 4 5 6 |
Top |
Related drugs of malignant transformation related genes |
| Identification of chemicals and drugs interact with genes involved in malignant transfromation |
| (DGIdb 4.0) |
| Entrez ID | Symbol | Category | Interaction Types | Drug Claim Name | Drug Name | PMIDs |
| 4162 | MCAM | EXTERNAL SIDE OF PLASMA MEMBRANE, DRUGGABLE GENOME | antibody | 354702277 |
| Page: 1 |

Copyright 2023-Present -The University of Texas Health Science Center at Houston |