
|
|||||
|
 | |
| |
| |
| |
| |
| |
|
Gene: MBOAT2 |
Gene summary for MBOAT2 |
| Gene information | Species | Human | Gene symbol | MBOAT2 | Gene ID | 129642 |
| Gene name | membrane bound O-acyltransferase domain containing 2 | |
| Gene Alias | LPAAT | |
| Cytomap | 2p25.1 | |
| Gene Type | protein-coding | GO ID | GO:0001501 | UniProtAcc | B0AZU0 |
Top |
Malignant transformation analysis |
| Identification of the aberrant gene expression in precancerous and cancerous lesions by comparing the gene expression of stem-like cells in diseased tissues with normal stem cells |
| Entrez ID | Symbol | Replicates | Species | Organ | Tissue | Adj P-value | Log2FC | Malignancy |
| 129642 | MBOAT2 | CCI_1 | Human | Cervix | CC | 9.19e-27 | 2.54e+00 | 0.528 |
| 129642 | MBOAT2 | CCI_3 | Human | Cervix | CC | 1.93e-12 | 1.14e+00 | 0.516 |
| 129642 | MBOAT2 | sample3 | Human | Cervix | CC | 1.86e-12 | 3.85e-01 | 0.1387 |
| 129642 | MBOAT2 | H2 | Human | Cervix | HSIL_HPV | 5.09e-04 | 2.70e-01 | 0.0632 |
| 129642 | MBOAT2 | T3 | Human | Cervix | CC | 2.73e-09 | 3.56e-01 | 0.1389 |
| 129642 | MBOAT2 | HTA11_3410_2000001011 | Human | Colorectum | AD | 1.85e-08 | -4.08e-01 | 0.0155 |
| 129642 | MBOAT2 | HTA11_866_3004761011 | Human | Colorectum | AD | 1.06e-06 | -3.83e-01 | 0.096 |
| 129642 | MBOAT2 | HTA11_7696_3000711011 | Human | Colorectum | AD | 1.43e-06 | -3.49e-01 | 0.0674 |
| 129642 | MBOAT2 | HTA11_99999970781_79442 | Human | Colorectum | MSS | 2.02e-08 | -3.54e-01 | 0.294 |
| 129642 | MBOAT2 | HTA11_99999965062_69753 | Human | Colorectum | MSI-H | 7.09e-10 | 1.35e+00 | 0.3487 |
| 129642 | MBOAT2 | HTA11_99999974143_84620 | Human | Colorectum | MSS | 2.11e-04 | -3.82e-01 | 0.3005 |
| 129642 | MBOAT2 | A015-C-203 | Human | Colorectum | FAP | 1.21e-17 | -3.48e-01 | -0.1294 |
| 129642 | MBOAT2 | A015-C-204 | Human | Colorectum | FAP | 3.28e-03 | -2.57e-01 | -0.0228 |
| 129642 | MBOAT2 | A002-C-201 | Human | Colorectum | FAP | 7.22e-08 | -1.78e-01 | 0.0324 |
| 129642 | MBOAT2 | A001-C-119 | Human | Colorectum | FAP | 7.02e-05 | -3.81e-01 | -0.1557 |
| 129642 | MBOAT2 | A001-C-108 | Human | Colorectum | FAP | 6.16e-07 | -1.39e-01 | -0.0272 |
| 129642 | MBOAT2 | A002-C-205 | Human | Colorectum | FAP | 2.48e-15 | -4.22e-01 | -0.1236 |
| 129642 | MBOAT2 | A001-C-104 | Human | Colorectum | FAP | 2.00e-04 | -2.50e-01 | 0.0184 |
| 129642 | MBOAT2 | A015-C-006 | Human | Colorectum | FAP | 2.01e-09 | -1.66e-01 | -0.0994 |
| 129642 | MBOAT2 | A015-C-106 | Human | Colorectum | FAP | 1.72e-04 | -2.54e-01 | -0.0511 |
| Page: 1 2 3 4 5 6 7 |
| Tissue | Expression Dynamics | Abbreviation |
| Cervix |  | CC: Cervix cancer |
| HSIL_HPV: HPV-infected high-grade squamous intraepithelial lesions | ||
| N_HPV: HPV-infected normal cervix | ||
| Colorectum (GSE201348) |  | FAP: Familial adenomatous polyposis |
| CRC: Colorectal cancer | ||
| Colorectum (HTA11) |  | AD: Adenomas |
| SER: Sessile serrated lesions | ||
| MSI-H: Microsatellite-high colorectal cancer | ||
| MSS: Microsatellite stable colorectal cancer | ||
| Esophagus |  | ESCC: Esophageal squamous cell carcinoma |
| HGIN: High-grade intraepithelial neoplasias | ||
| LGIN: Low-grade intraepithelial neoplasias | ||
| Liver | 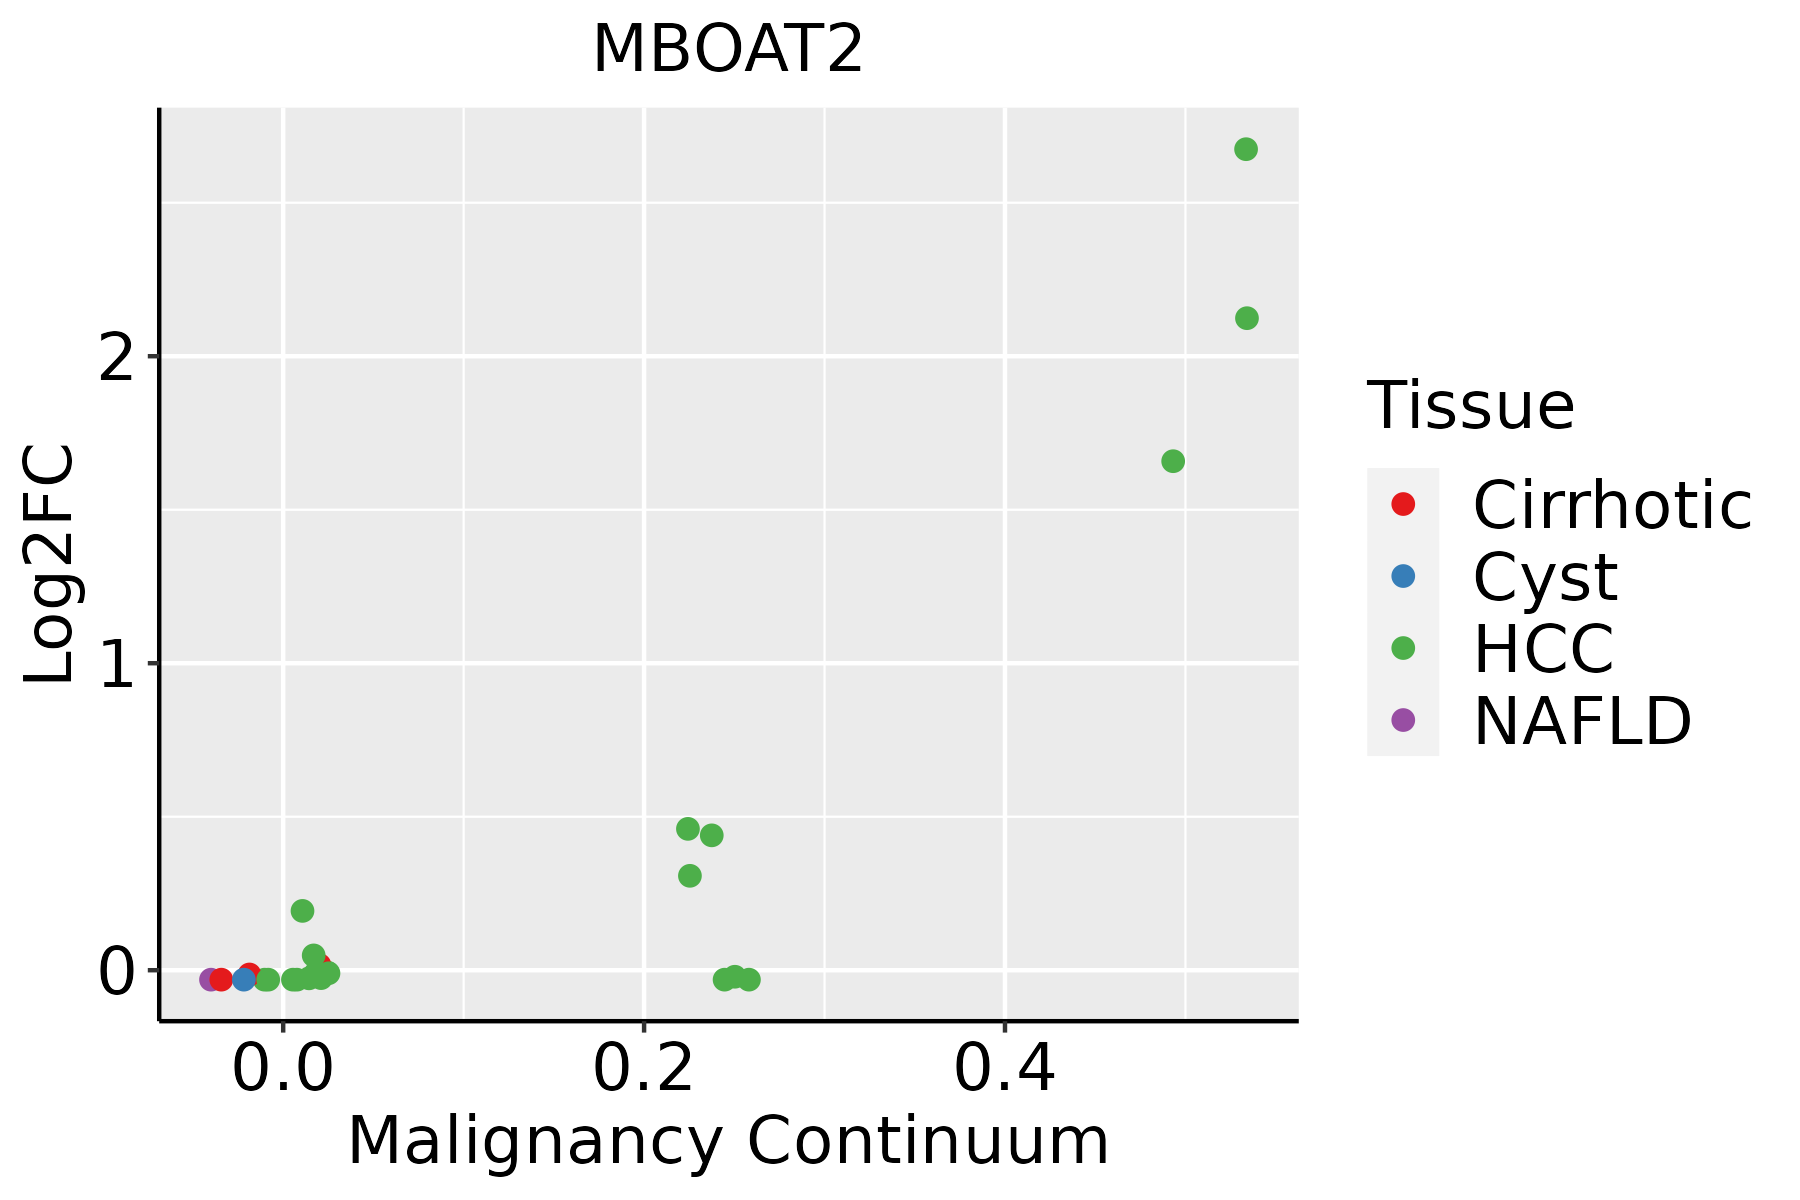 | HCC: Hepatocellular carcinoma |
| NAFLD: Non-alcoholic fatty liver disease | ||
| Oral Cavity | 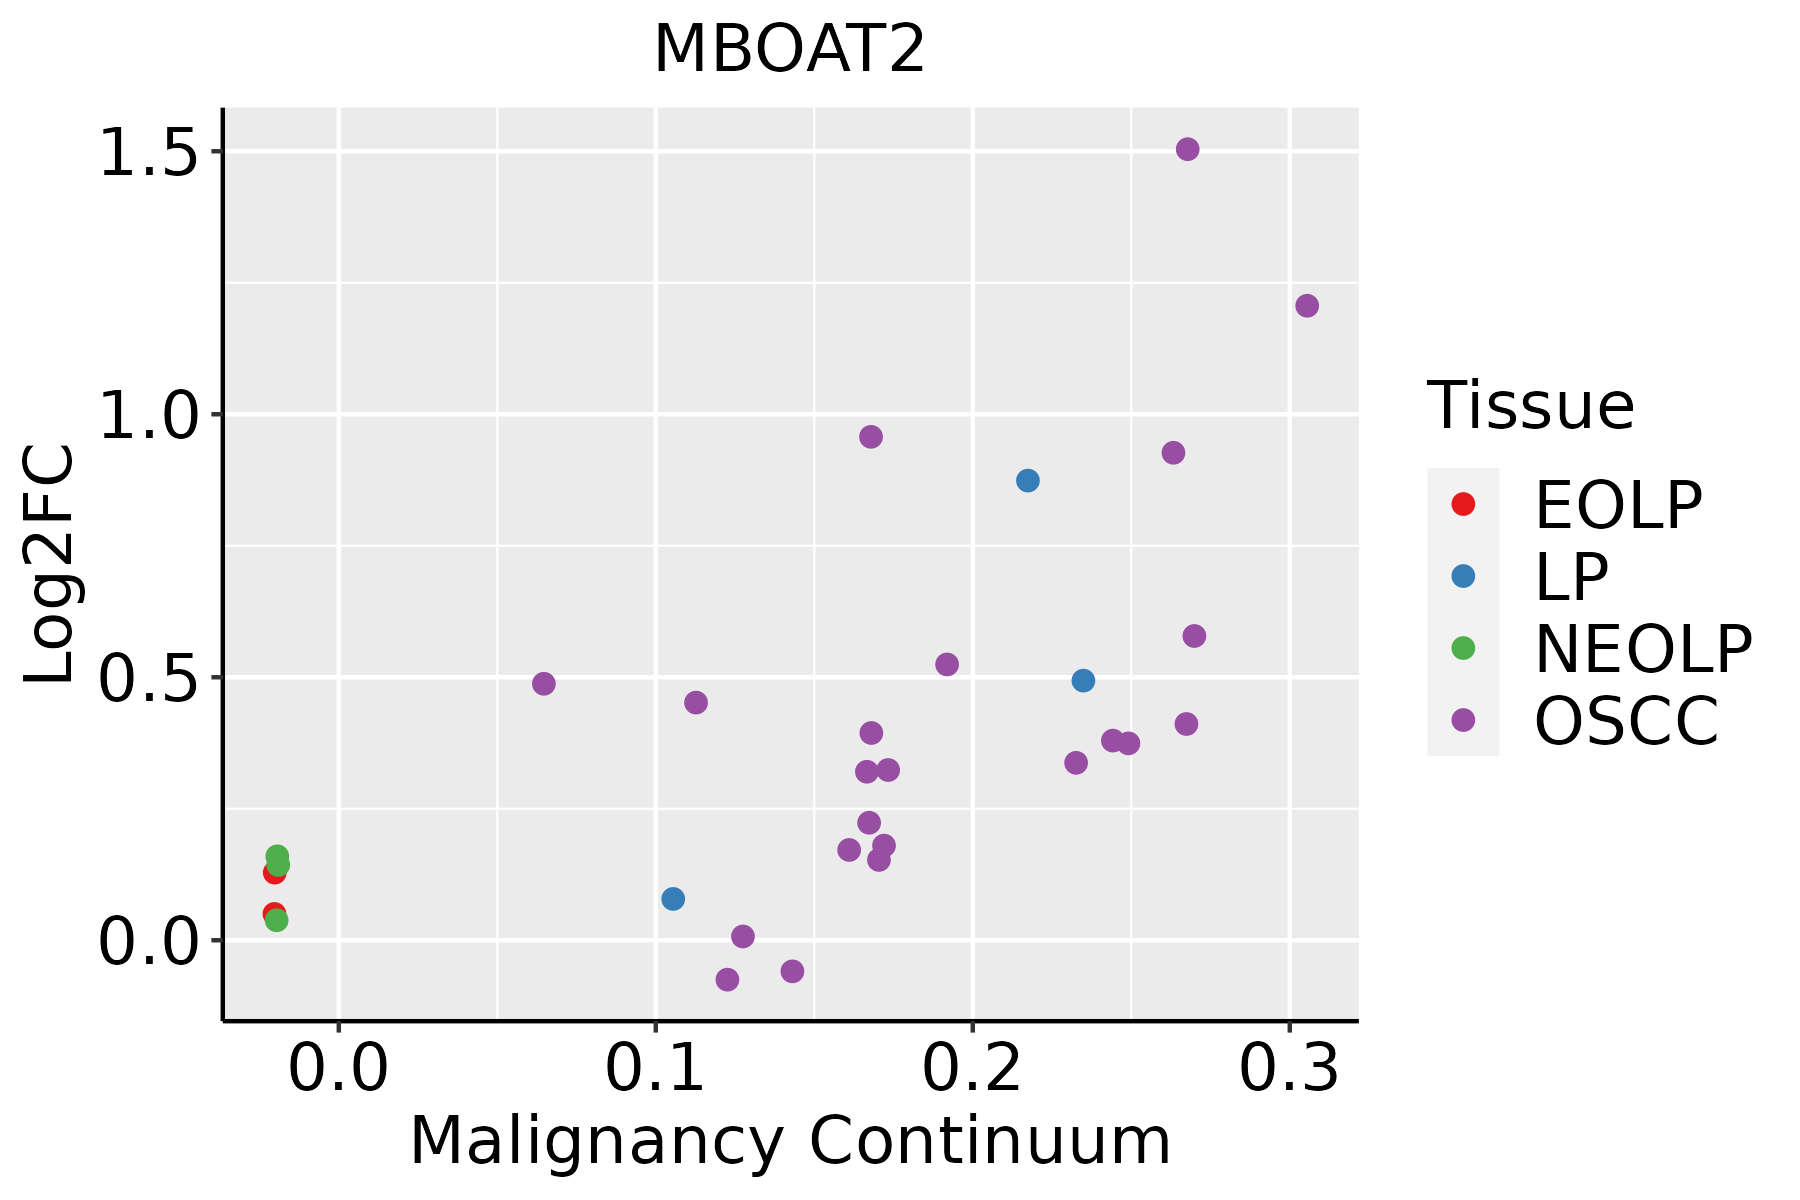 | EOLP: Erosive Oral lichen planus |
| LP: leukoplakia | ||
| NEOLP: Non-erosive oral lichen planus | ||
| OSCC: Oral squamous cell carcinoma | ||
| Prostate | 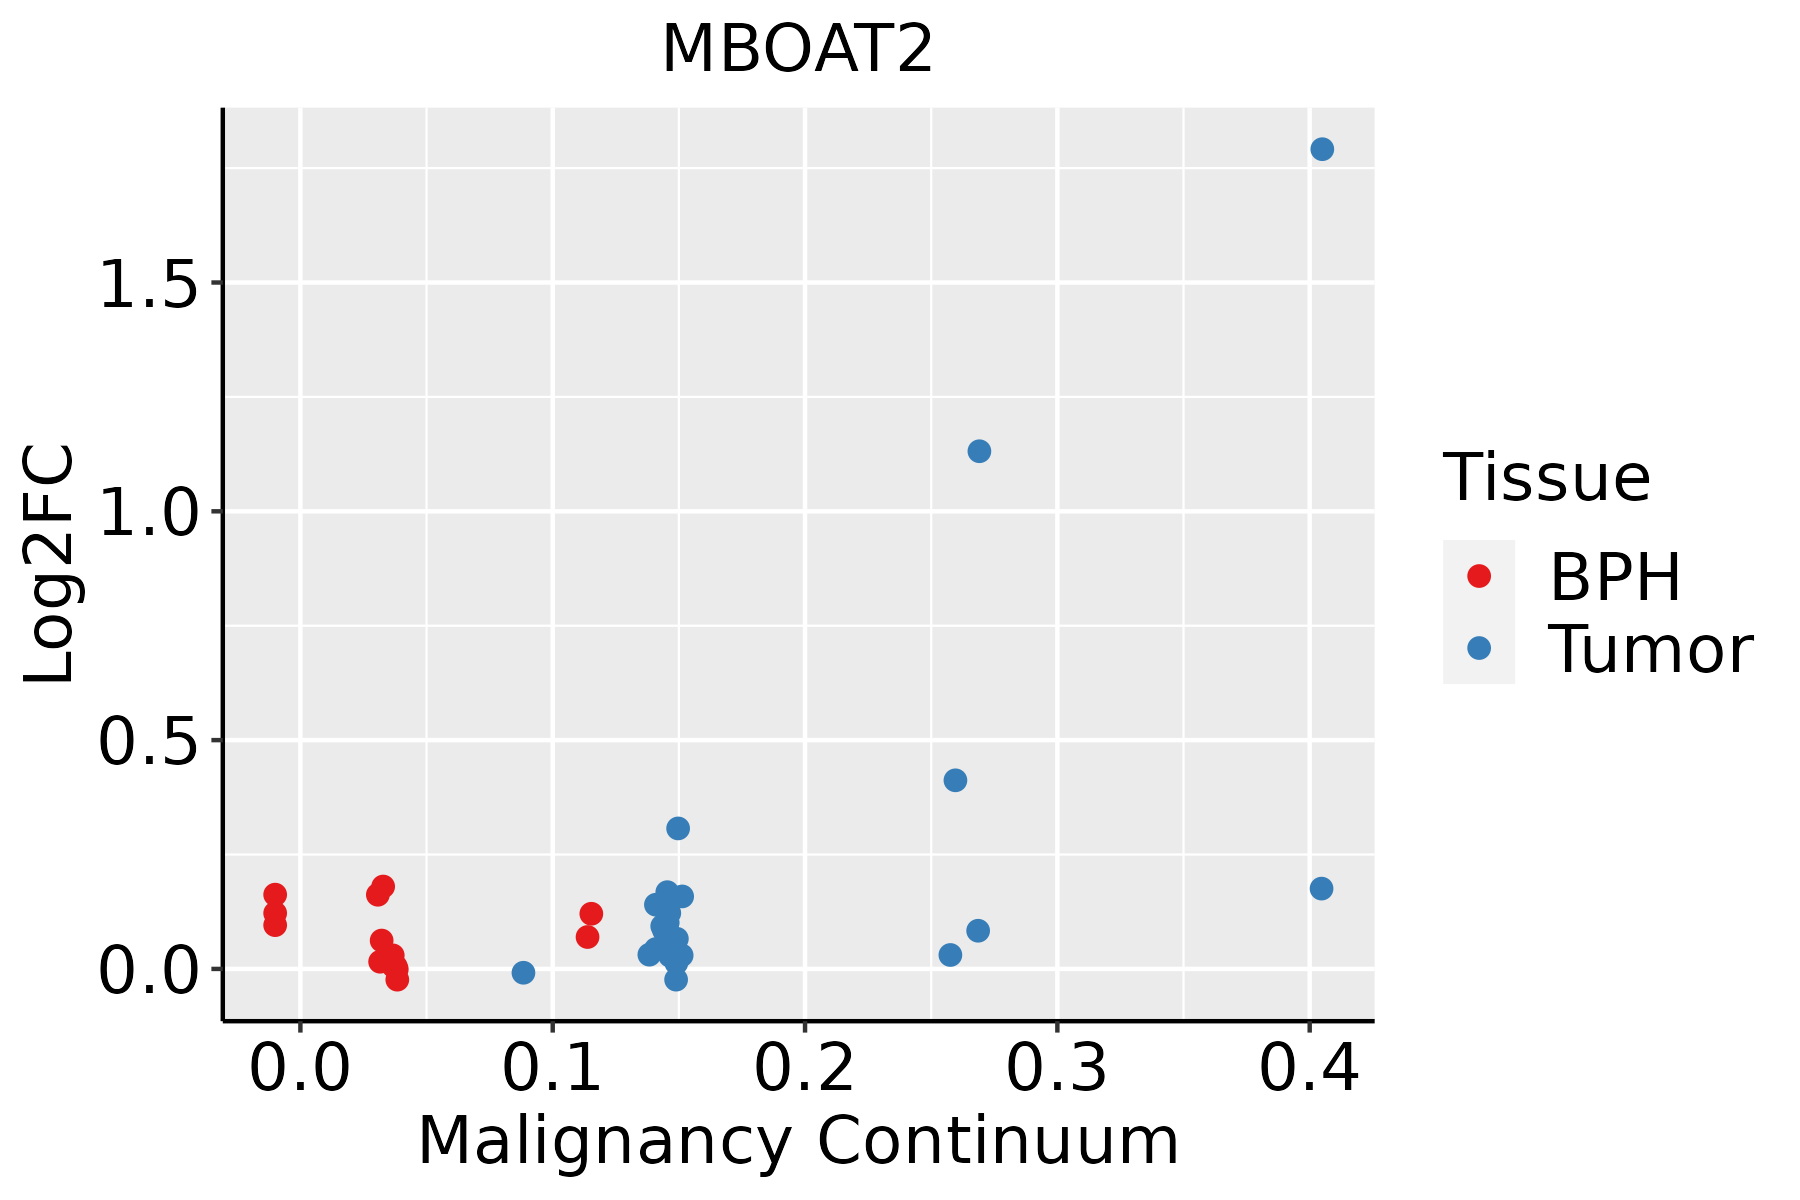 | BPH: Benign Prostatic Hyperplasia |
| Skin | 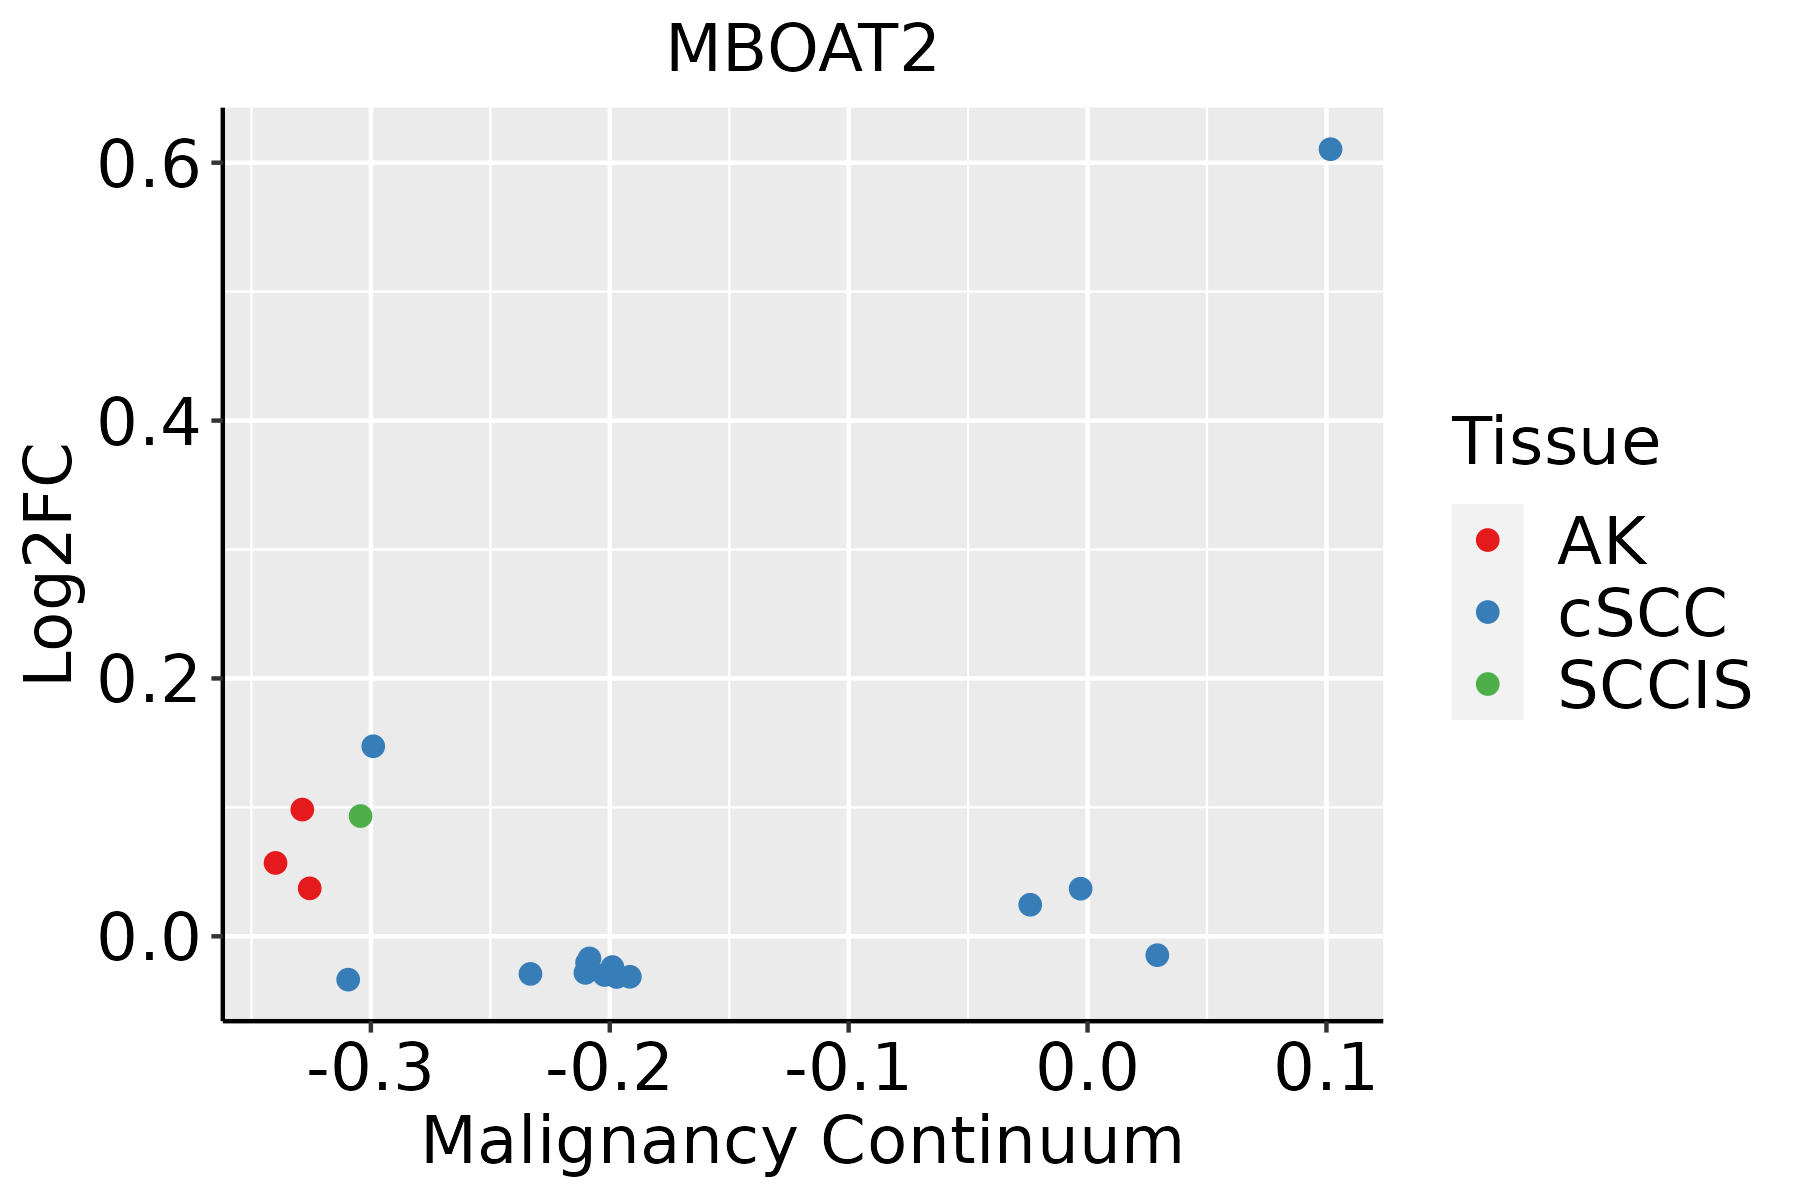 | AK: Actinic keratosis |
| cSCC: Cutaneous squamous cell carcinoma | ||
| SCCIS:squamous cell carcinoma in situ | ||
| Thyroid | 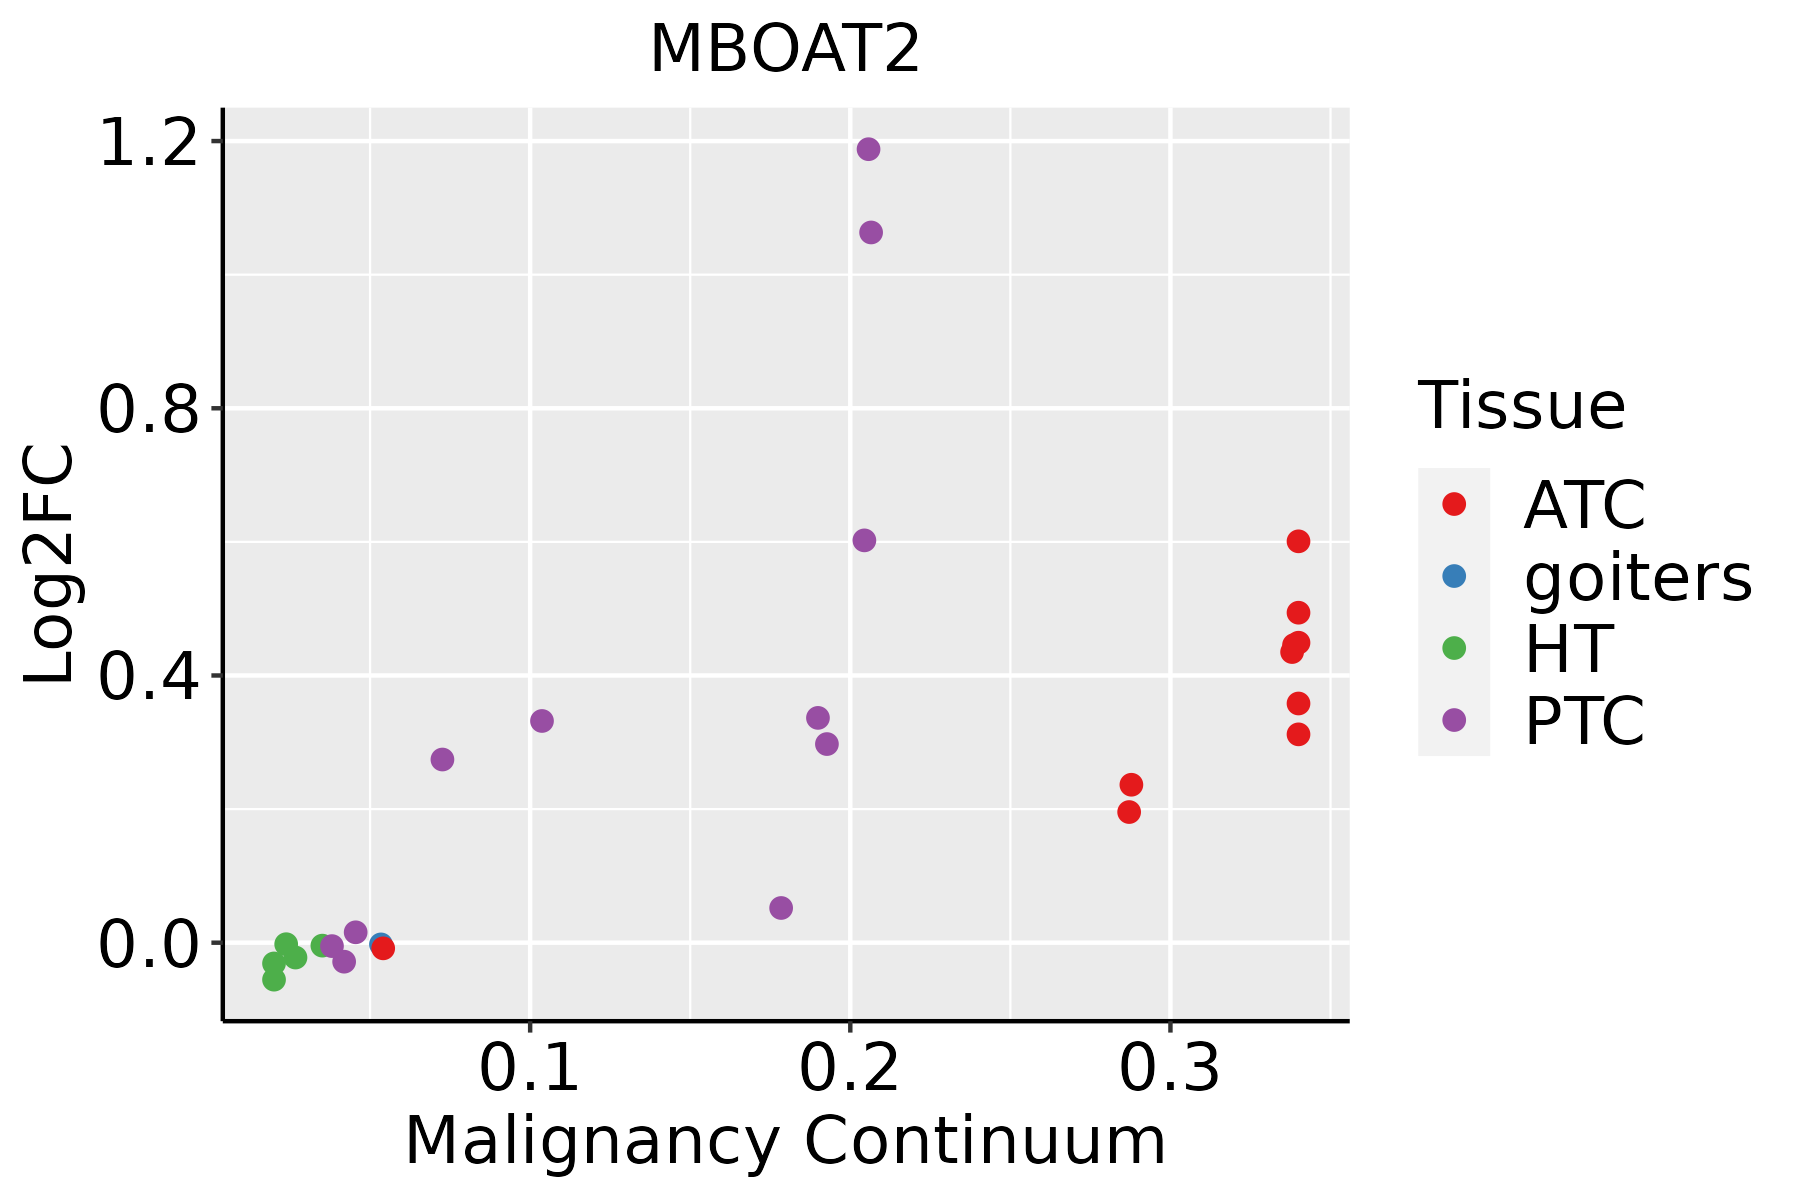 | ATC: Anaplastic thyroid cancer |
| HT: Hashimoto's thyroiditis | ||
| PTC: Papillary thyroid cancer |
| ∗log2FC in expression of this searched gene in stem-like cells from each diseased tissue sample relative to stem-like cells in normal samples in each tissue plotted against the malignancy continuum. Samples are colored based on if they are from different disease stage. |
Top |
Malignant transformation related pathway analysis |
| Find out the enriched GO biological processes and KEGG pathways involved in transition from healthy to precancer to cancer |
| Tissue | Disease Stage | Enriched GO biological Processes |
| Colorectum | AD |  |
| Colorectum | SER |  |
| Colorectum | MSS |  |
| Colorectum | MSI-H |  |
| Colorectum | FAP |  |
| ∗Top 15 enriched GO BP terms are showed in the bar plot of each disease state in each tissue. Each row represents a significant GO biological process which is colored according to the -log10(p.adjust). |
| Page: 1 2 3 4 5 6 7 8 9 |
| GO ID | Tissue | Disease Stage | Description | Gene Ratio | Bg Ratio | pvalue | p.adjust | Count |
| GO:00065755 | Cervix | HSIL_HPV | cellular modified amino acid metabolic process | 16/737 | 188/18723 | 3.18e-03 | 2.89e-02 | 16 |
| GO:0030258 | Colorectum | AD | lipid modification | 67/3918 | 212/18723 | 1.66e-04 | 2.27e-03 | 67 |
| GO:0006575 | Colorectum | AD | cellular modified amino acid metabolic process | 59/3918 | 188/18723 | 4.80e-04 | 5.27e-03 | 59 |
| GO:0006650 | Colorectum | AD | glycerophospholipid metabolic process | 83/3918 | 306/18723 | 5.40e-03 | 3.55e-02 | 83 |
| GO:0006644 | Colorectum | AD | phospholipid metabolic process | 101/3918 | 383/18723 | 5.80e-03 | 3.67e-02 | 101 |
| GO:00065751 | Colorectum | MSS | cellular modified amino acid metabolic process | 55/3467 | 188/18723 | 2.16e-04 | 3.01e-03 | 55 |
| GO:00302582 | Colorectum | MSS | lipid modification | 57/3467 | 212/18723 | 1.64e-03 | 1.49e-02 | 57 |
| GO:00065752 | Colorectum | MSI-H | cellular modified amino acid metabolic process | 25/1319 | 188/18723 | 1.61e-03 | 2.39e-02 | 25 |
| GO:00302583 | Colorectum | FAP | lipid modification | 52/2622 | 212/18723 | 2.84e-05 | 6.49e-04 | 52 |
| GO:0008654 | Colorectum | FAP | phospholipid biosynthetic process | 54/2622 | 253/18723 | 8.88e-04 | 9.08e-03 | 54 |
| GO:00066502 | Colorectum | FAP | glycerophospholipid metabolic process | 62/2622 | 306/18723 | 1.54e-03 | 1.38e-02 | 62 |
| GO:00066442 | Colorectum | FAP | phospholipid metabolic process | 74/2622 | 383/18723 | 2.24e-03 | 1.83e-02 | 74 |
| GO:0006658 | Colorectum | FAP | phosphatidylserine metabolic process | 9/2622 | 25/18723 | 5.01e-03 | 3.33e-02 | 9 |
| GO:00086541 | Colorectum | CRC | phospholipid biosynthetic process | 49/2078 | 253/18723 | 7.07e-05 | 1.51e-03 | 49 |
| GO:00066503 | Colorectum | CRC | glycerophospholipid metabolic process | 55/2078 | 306/18723 | 2.10e-04 | 3.55e-03 | 55 |
| GO:00302584 | Colorectum | CRC | lipid modification | 41/2078 | 212/18723 | 2.73e-04 | 4.38e-03 | 41 |
| GO:00066443 | Colorectum | CRC | phospholipid metabolic process | 65/2078 | 383/18723 | 3.21e-04 | 4.95e-03 | 65 |
| GO:00464861 | Colorectum | CRC | glycerolipid metabolic process | 64/2078 | 392/18723 | 1.01e-03 | 1.19e-02 | 64 |
| GO:00066581 | Colorectum | CRC | phosphatidylserine metabolic process | 8/2078 | 25/18723 | 4.33e-03 | 3.47e-02 | 8 |
| GO:0002062 | Colorectum | CRC | chondrocyte differentiation | 21/2078 | 106/18723 | 5.87e-03 | 4.33e-02 | 21 |
| Page: 1 2 3 |
| Pathway ID | Tissue | Disease Stage | Description | Gene Ratio | Bg Ratio | pvalue | p.adjust | qvalue | Count |
| hsa00561 | Colorectum | AD | Glycerolipid metabolism | 24/2092 | 63/8465 | 1.25e-02 | 4.54e-02 | 2.90e-02 | 24 |
| hsa005611 | Colorectum | AD | Glycerolipid metabolism | 24/2092 | 63/8465 | 1.25e-02 | 4.54e-02 | 2.90e-02 | 24 |
| hsa005612 | Colorectum | MSS | Glycerolipid metabolism | 23/1875 | 63/8465 | 6.55e-03 | 2.64e-02 | 1.62e-02 | 23 |
| hsa005613 | Colorectum | MSS | Glycerolipid metabolism | 23/1875 | 63/8465 | 6.55e-03 | 2.64e-02 | 1.62e-02 | 23 |
| hsa005615 | Liver | HCC | Glycerolipid metabolism | 41/4020 | 63/8465 | 3.59e-03 | 1.12e-02 | 6.22e-03 | 41 |
| hsa0056112 | Liver | HCC | Glycerolipid metabolism | 41/4020 | 63/8465 | 3.59e-03 | 1.12e-02 | 6.22e-03 | 41 |
| Page: 1 |
Top |
Cell-cell communication analysis |
| Identification of potential cell-cell interactions between two cell types and their ligand-receptor pairs for different disease states |
| Ligand | Receptor | LRpair | Pathway | Tissue | Disease Stage |
| Page: 1 |
Top |
Single-cell gene regulatory network inference analysis |
| Find out the significant the regulons (TFs) and the target genes of each regulon across cell types for different disease states |
| TF | Cell Type | Tissue | Disease Stage | Target Gene | RSS | Regulon Activity |
| ∗The dot plots of a searched regulon are shown for all cell subpopulations in each disease state of each tissue based on the regulon specific score inferred using pySCENIC and by calculating the average expression. |
| Page: 1 |
Top |
Somatic mutation of malignant transformation related genes |
| Annotation of somatic variants for genes involved in malignant transformation |
| Hugo Symbol | Variant Class | Variant Classification | dbSNP RS | HGVSc | HGVSp | HGVSp Short | SWISSPROT | BIOTYPE | SIFT | PolyPhen | Tumor Sample Barcode | Tissue | Histology | Sex | Age | Stage | Therapy Types | Drugs | Outcome |
| MBOAT2 | SNV | Missense_Mutation | c.1306C>G | p.Leu436Val | p.L436V | Q6ZWT7 | protein_coding | deleterious(0) | probably_damaging(1) | TCGA-BH-A18P-01 | Breast | breast invasive carcinoma | Female | <65 | I/II | Unknown | Unknown | PD | |
| MBOAT2 | SNV | Missense_Mutation | novel | c.136N>G | p.Leu46Val | p.L46V | Q6ZWT7 | protein_coding | deleterious(0) | probably_damaging(0.999) | TCGA-JW-A5VL-01 | Cervix | cervical & endocervical cancer | Female | <65 | I/II | Unknown | Unknown | SD |
| MBOAT2 | SNV | Missense_Mutation | c.439G>A | p.Glu147Lys | p.E147K | Q6ZWT7 | protein_coding | deleterious(0.01) | possibly_damaging(0.802) | TCGA-AA-A00N-01 | Colorectum | colon adenocarcinoma | Male | >=65 | I/II | Unknown | Unknown | PD | |
| MBOAT2 | SNV | Missense_Mutation | c.1494N>G | p.Phe498Leu | p.F498L | Q6ZWT7 | protein_coding | tolerated(0.43) | benign(0) | TCGA-AA-A010-01 | Colorectum | colon adenocarcinoma | Female | <65 | I/II | Chemotherapy | folinic | CR | |
| MBOAT2 | SNV | Missense_Mutation | c.695N>T | p.Ala232Val | p.A232V | Q6ZWT7 | protein_coding | tolerated(0.06) | benign(0.393) | TCGA-AA-A010-01 | Colorectum | colon adenocarcinoma | Female | <65 | I/II | Chemotherapy | folinic | CR | |
| MBOAT2 | SNV | Missense_Mutation | c.128G>A | p.Arg43Gln | p.R43Q | Q6ZWT7 | protein_coding | deleterious(0) | probably_damaging(0.999) | TCGA-AG-3892-01 | Colorectum | rectum adenocarcinoma | Female | <65 | I/II | Unknown | Unknown | SD | |
| MBOAT2 | SNV | Missense_Mutation | novel | c.1197N>A | p.Asn399Lys | p.N399K | Q6ZWT7 | protein_coding | tolerated(0.06) | probably_damaging(0.943) | TCGA-AG-A002-01 | Colorectum | rectum adenocarcinoma | Male | <65 | I/II | Unknown | Unknown | SD |
| MBOAT2 | SNV | Missense_Mutation | c.128N>A | p.Arg43Gln | p.R43Q | Q6ZWT7 | protein_coding | deleterious(0) | probably_damaging(0.999) | TCGA-AG-A002-01 | Colorectum | rectum adenocarcinoma | Male | <65 | I/II | Unknown | Unknown | SD | |
| MBOAT2 | SNV | Missense_Mutation | c.128G>A | p.Arg43Gln | p.R43Q | Q6ZWT7 | protein_coding | deleterious(0) | probably_damaging(0.999) | TCGA-EI-6917-01 | Colorectum | rectum adenocarcinoma | Male | <65 | III/IV | Chemotherapy | 5fluorouracil+oxaciplatina+l-folinian | SD | |
| MBOAT2 | insertion | Frame_Shift_Ins | novel | c.211dupT | p.Cys71LeufsTer52 | p.C71Lfs*52 | Q6ZWT7 | protein_coding | TCGA-AM-5821-01 | Colorectum | colon adenocarcinoma | Female | >=65 | I/II | Unknown | Unknown | SD |
| Page: 1 2 3 4 5 6 |
Top |
Related drugs of malignant transformation related genes |
| Identification of chemicals and drugs interact with genes involved in malignant transfromation |
| (DGIdb 4.0) |
| Entrez ID | Symbol | Category | Interaction Types | Drug Claim Name | Drug Name | PMIDs |
| Page: 1 |

Copyright 2023-Present -The University of Texas Health Science Center at Houston |