
|
|||||
|
 | |
| |
| |
| |
| |
| |
|
Gene: MBOAT1 |
Gene summary for MBOAT1 |
| Gene information | Species | Human | Gene symbol | MBOAT1 | Gene ID | 154141 |
| Gene name | membrane bound O-acyltransferase domain containing 1 | |
| Gene Alias | LPEAT1 | |
| Cytomap | 6p22.3 | |
| Gene Type | protein-coding | GO ID | GO:0006575 | UniProtAcc | Q6ZNC8 |
Top |
Malignant transformation analysis |
| Identification of the aberrant gene expression in precancerous and cancerous lesions by comparing the gene expression of stem-like cells in diseased tissues with normal stem cells |
| Entrez ID | Symbol | Replicates | Species | Organ | Tissue | Adj P-value | Log2FC | Malignancy |
| 154141 | MBOAT1 | AEH-subject1 | Human | Endometrium | AEH | 8.06e-19 | 3.92e-01 | -0.3059 |
| 154141 | MBOAT1 | AEH-subject2 | Human | Endometrium | AEH | 5.70e-12 | 4.38e-01 | -0.2525 |
| 154141 | MBOAT1 | AEH-subject3 | Human | Endometrium | AEH | 3.92e-12 | 3.74e-01 | -0.2576 |
| 154141 | MBOAT1 | AEH-subject4 | Human | Endometrium | AEH | 5.65e-13 | 4.88e-01 | -0.2657 |
| 154141 | MBOAT1 | AEH-subject5 | Human | Endometrium | AEH | 5.21e-08 | 3.84e-01 | -0.2953 |
| 154141 | MBOAT1 | EEC-subject1 | Human | Endometrium | EEC | 1.94e-15 | 4.70e-01 | -0.2682 |
| 154141 | MBOAT1 | EEC-subject2 | Human | Endometrium | EEC | 1.66e-22 | 5.39e-01 | -0.2607 |
| 154141 | MBOAT1 | EEC-subject4 | Human | Endometrium | EEC | 5.14e-13 | 3.99e-01 | -0.2571 |
| 154141 | MBOAT1 | EEC-subject5 | Human | Endometrium | EEC | 7.47e-18 | 4.36e-01 | -0.249 |
| 154141 | MBOAT1 | LZE2T | Human | Esophagus | ESCC | 4.73e-03 | 4.12e-01 | 0.082 |
| 154141 | MBOAT1 | LZE4T | Human | Esophagus | ESCC | 6.35e-03 | 1.18e-01 | 0.0811 |
| 154141 | MBOAT1 | LZE5T | Human | Esophagus | ESCC | 1.40e-06 | 3.33e-01 | 0.0514 |
| 154141 | MBOAT1 | LZE7T | Human | Esophagus | ESCC | 1.40e-08 | 3.15e-01 | 0.0667 |
| 154141 | MBOAT1 | LZE22T | Human | Esophagus | ESCC | 1.48e-05 | 3.05e-01 | 0.068 |
| 154141 | MBOAT1 | LZE24T | Human | Esophagus | ESCC | 2.08e-11 | 2.56e-01 | 0.0596 |
| 154141 | MBOAT1 | LZE21T | Human | Esophagus | ESCC | 1.57e-07 | 3.41e-01 | 0.0655 |
| 154141 | MBOAT1 | P1T-E | Human | Esophagus | ESCC | 2.97e-02 | 1.43e-01 | 0.0875 |
| 154141 | MBOAT1 | P2T-E | Human | Esophagus | ESCC | 1.20e-10 | 1.60e-01 | 0.1177 |
| 154141 | MBOAT1 | P4T-E | Human | Esophagus | ESCC | 9.91e-08 | 1.81e-01 | 0.1323 |
| 154141 | MBOAT1 | P8T-E | Human | Esophagus | ESCC | 9.11e-07 | 1.76e-01 | 0.0889 |
| Page: 1 2 3 4 |
| Tissue | Expression Dynamics | Abbreviation |
| Endometrium | 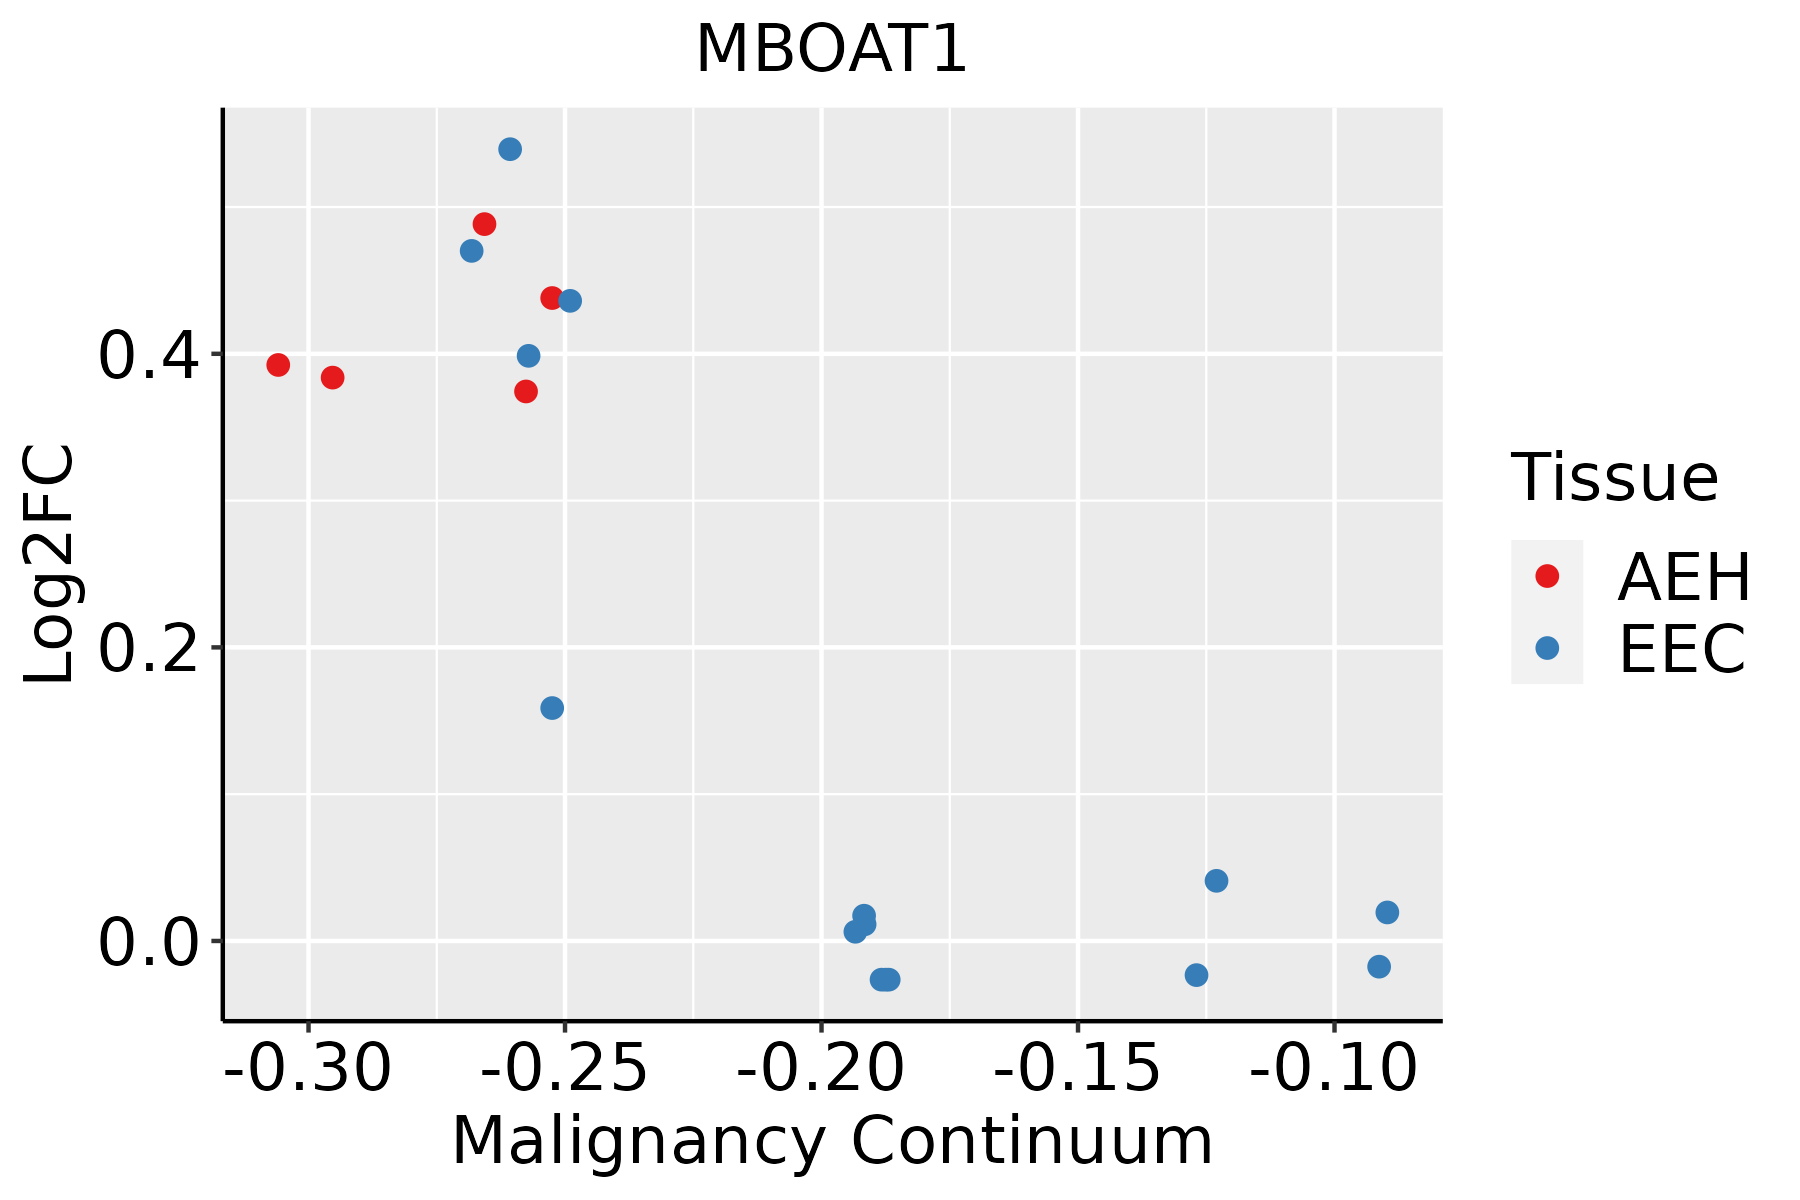 | AEH: Atypical endometrial hyperplasia |
| EEC: Endometrioid Cancer | ||
| Liver |  | HCC: Hepatocellular carcinoma |
| NAFLD: Non-alcoholic fatty liver disease | ||
| Lung |  | AAH: Atypical adenomatous hyperplasia |
| AIS: Adenocarcinoma in situ | ||
| IAC: Invasive lung adenocarcinoma | ||
| MIA: Minimally invasive adenocarcinoma |
| ∗log2FC in expression of this searched gene in stem-like cells from each diseased tissue sample relative to stem-like cells in normal samples in each tissue plotted against the malignancy continuum. Samples are colored based on if they are from different disease stage. |
Top |
Malignant transformation related pathway analysis |
| Find out the enriched GO biological processes and KEGG pathways involved in transition from healthy to precancer to cancer |
| Tissue | Disease Stage | Enriched GO biological Processes |
| Colorectum | AD |  |
| Colorectum | SER |  |
| Colorectum | MSS |  |
| Colorectum | MSI-H |  |
| Colorectum | FAP |  |
| ∗Top 15 enriched GO BP terms are showed in the bar plot of each disease state in each tissue. Each row represents a significant GO biological process which is colored according to the -log10(p.adjust). |
| Page: 1 2 3 4 5 6 7 8 9 |
| GO ID | Tissue | Disease Stage | Description | Gene Ratio | Bg Ratio | pvalue | p.adjust | Count |
| GO:00109758 | Endometrium | AEH | regulation of neuron projection development | 75/2100 | 445/18723 | 2.01e-04 | 2.54e-03 | 75 |
| GO:001097513 | Endometrium | EEC | regulation of neuron projection development | 79/2168 | 445/18723 | 6.80e-05 | 1.01e-03 | 79 |
| GO:000657521 | Liver | HCC | cellular modified amino acid metabolic process | 119/7958 | 188/18723 | 6.47e-09 | 1.67e-07 | 119 |
| GO:00086542 | Liver | HCC | phospholipid biosynthetic process | 150/7958 | 253/18723 | 4.77e-08 | 1.03e-06 | 150 |
| GO:00066444 | Liver | HCC | phospholipid metabolic process | 214/7958 | 383/18723 | 7.25e-08 | 1.48e-06 | 214 |
| GO:004648611 | Liver | HCC | glycerolipid metabolic process | 215/7958 | 392/18723 | 4.54e-07 | 7.49e-06 | 215 |
| GO:003025821 | Liver | HCC | lipid modification | 123/7958 | 212/18723 | 3.50e-06 | 4.58e-05 | 123 |
| GO:00066504 | Liver | HCC | glycerophospholipid metabolic process | 168/7958 | 306/18723 | 7.27e-06 | 8.62e-05 | 168 |
| GO:001097511 | Liver | HCC | regulation of neuron projection development | 220/7958 | 445/18723 | 1.68e-03 | 8.78e-03 | 220 |
| GO:00109756 | Lung | IAC | regulation of neuron projection development | 82/2061 | 445/18723 | 1.82e-06 | 8.78e-05 | 82 |
| GO:001097512 | Lung | AIS | regulation of neuron projection development | 69/1849 | 445/18723 | 1.05e-04 | 2.53e-03 | 69 |
| GO:00464701 | Lung | AIS | phosphatidylcholine metabolic process | 15/1849 | 74/18723 | 5.25e-03 | 4.49e-02 | 15 |
| Page: 1 |
| Pathway ID | Tissue | Disease Stage | Description | Gene Ratio | Bg Ratio | pvalue | p.adjust | qvalue | Count |
| hsa005615 | Liver | HCC | Glycerolipid metabolism | 41/4020 | 63/8465 | 3.59e-03 | 1.12e-02 | 6.22e-03 | 41 |
| hsa0056112 | Liver | HCC | Glycerolipid metabolism | 41/4020 | 63/8465 | 3.59e-03 | 1.12e-02 | 6.22e-03 | 41 |
| Page: 1 |
Top |
Cell-cell communication analysis |
| Identification of potential cell-cell interactions between two cell types and their ligand-receptor pairs for different disease states |
| Ligand | Receptor | LRpair | Pathway | Tissue | Disease Stage |
| Page: 1 |
Top |
Single-cell gene regulatory network inference analysis |
| Find out the significant the regulons (TFs) and the target genes of each regulon across cell types for different disease states |
| TF | Cell Type | Tissue | Disease Stage | Target Gene | RSS | Regulon Activity |
| ∗The dot plots of a searched regulon are shown for all cell subpopulations in each disease state of each tissue based on the regulon specific score inferred using pySCENIC and by calculating the average expression. |
| Page: 1 |
Top |
Somatic mutation of malignant transformation related genes |
| Annotation of somatic variants for genes involved in malignant transformation |
| Hugo Symbol | Variant Class | Variant Classification | dbSNP RS | HGVSc | HGVSp | HGVSp Short | SWISSPROT | BIOTYPE | SIFT | PolyPhen | Tumor Sample Barcode | Tissue | Histology | Sex | Age | Stage | Therapy Types | Drugs | Outcome |
| MBOAT1 | SNV | Missense_Mutation | c.152N>A | p.Arg51His | p.R51H | Q6ZNC8 | protein_coding | deleterious(0) | probably_damaging(0.997) | TCGA-EW-A1IZ-01 | Breast | breast invasive carcinoma | Female | <65 | III/IV | Chemotherapy | taxotere | SD | |
| MBOAT1 | SNV | Missense_Mutation | c.1316N>T | p.Ala439Val | p.A439V | Q6ZNC8 | protein_coding | tolerated(0.4) | benign(0.047) | TCGA-C5-A7UH-01 | Cervix | cervical & endocervical cancer | Female | <65 | III/IV | Chemotherapy | cisplatin | SD | |
| MBOAT1 | SNV | Missense_Mutation | rs199705606 | c.946G>A | p.Gly316Arg | p.G316R | Q6ZNC8 | protein_coding | deleterious(0) | probably_damaging(0.998) | TCGA-ZX-AA5X-01 | Cervix | cervical & endocervical cancer | Female | <65 | III/IV | Unknown | Unknown | SD |
| MBOAT1 | SNV | Missense_Mutation | c.1133N>T | p.Ala378Val | p.A378V | Q6ZNC8 | protein_coding | deleterious(0) | probably_damaging(0.981) | TCGA-AA-3956-01 | Colorectum | colon adenocarcinoma | Male | >=65 | I/II | Unknown | Unknown | SD | |
| MBOAT1 | SNV | Missense_Mutation | novel | c.842N>A | p.Arg281Gln | p.R281Q | Q6ZNC8 | protein_coding | tolerated(0.28) | benign(0.23) | TCGA-AA-3984-01 | Colorectum | colon adenocarcinoma | Female | <65 | I/II | Unknown | Unknown | SD |
| MBOAT1 | SNV | Missense_Mutation | rs769390413 | c.1210N>A | p.Val404Ile | p.V404I | Q6ZNC8 | protein_coding | tolerated(0.43) | benign(0.009) | TCGA-AA-A010-01 | Colorectum | colon adenocarcinoma | Female | <65 | I/II | Chemotherapy | folinic | CR |
| MBOAT1 | SNV | Missense_Mutation | c.242G>A | p.Gly81Asp | p.G81D | Q6ZNC8 | protein_coding | deleterious(0) | probably_damaging(0.999) | TCGA-G4-6628-01 | Colorectum | colon adenocarcinoma | Male | >=65 | I/II | Unknown | Unknown | SD | |
| MBOAT1 | deletion | Frame_Shift_Del | c.1331delN | p.Leu444TrpfsTer20 | p.L444Wfs*20 | Q6ZNC8 | protein_coding | TCGA-AA-3663-01 | Colorectum | colon adenocarcinoma | Male | <65 | I/II | Unknown | Unknown | SD | |||
| MBOAT1 | insertion | Frame_Shift_Ins | novel | c.213_214insT | p.Gly72TrpfsTer31 | p.G72Wfs*31 | Q6ZNC8 | protein_coding | TCGA-AA-3947-01 | Colorectum | colon adenocarcinoma | Female | <65 | I/II | Unknown | Unknown | SD | ||
| MBOAT1 | deletion | Frame_Shift_Del | c.108delN | p.Phe36LeufsTer57 | p.F36Lfs*57 | Q6ZNC8 | protein_coding | TCGA-AG-A00Y-01 | Colorectum | rectum adenocarcinoma | Male | >=65 | I/II | Unknown | Unknown | PD |
| Page: 1 2 3 4 5 6 7 |
Top |
Related drugs of malignant transformation related genes |
| Identification of chemicals and drugs interact with genes involved in malignant transfromation |
| (DGIdb 4.0) |
| Entrez ID | Symbol | Category | Interaction Types | Drug Claim Name | Drug Name | PMIDs |
| Page: 1 |

Copyright 2023-Present -The University of Texas Health Science Center at Houston |