
|
|||||
|
 | |
| |
| |
| |
| |
| |
|
Gene: MBNL2 |
Gene summary for MBNL2 |
| Gene information | Species | Human | Gene symbol | MBNL2 | Gene ID | 10150 |
| Gene name | muscleblind like splicing regulator 2 | |
| Gene Alias | MBLL | |
| Cytomap | 13q32.1 | |
| Gene Type | protein-coding | GO ID | GO:0000375 | UniProtAcc | Q5VZF2 |
Top |
Malignant transformation analysis |
| Identification of the aberrant gene expression in precancerous and cancerous lesions by comparing the gene expression of stem-like cells in diseased tissues with normal stem cells |
| Entrez ID | Symbol | Replicates | Species | Organ | Tissue | Adj P-value | Log2FC | Malignancy |
| 10150 | MBNL2 | CCI_2 | Human | Cervix | CC | 1.15e-14 | 1.81e+00 | 0.5249 |
| 10150 | MBNL2 | CCI_3 | Human | Cervix | CC | 1.37e-02 | 5.11e-01 | 0.516 |
| 10150 | MBNL2 | HTA11_3410_2000001011 | Human | Colorectum | AD | 3.83e-14 | -4.44e-01 | 0.0155 |
| 10150 | MBNL2 | HTA11_99999965104_69814 | Human | Colorectum | MSS | 1.63e-10 | 8.70e-01 | 0.281 |
| 10150 | MBNL2 | HTA11_99999971662_82457 | Human | Colorectum | MSS | 9.69e-07 | 7.42e-01 | 0.3859 |
| 10150 | MBNL2 | HTA11_99999973899_84307 | Human | Colorectum | MSS | 1.52e-03 | -4.77e-01 | 0.2585 |
| 10150 | MBNL2 | HTA11_99999974143_84620 | Human | Colorectum | MSS | 1.11e-08 | -4.71e-01 | 0.3005 |
| 10150 | MBNL2 | F007 | Human | Colorectum | FAP | 1.68e-02 | 1.58e-01 | 0.1176 |
| 10150 | MBNL2 | A015-C-203 | Human | Colorectum | FAP | 4.37e-28 | -4.01e-01 | -0.1294 |
| 10150 | MBNL2 | A015-C-204 | Human | Colorectum | FAP | 5.13e-05 | -2.23e-01 | -0.0228 |
| 10150 | MBNL2 | A014-C-040 | Human | Colorectum | FAP | 2.33e-03 | -4.35e-02 | -0.1184 |
| 10150 | MBNL2 | A002-C-201 | Human | Colorectum | FAP | 1.43e-13 | -3.38e-01 | 0.0324 |
| 10150 | MBNL2 | A002-C-203 | Human | Colorectum | FAP | 1.87e-04 | -5.12e-02 | 0.2786 |
| 10150 | MBNL2 | A001-C-119 | Human | Colorectum | FAP | 4.07e-08 | -4.31e-01 | -0.1557 |
| 10150 | MBNL2 | A001-C-108 | Human | Colorectum | FAP | 1.48e-18 | -2.90e-01 | -0.0272 |
| 10150 | MBNL2 | A002-C-205 | Human | Colorectum | FAP | 2.83e-21 | -3.87e-01 | -0.1236 |
| 10150 | MBNL2 | A015-C-006 | Human | Colorectum | FAP | 3.74e-16 | -4.33e-01 | -0.0994 |
| 10150 | MBNL2 | A015-C-106 | Human | Colorectum | FAP | 8.43e-12 | -1.73e-01 | -0.0511 |
| 10150 | MBNL2 | A002-C-114 | Human | Colorectum | FAP | 2.18e-20 | -4.33e-01 | -0.1561 |
| 10150 | MBNL2 | A015-C-104 | Human | Colorectum | FAP | 4.96e-33 | -4.61e-01 | -0.1899 |
| Page: 1 2 3 4 5 6 7 8 9 10 11 |
| Tissue | Expression Dynamics | Abbreviation |
| Cervix | 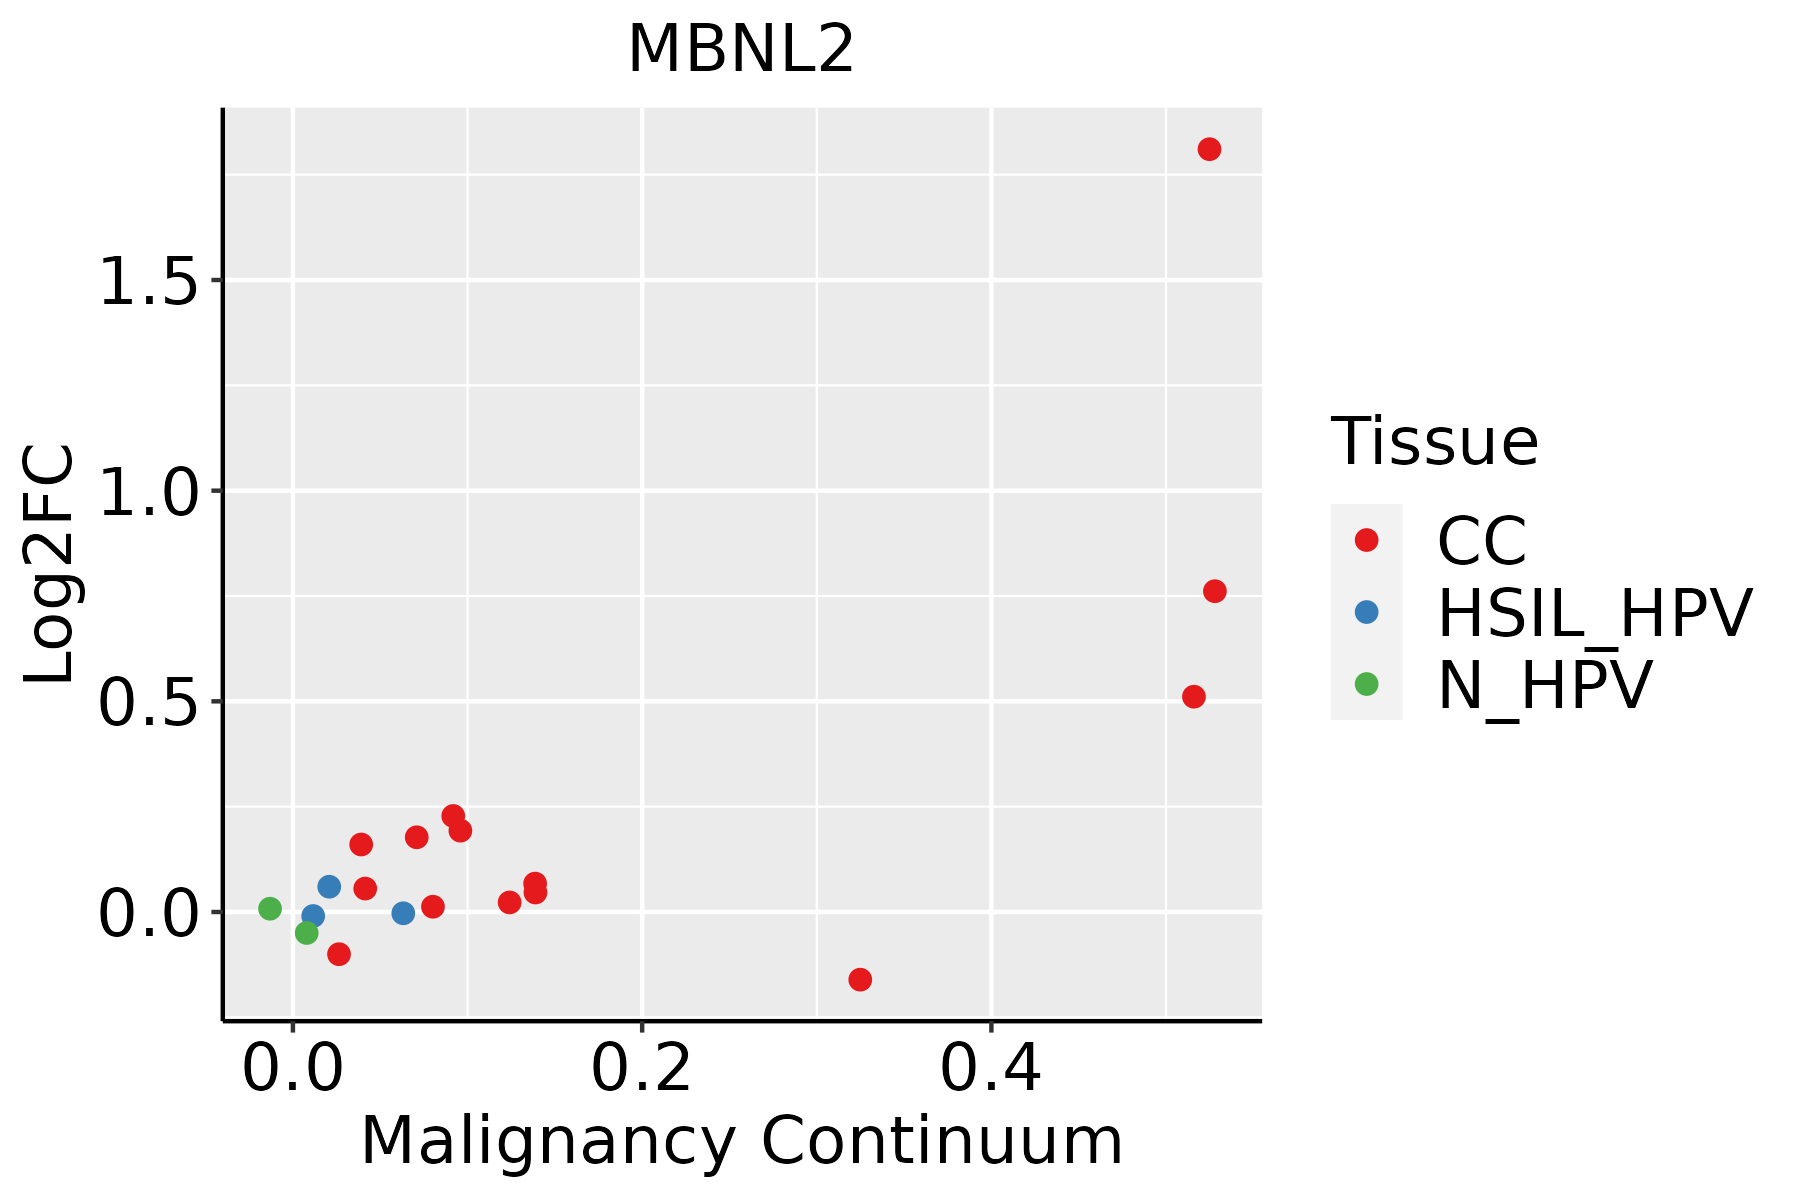 | CC: Cervix cancer |
| HSIL_HPV: HPV-infected high-grade squamous intraepithelial lesions | ||
| N_HPV: HPV-infected normal cervix | ||
| Colorectum (GSE201348) |  | FAP: Familial adenomatous polyposis |
| CRC: Colorectal cancer | ||
| Colorectum (HTA11) | 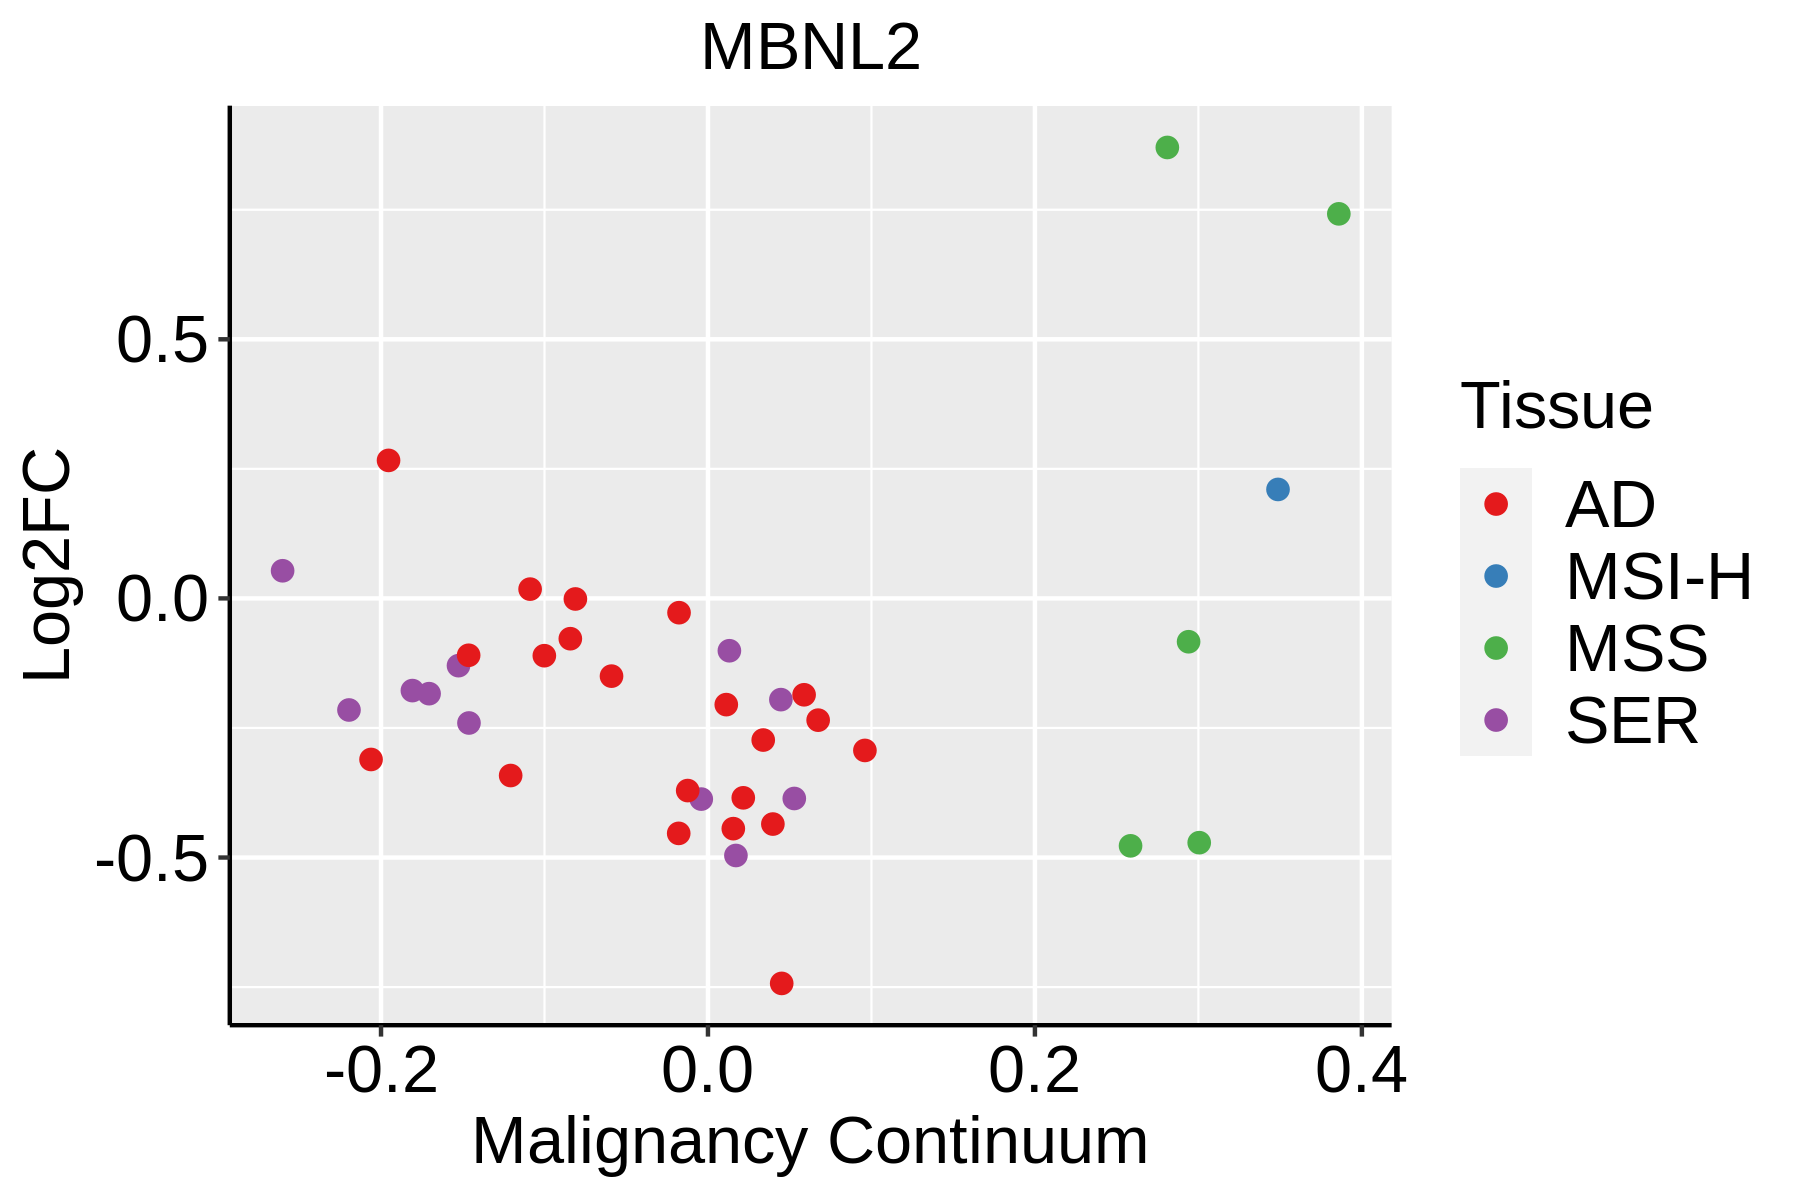 | AD: Adenomas |
| SER: Sessile serrated lesions | ||
| MSI-H: Microsatellite-high colorectal cancer | ||
| MSS: Microsatellite stable colorectal cancer | ||
| Esophagus | 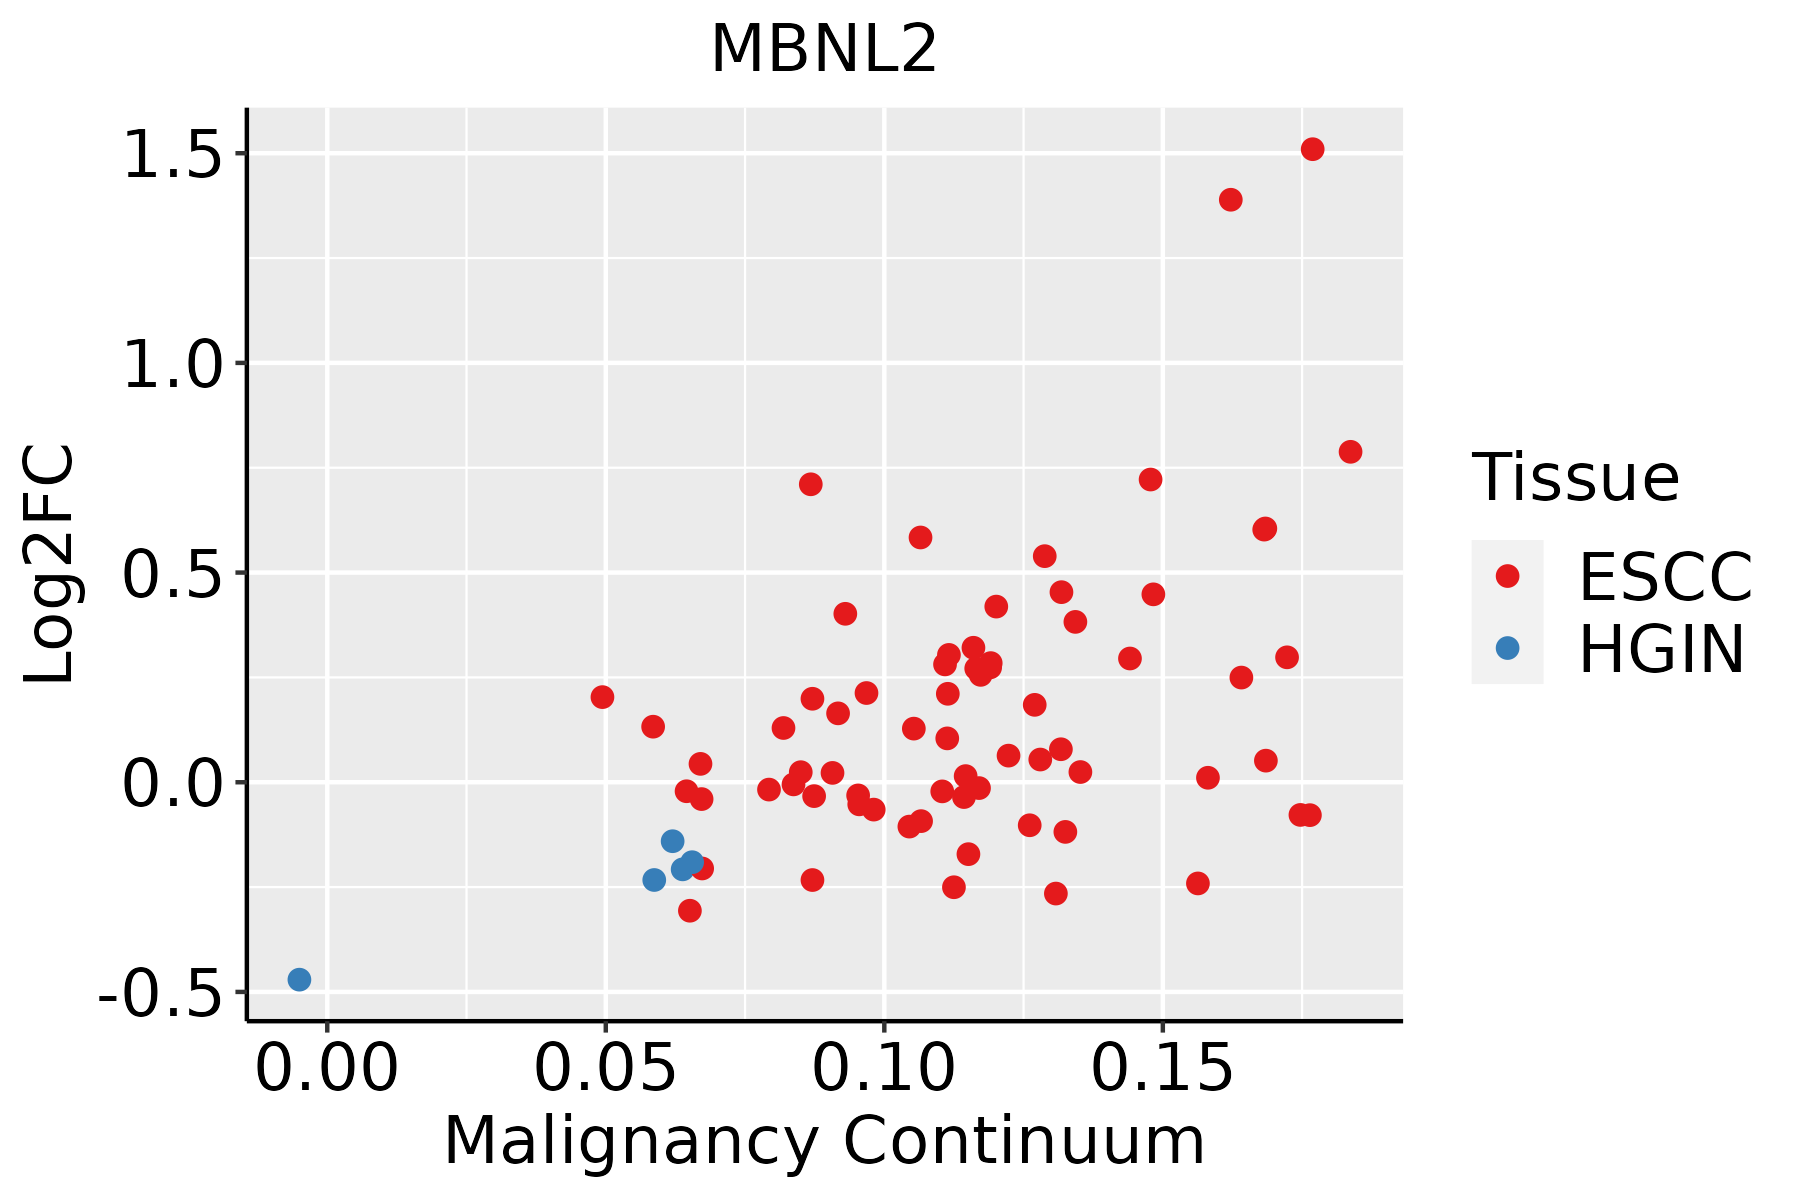 | ESCC: Esophageal squamous cell carcinoma |
| HGIN: High-grade intraepithelial neoplasias | ||
| LGIN: Low-grade intraepithelial neoplasias | ||
| Liver |  | HCC: Hepatocellular carcinoma |
| NAFLD: Non-alcoholic fatty liver disease | ||
| Lung | 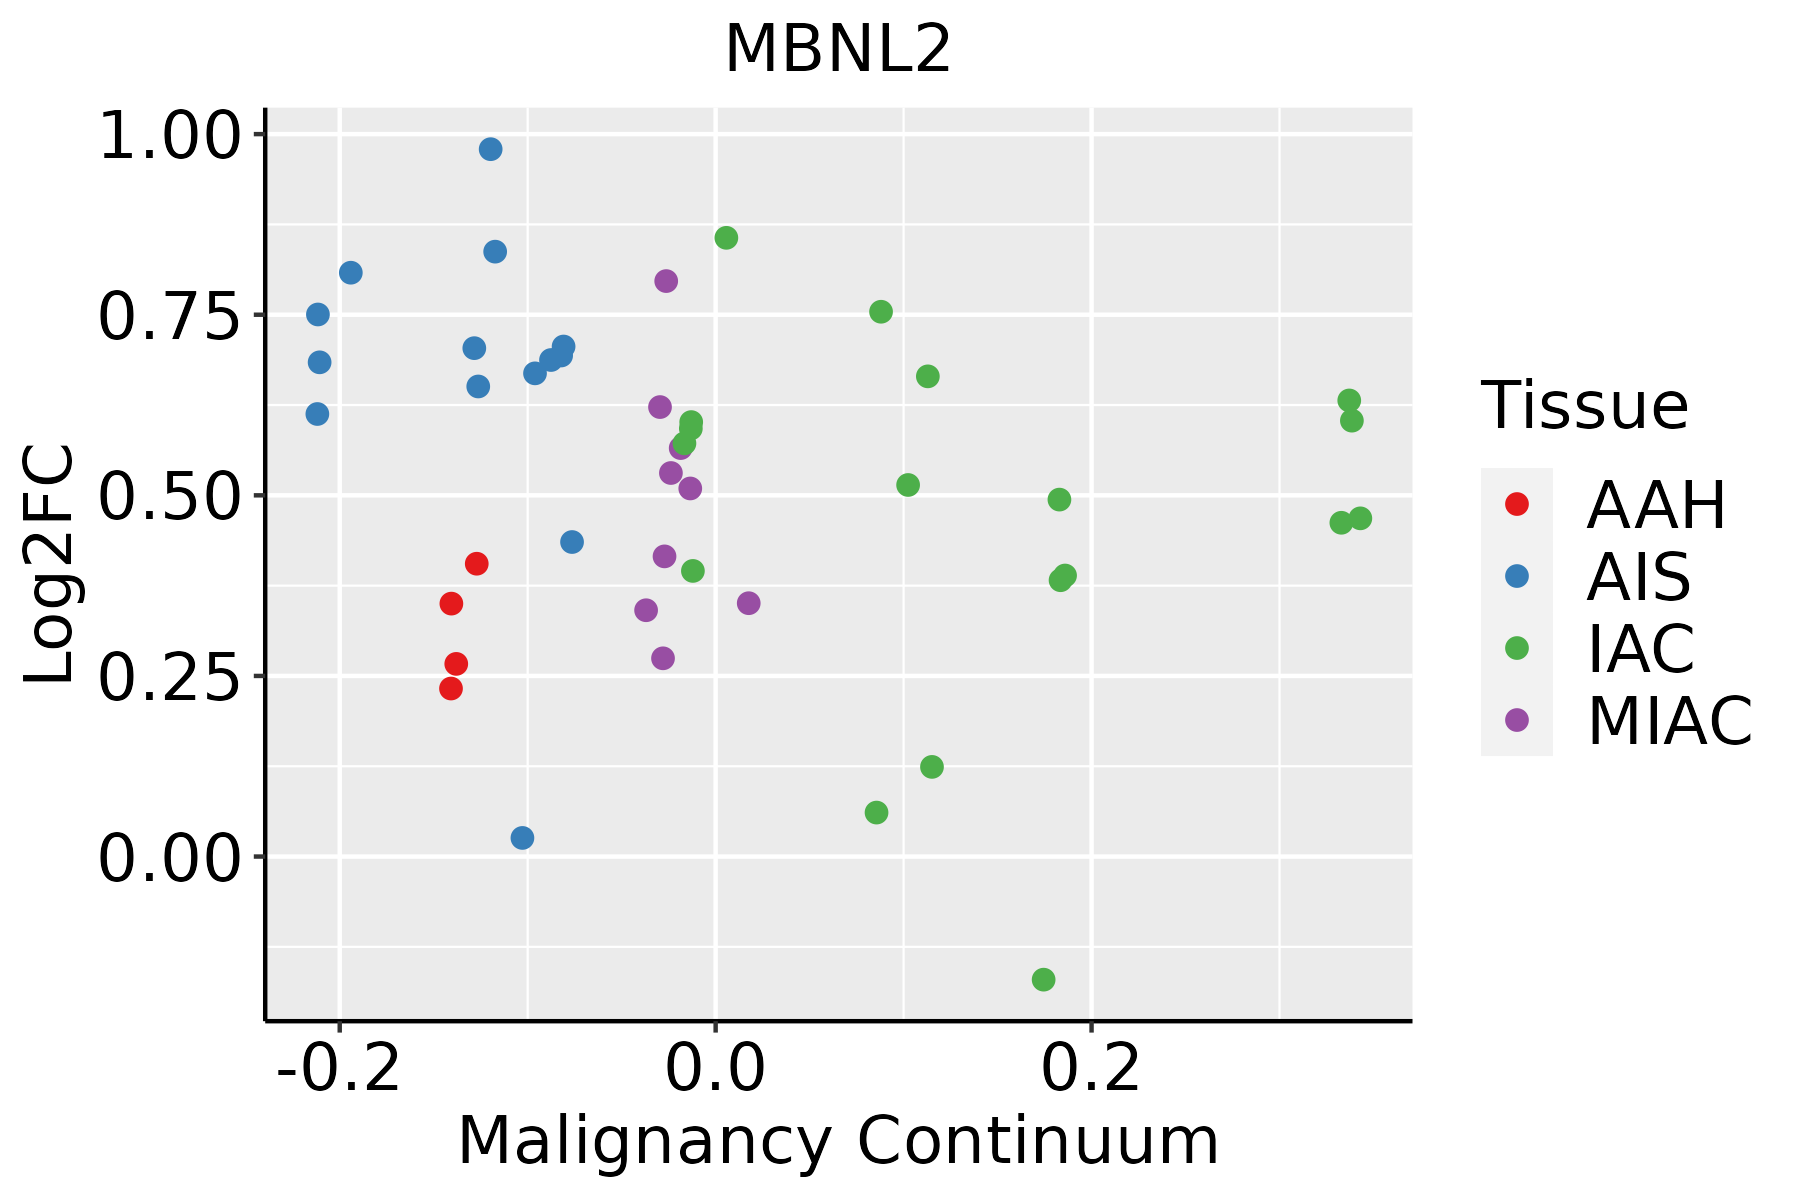 | AAH: Atypical adenomatous hyperplasia |
| AIS: Adenocarcinoma in situ | ||
| IAC: Invasive lung adenocarcinoma | ||
| MIA: Minimally invasive adenocarcinoma | ||
| Oral Cavity | 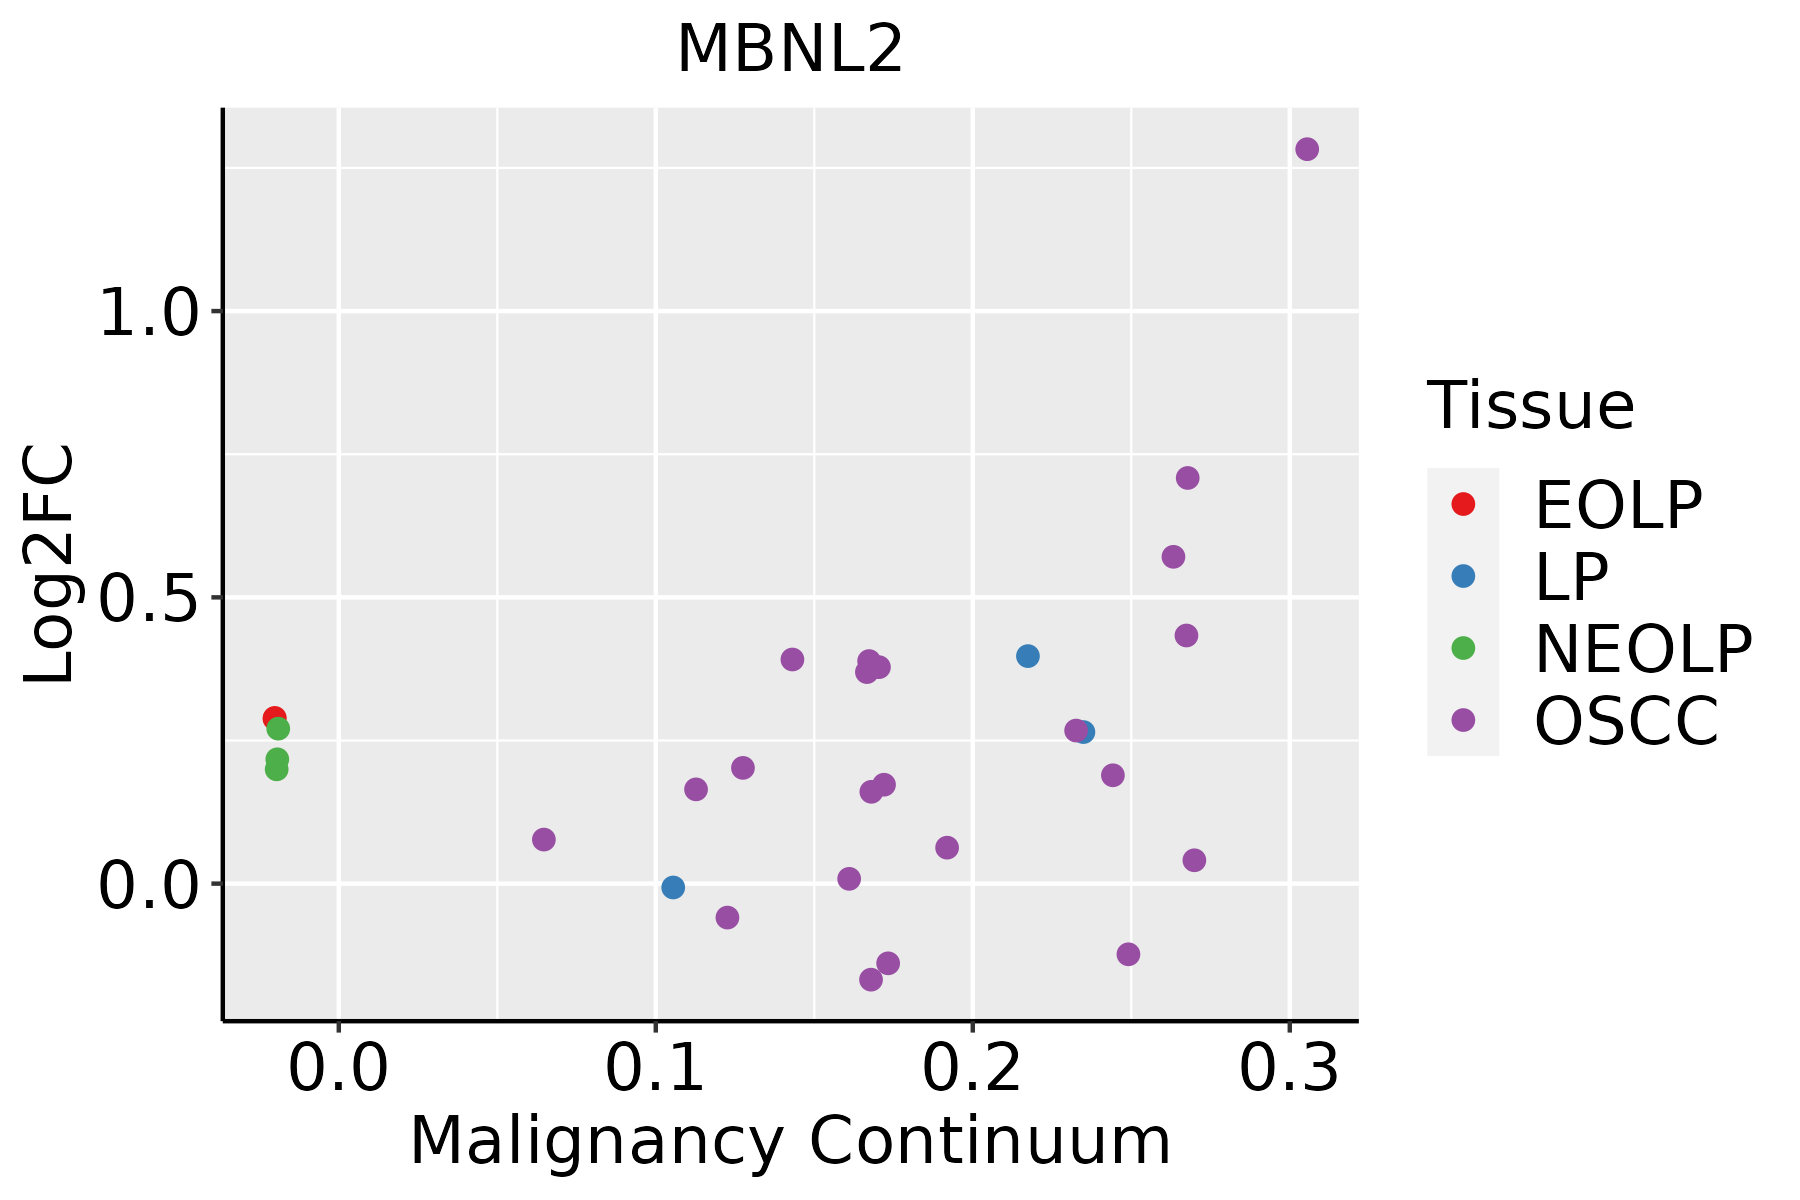 | EOLP: Erosive Oral lichen planus |
| LP: leukoplakia | ||
| NEOLP: Non-erosive oral lichen planus | ||
| OSCC: Oral squamous cell carcinoma | ||
| Prostate | 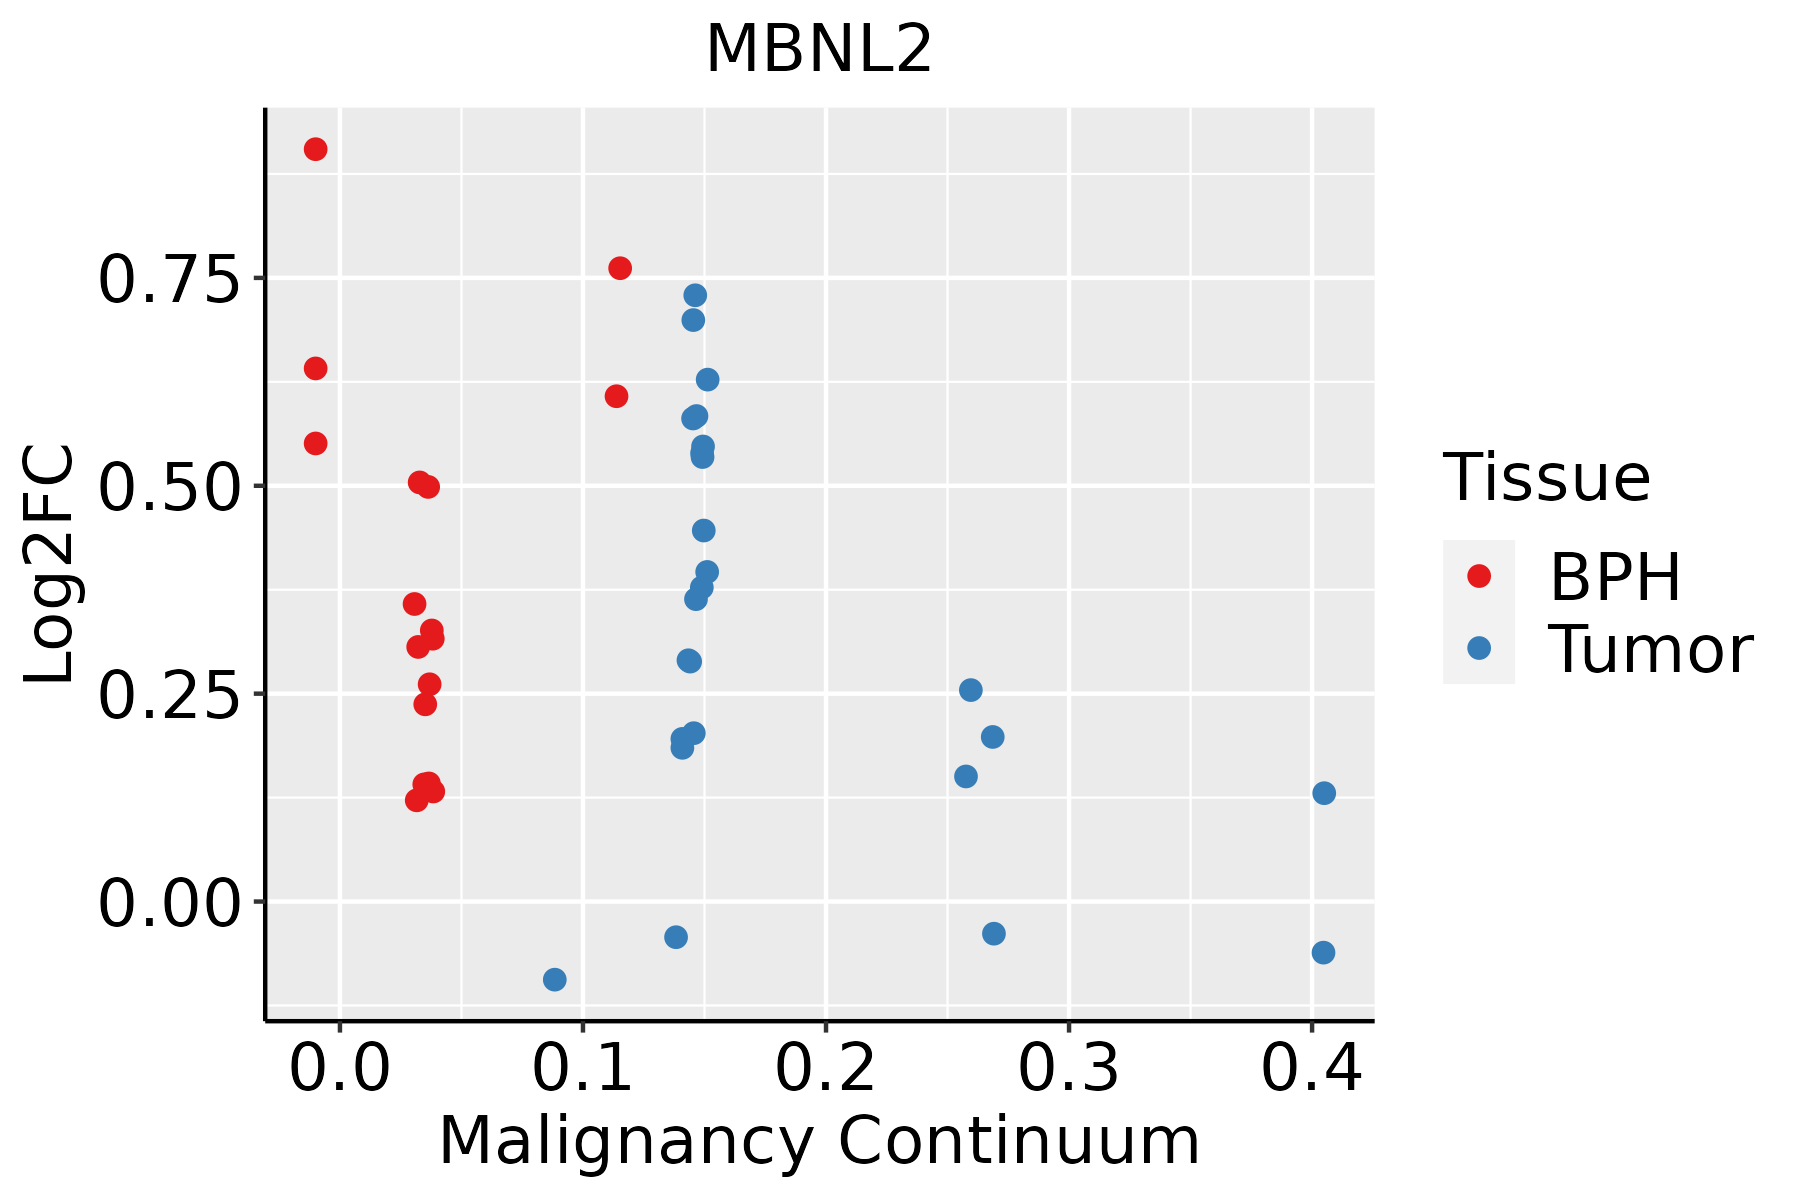 | BPH: Benign Prostatic Hyperplasia |
| Skin | 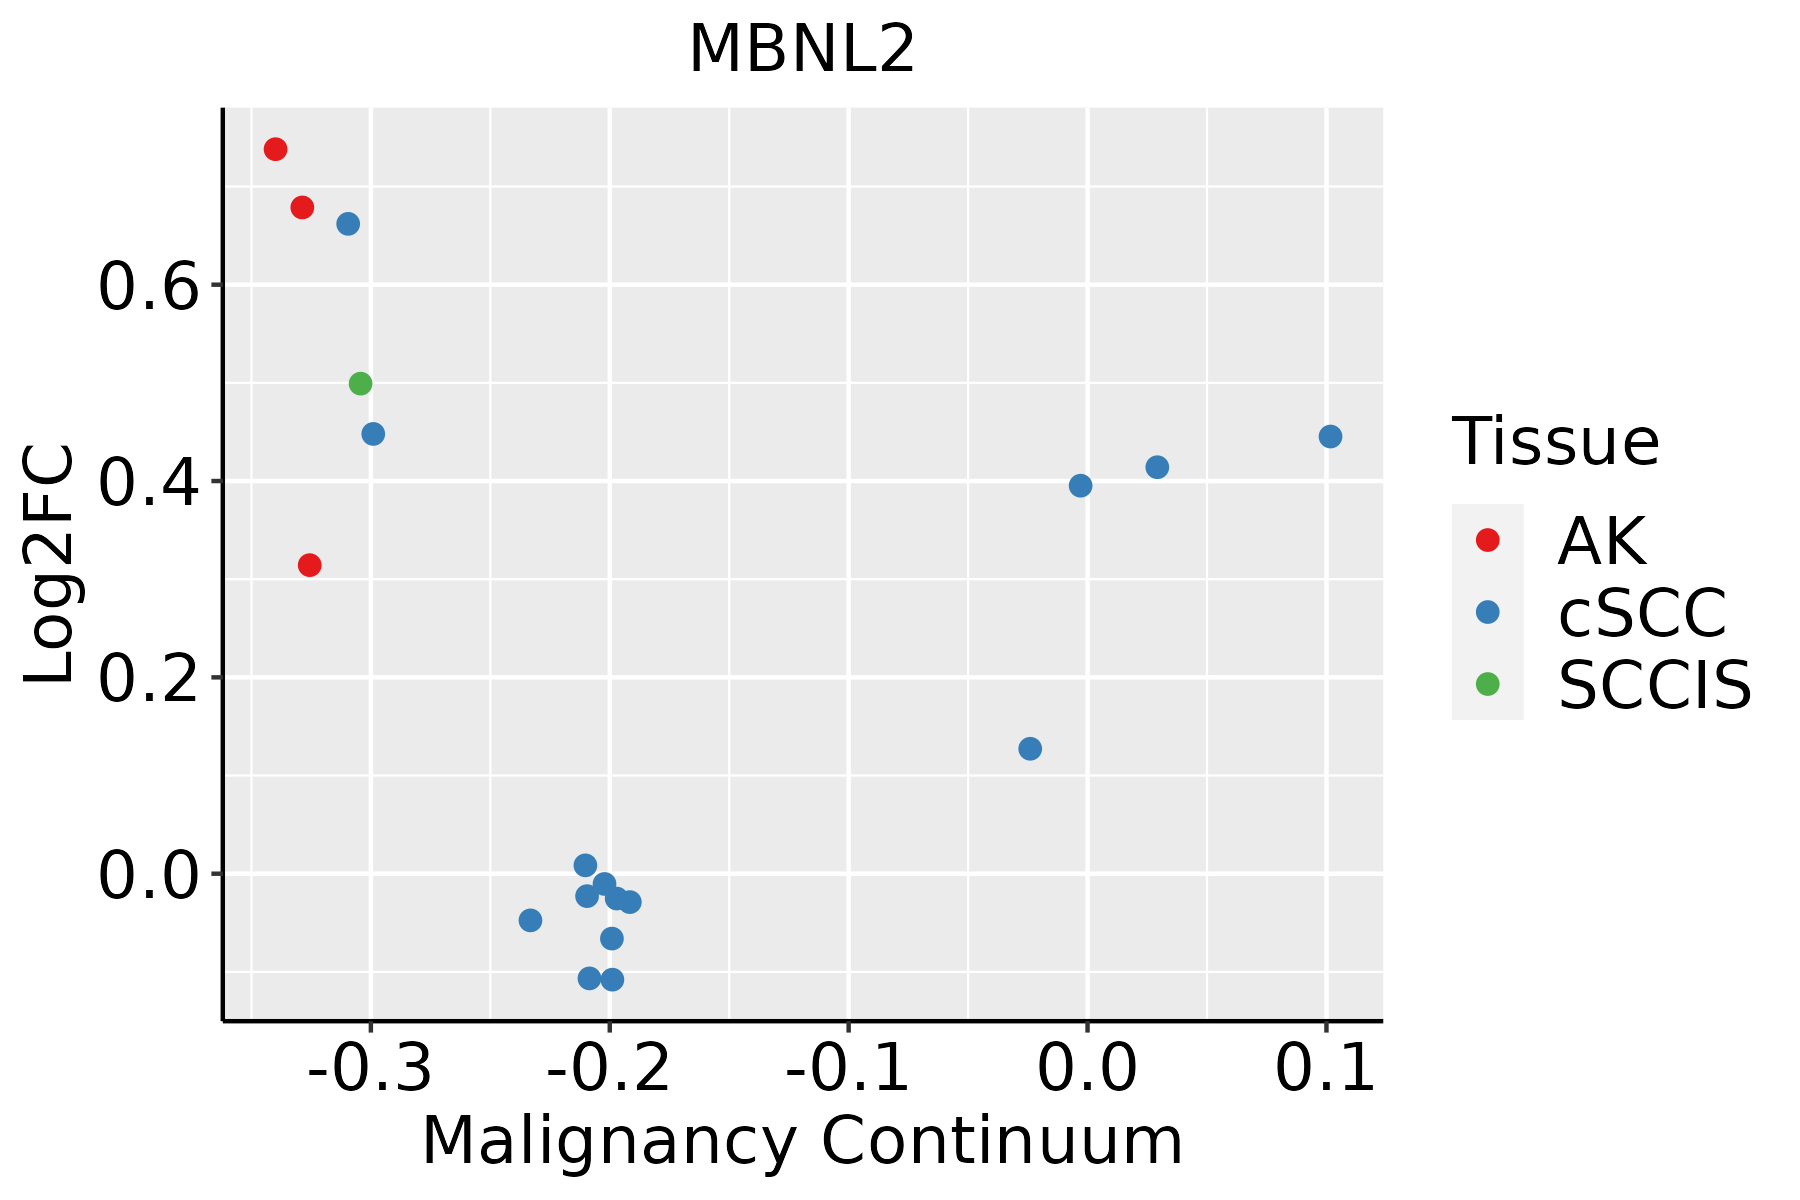 | AK: Actinic keratosis |
| cSCC: Cutaneous squamous cell carcinoma | ||
| SCCIS:squamous cell carcinoma in situ | ||
| Thyroid | 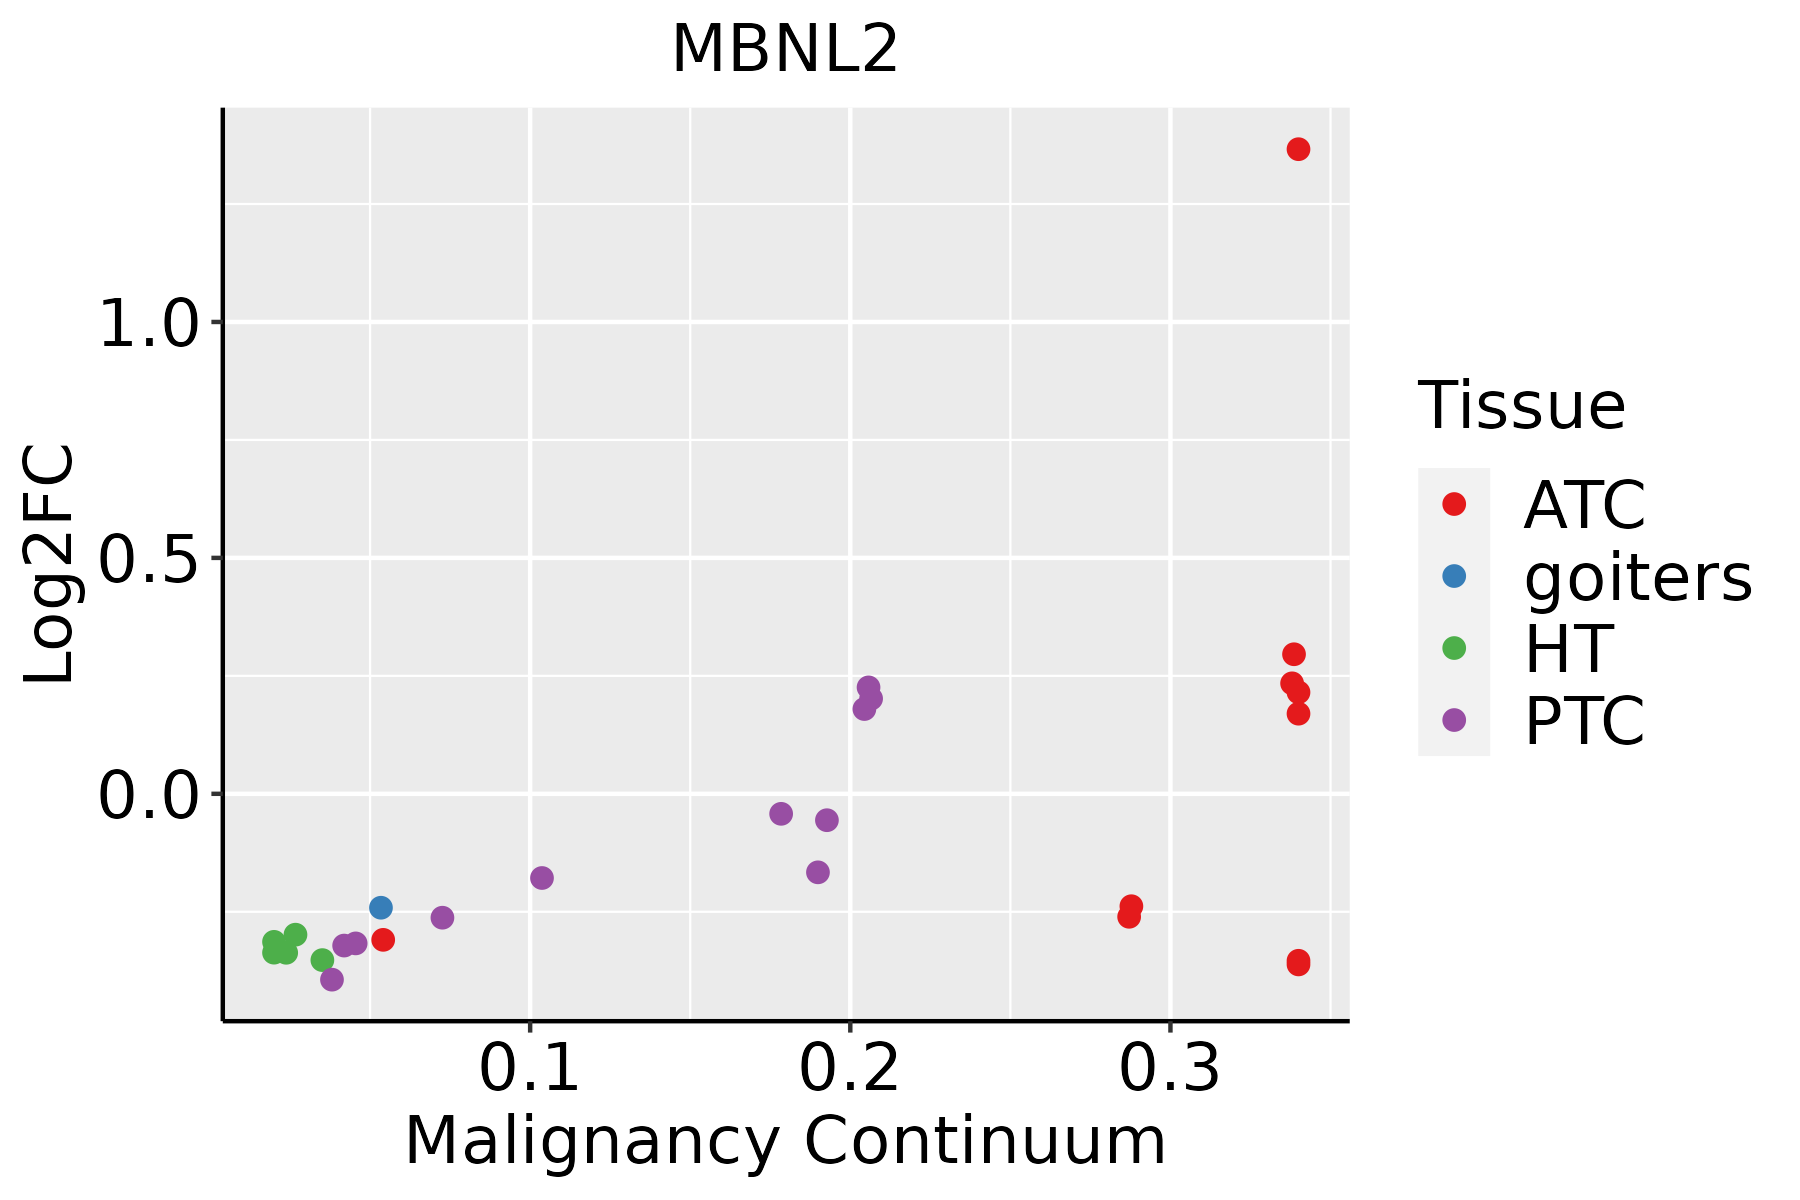 | ATC: Anaplastic thyroid cancer |
| HT: Hashimoto's thyroiditis | ||
| PTC: Papillary thyroid cancer |
| ∗log2FC in expression of this searched gene in stem-like cells from each diseased tissue sample relative to stem-like cells in normal samples in each tissue plotted against the malignancy continuum. Samples are colored based on if they are from different disease stage. |
Top |
Malignant transformation related pathway analysis |
| Find out the enriched GO biological processes and KEGG pathways involved in transition from healthy to precancer to cancer |
| Tissue | Disease Stage | Enriched GO biological Processes |
| Colorectum | AD |  |
| Colorectum | SER |  |
| Colorectum | MSS |  |
| Colorectum | MSI-H |  |
| Colorectum | FAP |  |
| ∗Top 15 enriched GO BP terms are showed in the bar plot of each disease state in each tissue. Each row represents a significant GO biological process which is colored according to the -log10(p.adjust). |
| Page: 1 2 3 4 5 6 7 8 9 |
| GO ID | Tissue | Disease Stage | Description | Gene Ratio | Bg Ratio | pvalue | p.adjust | Count |
| GO:004348410 | Cervix | CC | regulation of RNA splicing | 42/2311 | 148/18723 | 1.25e-07 | 6.24e-06 | 42 |
| GO:19033119 | Cervix | CC | regulation of mRNA metabolic process | 64/2311 | 288/18723 | 1.71e-06 | 5.64e-05 | 64 |
| GO:004802410 | Cervix | CC | regulation of mRNA splicing, via spliceosome | 28/2311 | 101/18723 | 2.41e-05 | 4.19e-04 | 28 |
| GO:00506849 | Cervix | CC | regulation of mRNA processing | 33/2311 | 137/18723 | 1.06e-04 | 1.35e-03 | 33 |
| GO:000838010 | Cervix | CC | RNA splicing | 76/2311 | 434/18723 | 9.79e-04 | 8.19e-03 | 76 |
| GO:000037710 | Cervix | CC | RNA splicing, via transesterification reactions with bulged adenosine as nucleophile | 55/2311 | 320/18723 | 6.71e-03 | 3.70e-02 | 55 |
| GO:000039810 | Cervix | CC | mRNA splicing, via spliceosome | 55/2311 | 320/18723 | 6.71e-03 | 3.70e-02 | 55 |
| GO:000037510 | Cervix | CC | RNA splicing, via transesterification reactions | 55/2311 | 324/18723 | 8.61e-03 | 4.44e-02 | 55 |
| GO:0008380 | Colorectum | AD | RNA splicing | 169/3918 | 434/18723 | 3.59e-18 | 2.04e-15 | 169 |
| GO:0000377 | Colorectum | AD | RNA splicing, via transesterification reactions with bulged adenosine as nucleophile | 130/3918 | 320/18723 | 5.88e-16 | 2.16e-13 | 130 |
| GO:0000398 | Colorectum | AD | mRNA splicing, via spliceosome | 130/3918 | 320/18723 | 5.88e-16 | 2.16e-13 | 130 |
| GO:0000375 | Colorectum | AD | RNA splicing, via transesterification reactions | 131/3918 | 324/18723 | 7.11e-16 | 2.22e-13 | 131 |
| GO:1903311 | Colorectum | AD | regulation of mRNA metabolic process | 117/3918 | 288/18723 | 1.69e-14 | 4.23e-12 | 117 |
| GO:0043484 | Colorectum | AD | regulation of RNA splicing | 70/3918 | 148/18723 | 6.47e-13 | 1.16e-10 | 70 |
| GO:0048024 | Colorectum | AD | regulation of mRNA splicing, via spliceosome | 50/3918 | 101/18723 | 1.62e-10 | 1.56e-08 | 50 |
| GO:0050684 | Colorectum | AD | regulation of mRNA processing | 61/3918 | 137/18723 | 4.23e-10 | 3.58e-08 | 61 |
| GO:0000380 | Colorectum | AD | alternative mRNA splicing, via spliceosome | 33/3918 | 77/18723 | 1.13e-05 | 2.55e-04 | 33 |
| GO:0000381 | Colorectum | AD | regulation of alternative mRNA splicing, via spliceosome | 27/3918 | 60/18723 | 2.41e-05 | 4.66e-04 | 27 |
| GO:00083802 | Colorectum | MSS | RNA splicing | 159/3467 | 434/18723 | 1.75e-19 | 1.22e-16 | 159 |
| GO:19033112 | Colorectum | MSS | regulation of mRNA metabolic process | 115/3467 | 288/18723 | 1.23e-17 | 6.41e-15 | 115 |
| Page: 1 2 3 4 5 6 7 8 9 10 11 12 |
| Pathway ID | Tissue | Disease Stage | Description | Gene Ratio | Bg Ratio | pvalue | p.adjust | qvalue | Count |
| Page: 1 |
Top |
Cell-cell communication analysis |
| Identification of potential cell-cell interactions between two cell types and their ligand-receptor pairs for different disease states |
| Ligand | Receptor | LRpair | Pathway | Tissue | Disease Stage |
| Page: 1 |
Top |
Single-cell gene regulatory network inference analysis |
| Find out the significant the regulons (TFs) and the target genes of each regulon across cell types for different disease states |
| TF | Cell Type | Tissue | Disease Stage | Target Gene | RSS | Regulon Activity |
| ∗The dot plots of a searched regulon are shown for all cell subpopulations in each disease state of each tissue based on the regulon specific score inferred using pySCENIC and by calculating the average expression. |
| Page: 1 |
Top |
Somatic mutation of malignant transformation related genes |
| Annotation of somatic variants for genes involved in malignant transformation |
| Hugo Symbol | Variant Class | Variant Classification | dbSNP RS | HGVSc | HGVSp | HGVSp Short | SWISSPROT | BIOTYPE | SIFT | PolyPhen | Tumor Sample Barcode | Tissue | Histology | Sex | Age | Stage | Therapy Types | Drugs | Outcome |
| MBNL2 | SNV | Missense_Mutation | rs575403433 | c.482N>T | p.Pro161Leu | p.P161L | Q5VZF2 | protein_coding | tolerated(0.3) | benign(0.243) | TCGA-AC-A3TM-01 | Breast | breast invasive carcinoma | Female | <65 | III/IV | Chemotherapy | cytoxan | CR |
| MBNL2 | SNV | Missense_Mutation | c.652T>A | p.Cys218Ser | p.C218S | Q5VZF2 | protein_coding | deleterious(0) | probably_damaging(0.954) | TCGA-AR-A24M-01 | Breast | breast invasive carcinoma | Female | <65 | III/IV | Hormone Therapy | tamoxiphen | SD | |
| MBNL2 | SNV | Missense_Mutation | c.95N>C | p.Glu32Ala | p.E32A | Q5VZF2 | protein_coding | tolerated(0.82) | benign(0.007) | TCGA-E2-A14R-01 | Breast | breast invasive carcinoma | Female | <65 | I/II | Chemotherapy | doxorubicin | PD | |
| MBNL2 | SNV | Missense_Mutation | novel | c.280G>T | p.Ala94Ser | p.A94S | Q5VZF2 | protein_coding | tolerated(0.13) | benign(0.131) | TCGA-E9-A1N8-01 | Breast | breast invasive carcinoma | Female | <65 | I/II | Chemotherapy | doxorubicin | SD |
| MBNL2 | SNV | Missense_Mutation | novel | c.577N>A | p.Gly193Arg | p.G193R | Q5VZF2 | protein_coding | deleterious(0.04) | possibly_damaging(0.649) | TCGA-PL-A8LZ-01 | Breast | breast invasive carcinoma | Female | <65 | III/IV | Chemotherapy | paclitaxel | SD |
| MBNL2 | SNV | Missense_Mutation | rs754344124 | c.377C>T | p.Thr126Met | p.T126M | Q5VZF2 | protein_coding | deleterious(0.04) | benign(0.177) | TCGA-2W-A8YY-01 | Cervix | cervical & endocervical cancer | Female | <65 | I/II | Chemotherapy | cisplatin | CR |
| MBNL2 | SNV | Missense_Mutation | rs754344124 | c.377N>T | p.Thr126Met | p.T126M | Q5VZF2 | protein_coding | deleterious(0.04) | benign(0.177) | TCGA-EA-A410-01 | Cervix | cervical & endocervical cancer | Female | <65 | I/II | Unknown | Unknown | SD |
| MBNL2 | SNV | Missense_Mutation | c.404N>T | p.Ala135Val | p.A135V | Q5VZF2 | protein_coding | tolerated(0.37) | benign(0.007) | TCGA-Q1-A5R3-01 | Cervix | cervical & endocervical cancer | Female | <65 | I/II | Chemotherapy | cisplatin | PR | |
| MBNL2 | SNV | Missense_Mutation | novel | c.97G>A | p.Glu33Lys | p.E33K | Q5VZF2 | protein_coding | deleterious(0) | probably_damaging(0.947) | TCGA-AA-3984-01 | Colorectum | colon adenocarcinoma | Female | <65 | I/II | Unknown | Unknown | SD |
| MBNL2 | SNV | Missense_Mutation | c.660N>A | p.Asp220Glu | p.D220E | Q5VZF2 | protein_coding | deleterious(0) | possibly_damaging(0.83) | TCGA-AA-A01R-01 | Colorectum | colon adenocarcinoma | Male | <65 | III/IV | Chemotherapy | 5-fluorouracil | PD |
| Page: 1 2 3 4 5 6 |
Top |
Related drugs of malignant transformation related genes |
| Identification of chemicals and drugs interact with genes involved in malignant transfromation |
| (DGIdb 4.0) |
| Entrez ID | Symbol | Category | Interaction Types | Drug Claim Name | Drug Name | PMIDs |
| Page: 1 |

Copyright 2023-Present -The University of Texas Health Science Center at Houston |