
|
|||||
|
 | |
| |
| |
| |
| |
| |
|
Gene: MBL2 |
Gene summary for MBL2 |
| Gene information | Species | Human | Gene symbol | MBL2 | Gene ID | 4153 |
| Gene name | mannose binding lectin 2 | |
| Gene Alias | COLEC1 | |
| Cytomap | 10q21.1 | |
| Gene Type | protein-coding | GO ID | GO:0001867 | UniProtAcc | P11226 |
Top |
Malignant transformation analysis |
| Identification of the aberrant gene expression in precancerous and cancerous lesions by comparing the gene expression of stem-like cells in diseased tissues with normal stem cells |
| Entrez ID | Symbol | Replicates | Species | Organ | Tissue | Adj P-value | Log2FC | Malignancy |
| 4153 | MBL2 | HCC1_Meng | Human | Liver | HCC | 1.37e-31 | 9.56e-02 | 0.0246 |
| 4153 | MBL2 | S027 | Human | Liver | HCC | 2.35e-07 | 7.26e-01 | 0.2446 |
| 4153 | MBL2 | S028 | Human | Liver | HCC | 6.74e-25 | 1.20e+00 | 0.2503 |
| 4153 | MBL2 | S029 | Human | Liver | HCC | 2.41e-30 | 1.24e+00 | 0.2581 |
| Page: 1 |
| Tissue | Expression Dynamics | Abbreviation |
| Liver | 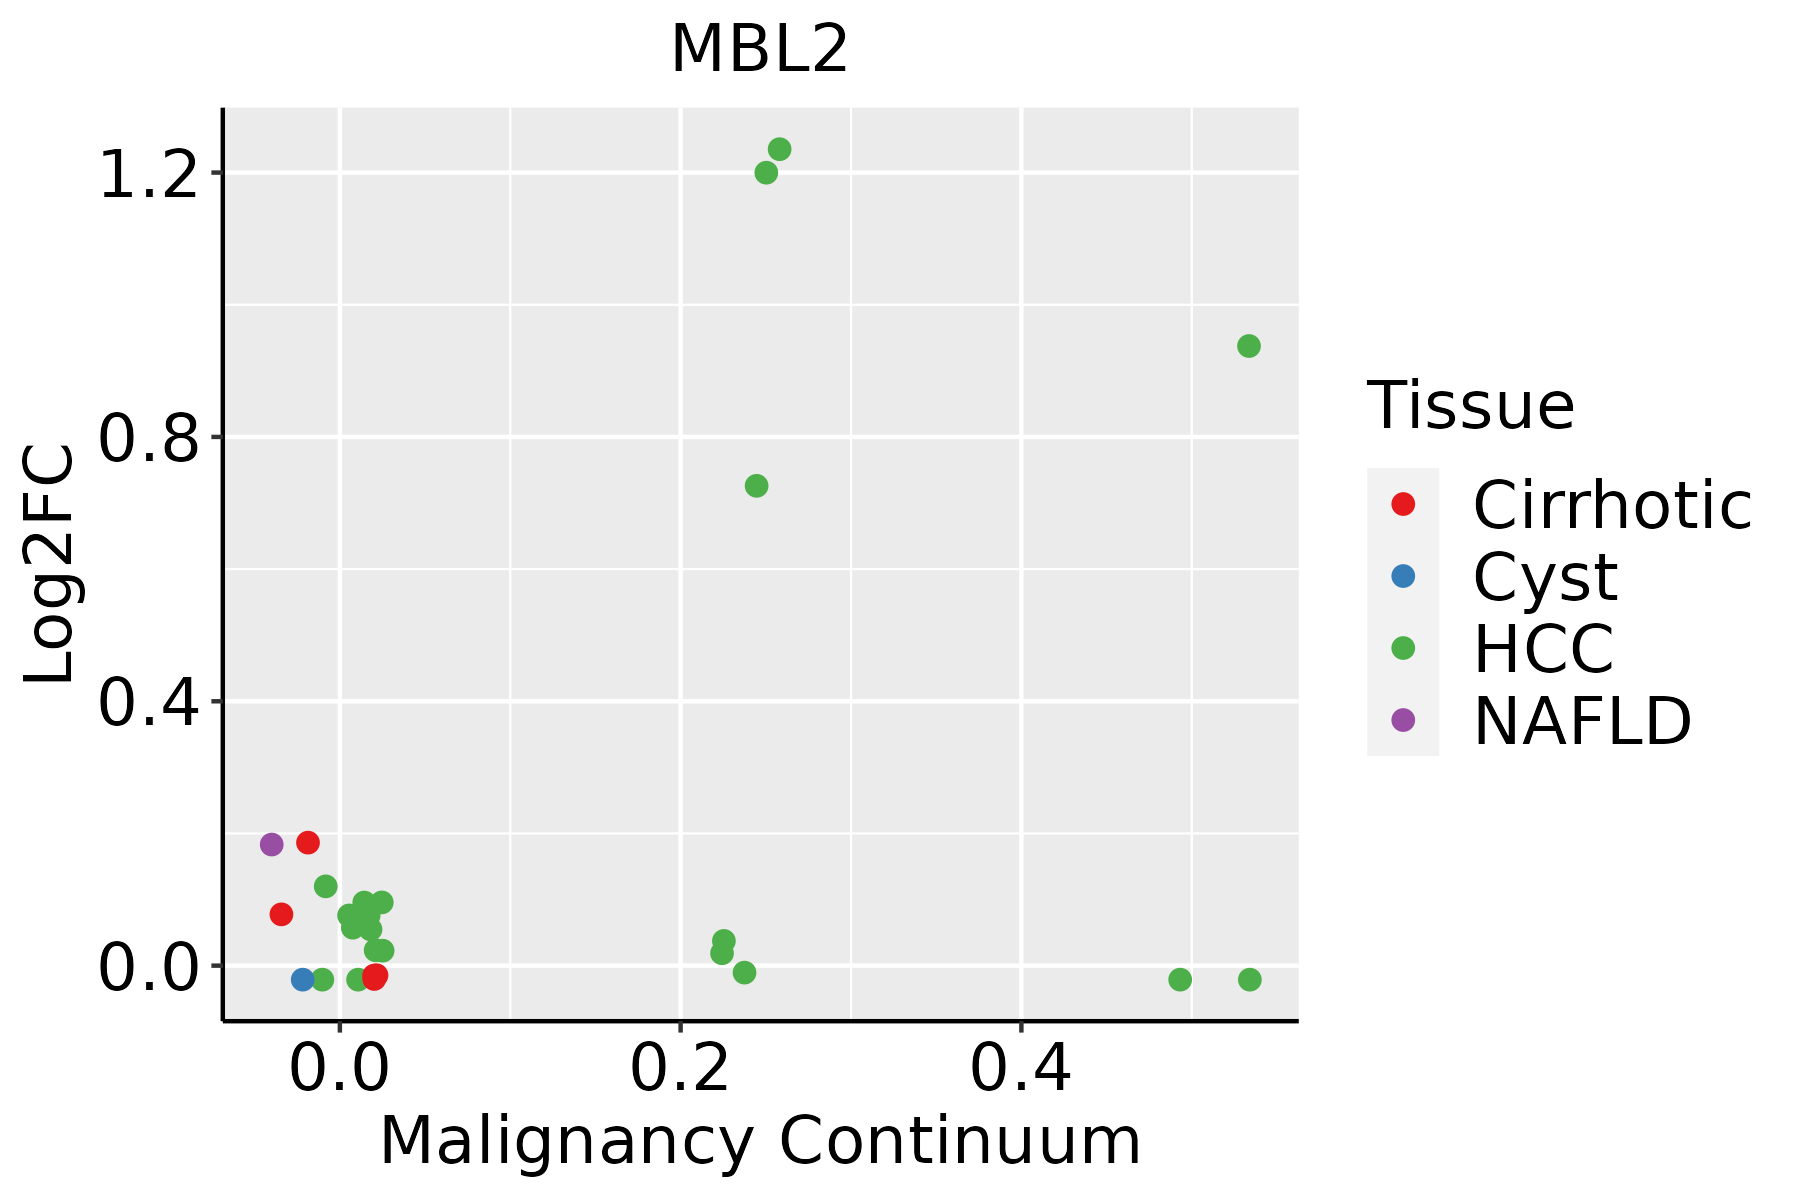 | HCC: Hepatocellular carcinoma |
| NAFLD: Non-alcoholic fatty liver disease |
| ∗log2FC in expression of this searched gene in stem-like cells from each diseased tissue sample relative to stem-like cells in normal samples in each tissue plotted against the malignancy continuum. Samples are colored based on if they are from different disease stage. |
Top |
Malignant transformation related pathway analysis |
| Find out the enriched GO biological processes and KEGG pathways involved in transition from healthy to precancer to cancer |
| Tissue | Disease Stage | Enriched GO biological Processes |
| Colorectum | AD |  |
| Colorectum | SER |  |
| Colorectum | MSS |  |
| Colorectum | MSI-H |  |
| Colorectum | FAP |  |
| ∗Top 15 enriched GO BP terms are showed in the bar plot of each disease state in each tissue. Each row represents a significant GO biological process which is colored according to the -log10(p.adjust). |
| Page: 1 2 3 4 5 6 7 8 9 |
| GO ID | Tissue | Disease Stage | Description | Gene Ratio | Bg Ratio | pvalue | p.adjust | Count |
| GO:001603222 | Liver | HCC | viral process | 286/7958 | 415/18723 | 4.41e-28 | 1.86e-25 | 286 |
| GO:000697922 | Liver | HCC | response to oxidative stress | 281/7958 | 446/18723 | 9.75e-19 | 1.24e-16 | 281 |
| GO:005079212 | Liver | HCC | regulation of viral process | 109/7958 | 164/18723 | 4.52e-10 | 1.45e-08 | 109 |
| GO:004852511 | Liver | HCC | negative regulation of viral process | 59/7958 | 92/18723 | 2.28e-05 | 2.41e-04 | 59 |
| GO:00025262 | Liver | HCC | acute inflammatory response | 62/7958 | 112/18723 | 4.06e-03 | 1.77e-02 | 62 |
| GO:00069532 | Liver | HCC | acute-phase response | 30/7958 | 49/18723 | 6.31e-03 | 2.57e-02 | 30 |
| Page: 1 |
| Pathway ID | Tissue | Disease Stage | Description | Gene Ratio | Bg Ratio | pvalue | p.adjust | qvalue | Count |
| hsa0517142 | Liver | HCC | Coronavirus disease - COVID-19 | 167/4020 | 232/8465 | 1.50e-14 | 4.19e-13 | 2.33e-13 | 167 |
| hsa046104 | Liver | HCC | Complement and coagulation cascades | 57/4020 | 86/8465 | 3.19e-04 | 1.45e-03 | 8.04e-04 | 57 |
| hsa0414521 | Liver | HCC | Phagosome | 93/4020 | 152/8465 | 4.27e-04 | 1.88e-03 | 1.05e-03 | 93 |
| hsa0517152 | Liver | HCC | Coronavirus disease - COVID-19 | 167/4020 | 232/8465 | 1.50e-14 | 4.19e-13 | 2.33e-13 | 167 |
| hsa046105 | Liver | HCC | Complement and coagulation cascades | 57/4020 | 86/8465 | 3.19e-04 | 1.45e-03 | 8.04e-04 | 57 |
| hsa0414531 | Liver | HCC | Phagosome | 93/4020 | 152/8465 | 4.27e-04 | 1.88e-03 | 1.05e-03 | 93 |
| Page: 1 |
Top |
Cell-cell communication analysis |
| Identification of potential cell-cell interactions between two cell types and their ligand-receptor pairs for different disease states |
| Ligand | Receptor | LRpair | Pathway | Tissue | Disease Stage |
| Page: 1 |
Top |
Single-cell gene regulatory network inference analysis |
| Find out the significant the regulons (TFs) and the target genes of each regulon across cell types for different disease states |
| TF | Cell Type | Tissue | Disease Stage | Target Gene | RSS | Regulon Activity |
| ∗The dot plots of a searched regulon are shown for all cell subpopulations in each disease state of each tissue based on the regulon specific score inferred using pySCENIC and by calculating the average expression. |
| Page: 1 |
Top |
Somatic mutation of malignant transformation related genes |
| Annotation of somatic variants for genes involved in malignant transformation |
| Hugo Symbol | Variant Class | Variant Classification | dbSNP RS | HGVSc | HGVSp | HGVSp Short | SWISSPROT | BIOTYPE | SIFT | PolyPhen | Tumor Sample Barcode | Tissue | Histology | Sex | Age | Stage | Therapy Types | Drugs | Outcome |
| MBL2 | SNV | Missense_Mutation | c.616N>C | p.Thr206Pro | p.T206P | P11226 | protein_coding | deleterious(0.01) | possibly_damaging(0.719) | TCGA-BH-A0BZ-01 | Breast | breast invasive carcinoma | Female | <65 | III/IV | Chemotherapy | doxorubicin | CR | |
| MBL2 | SNV | Missense_Mutation | novel | c.508G>C | p.Glu170Gln | p.E170Q | P11226 | protein_coding | deleterious(0) | probably_damaging(1) | TCGA-MU-A51Y-01 | Cervix | cervical & endocervical cancer | Female | <65 | I/II | Unknown | Unknown | SD |
| MBL2 | SNV | Missense_Mutation | c.510N>T | p.Glu170Asp | p.E170D | P11226 | protein_coding | deleterious(0) | probably_damaging(1) | TCGA-AA-3510-01 | Colorectum | colon adenocarcinoma | Male | >=65 | I/II | Unknown | Unknown | SD | |
| MBL2 | SNV | Missense_Mutation | rs769868112 | c.358G>A | p.Ala120Thr | p.A120T | P11226 | protein_coding | deleterious(0.05) | benign(0.001) | TCGA-D5-6540-01 | Colorectum | colon adenocarcinoma | Male | >=65 | I/II | Unknown | Unknown | SD |
| MBL2 | SNV | Missense_Mutation | novel | c.680N>C | p.Lys227Thr | p.K227T | P11226 | protein_coding | tolerated(0.55) | benign(0.013) | TCGA-EI-6917-01 | Colorectum | rectum adenocarcinoma | Male | <65 | III/IV | Chemotherapy | 5fluorouracil+oxaciplatina+l-folinian | SD |
| MBL2 | insertion | Frame_Shift_Ins | rs747467008 | c.218dupC | p.Gly74TrpfsTer31 | p.G74Wfs*31 | P11226 | protein_coding | TCGA-G4-6320-01 | Colorectum | colon adenocarcinoma | Male | >=65 | III/IV | Chemotherapy | oxaliplatin | SD | ||
| MBL2 | SNV | Missense_Mutation | rs769868112 | c.358N>A | p.Ala120Thr | p.A120T | P11226 | protein_coding | deleterious(0.05) | benign(0.001) | TCGA-A5-A0G2-01 | Endometrium | uterine corpus endometrioid carcinoma | Female | <65 | III/IV | Unknown | Unknown | SD |
| MBL2 | SNV | Missense_Mutation | novel | c.299N>A | p.Ser100Asn | p.S100N | P11226 | protein_coding | tolerated(0.55) | benign(0.015) | TCGA-A5-A0G2-01 | Endometrium | uterine corpus endometrioid carcinoma | Female | <65 | III/IV | Unknown | Unknown | SD |
| MBL2 | SNV | Missense_Mutation | c.686N>A | p.Gly229Asp | p.G229D | P11226 | protein_coding | deleterious(0) | probably_damaging(0.994) | TCGA-AP-A0LM-01 | Endometrium | uterine corpus endometrioid carcinoma | Female | <65 | III/IV | Chemotherapy | cisplatin | SD | |
| MBL2 | SNV | Missense_Mutation | rs143562102 | c.302N>T | p.Pro101Leu | p.P101L | P11226 | protein_coding | tolerated(0.3) | benign(0.017) | TCGA-AX-A0J0-01 | Endometrium | uterine corpus endometrioid carcinoma | Female | <65 | I/II | Unknown | Unknown | SD |
| Page: 1 2 3 4 |
Top |
Related drugs of malignant transformation related genes |
| Identification of chemicals and drugs interact with genes involved in malignant transfromation |
| (DGIdb 4.0) |
| Entrez ID | Symbol | Category | Interaction Types | Drug Claim Name | Drug Name | PMIDs |
| 4153 | MBL2 | DRUGGABLE GENOME, CELL SURFACE | DANAZOL | DANAZOL | 12076401 |
| Page: 1 |

Copyright 2023-Present -The University of Texas Health Science Center at Houston |