
|
|||||
|
 | |
| |
| |
| |
| |
| |
|
Gene: MBD6 |
Gene summary for MBD6 |
| Gene information | Species | Human | Gene symbol | MBD6 | Gene ID | 114785 |
| Gene name | methyl-CpG binding domain protein 6 | |
| Gene Alias | MBD6 | |
| Cytomap | 12q13.3 | |
| Gene Type | protein-coding | GO ID | GO:0001650 | UniProtAcc | A0A024RBA3 |
Top |
Malignant transformation analysis |
| Identification of the aberrant gene expression in precancerous and cancerous lesions by comparing the gene expression of stem-like cells in diseased tissues with normal stem cells |
| Entrez ID | Symbol | Replicates | Species | Organ | Tissue | Adj P-value | Log2FC | Malignancy |
| 114785 | MBD6 | LZE4T | Human | Esophagus | ESCC | 6.22e-05 | 6.44e-02 | 0.0811 |
| 114785 | MBD6 | LZE8T | Human | Esophagus | ESCC | 1.44e-03 | 1.05e-01 | 0.067 |
| 114785 | MBD6 | LZE22D1 | Human | Esophagus | HGIN | 6.76e-03 | 1.09e-01 | 0.0595 |
| 114785 | MBD6 | LZE24T | Human | Esophagus | ESCC | 1.97e-13 | 3.22e-01 | 0.0596 |
| 114785 | MBD6 | P1T-E | Human | Esophagus | ESCC | 9.61e-14 | 5.00e-01 | 0.0875 |
| 114785 | MBD6 | P2T-E | Human | Esophagus | ESCC | 5.45e-35 | 5.82e-01 | 0.1177 |
| 114785 | MBD6 | P4T-E | Human | Esophagus | ESCC | 9.38e-13 | 1.63e-01 | 0.1323 |
| 114785 | MBD6 | P5T-E | Human | Esophagus | ESCC | 3.20e-06 | 7.83e-02 | 0.1327 |
| 114785 | MBD6 | P8T-E | Human | Esophagus | ESCC | 3.67e-37 | 6.07e-01 | 0.0889 |
| 114785 | MBD6 | P9T-E | Human | Esophagus | ESCC | 1.51e-04 | 6.07e-02 | 0.1131 |
| 114785 | MBD6 | P10T-E | Human | Esophagus | ESCC | 2.74e-10 | 2.24e-01 | 0.116 |
| 114785 | MBD6 | P11T-E | Human | Esophagus | ESCC | 1.95e-11 | 3.74e-01 | 0.1426 |
| 114785 | MBD6 | P12T-E | Human | Esophagus | ESCC | 1.84e-25 | 3.90e-01 | 0.1122 |
| 114785 | MBD6 | P15T-E | Human | Esophagus | ESCC | 5.62e-12 | 3.53e-01 | 0.1149 |
| 114785 | MBD6 | P16T-E | Human | Esophagus | ESCC | 1.04e-17 | 3.34e-01 | 0.1153 |
| 114785 | MBD6 | P17T-E | Human | Esophagus | ESCC | 3.01e-03 | 2.87e-01 | 0.1278 |
| 114785 | MBD6 | P19T-E | Human | Esophagus | ESCC | 8.52e-03 | 1.86e-01 | 0.1662 |
| 114785 | MBD6 | P20T-E | Human | Esophagus | ESCC | 7.06e-17 | 4.33e-01 | 0.1124 |
| 114785 | MBD6 | P21T-E | Human | Esophagus | ESCC | 5.68e-15 | 1.95e-01 | 0.1617 |
| 114785 | MBD6 | P22T-E | Human | Esophagus | ESCC | 1.27e-16 | 1.05e-01 | 0.1236 |
| Page: 1 2 3 4 5 |
| Tissue | Expression Dynamics | Abbreviation |
| Esophagus | 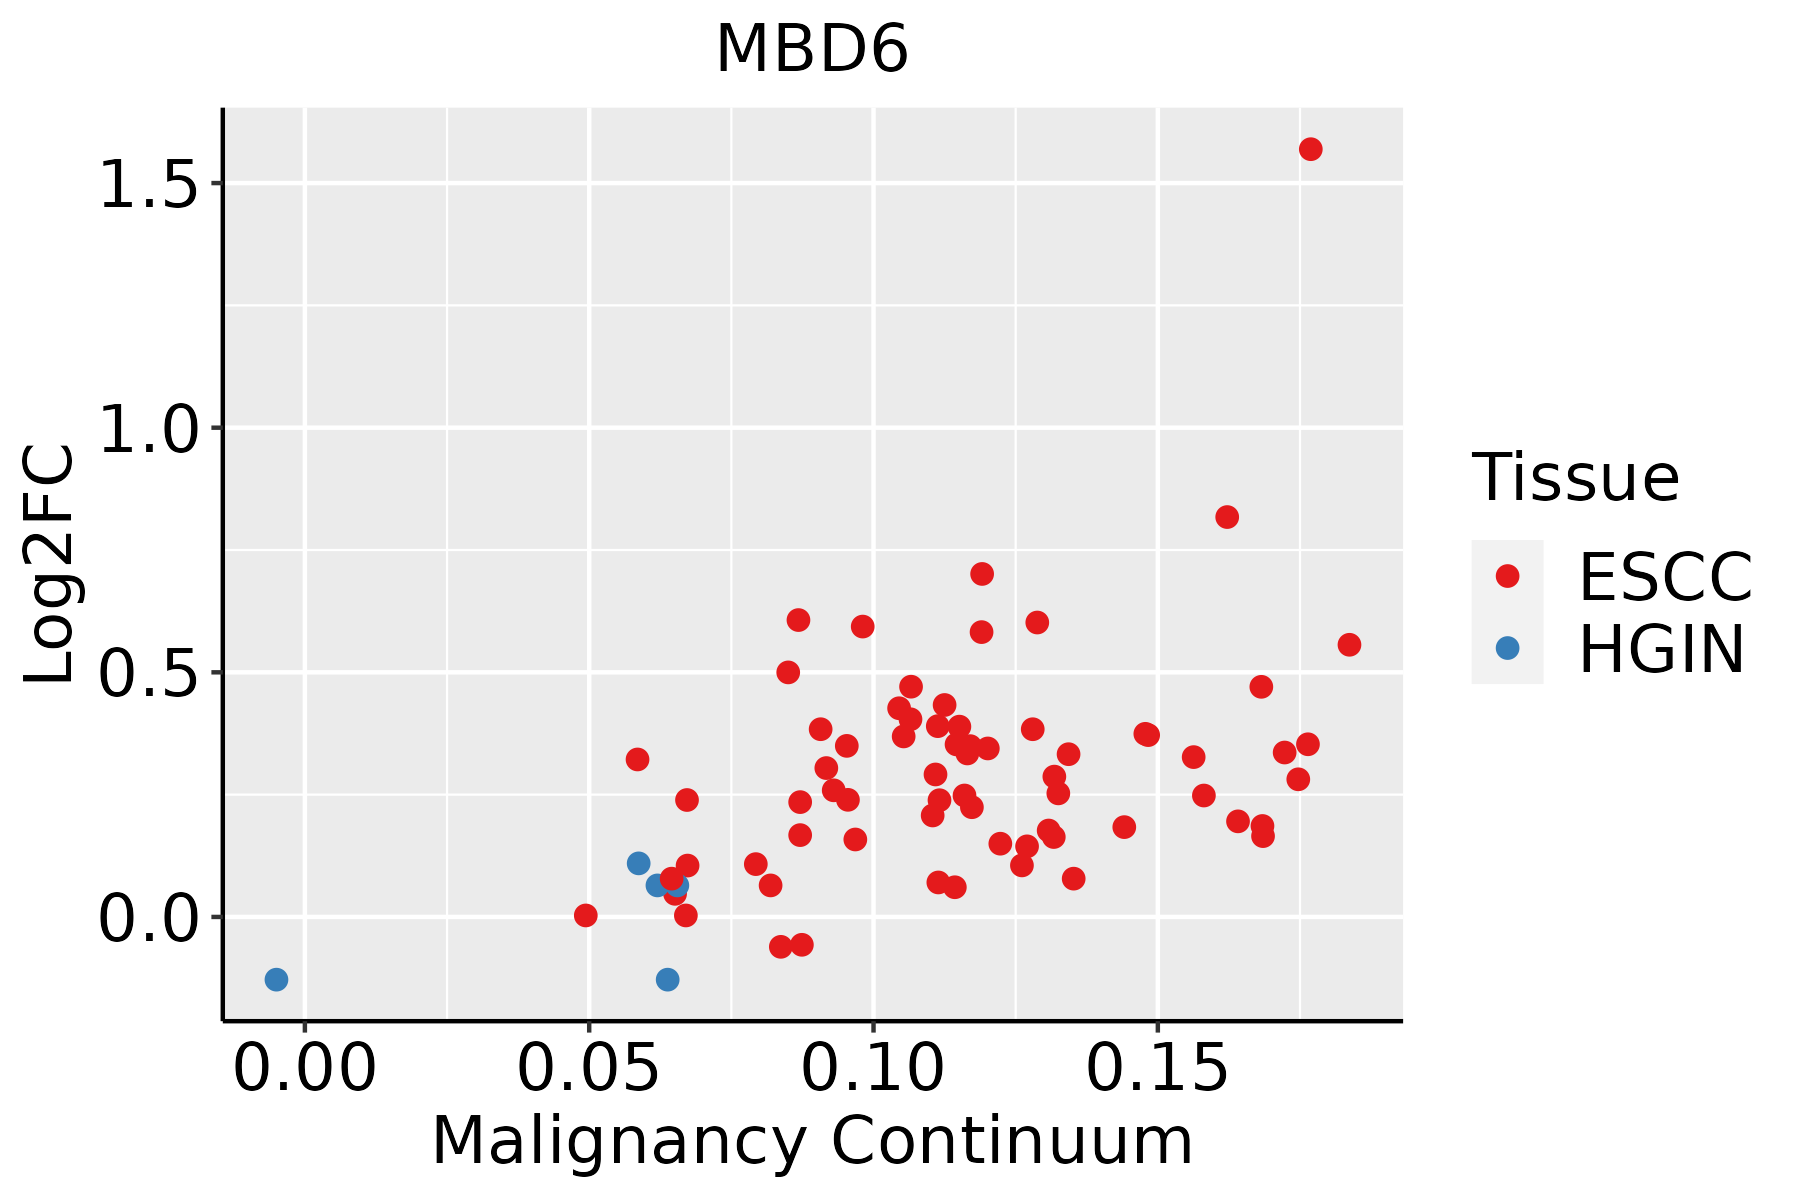 | ESCC: Esophageal squamous cell carcinoma |
| HGIN: High-grade intraepithelial neoplasias | ||
| LGIN: Low-grade intraepithelial neoplasias | ||
| Liver | 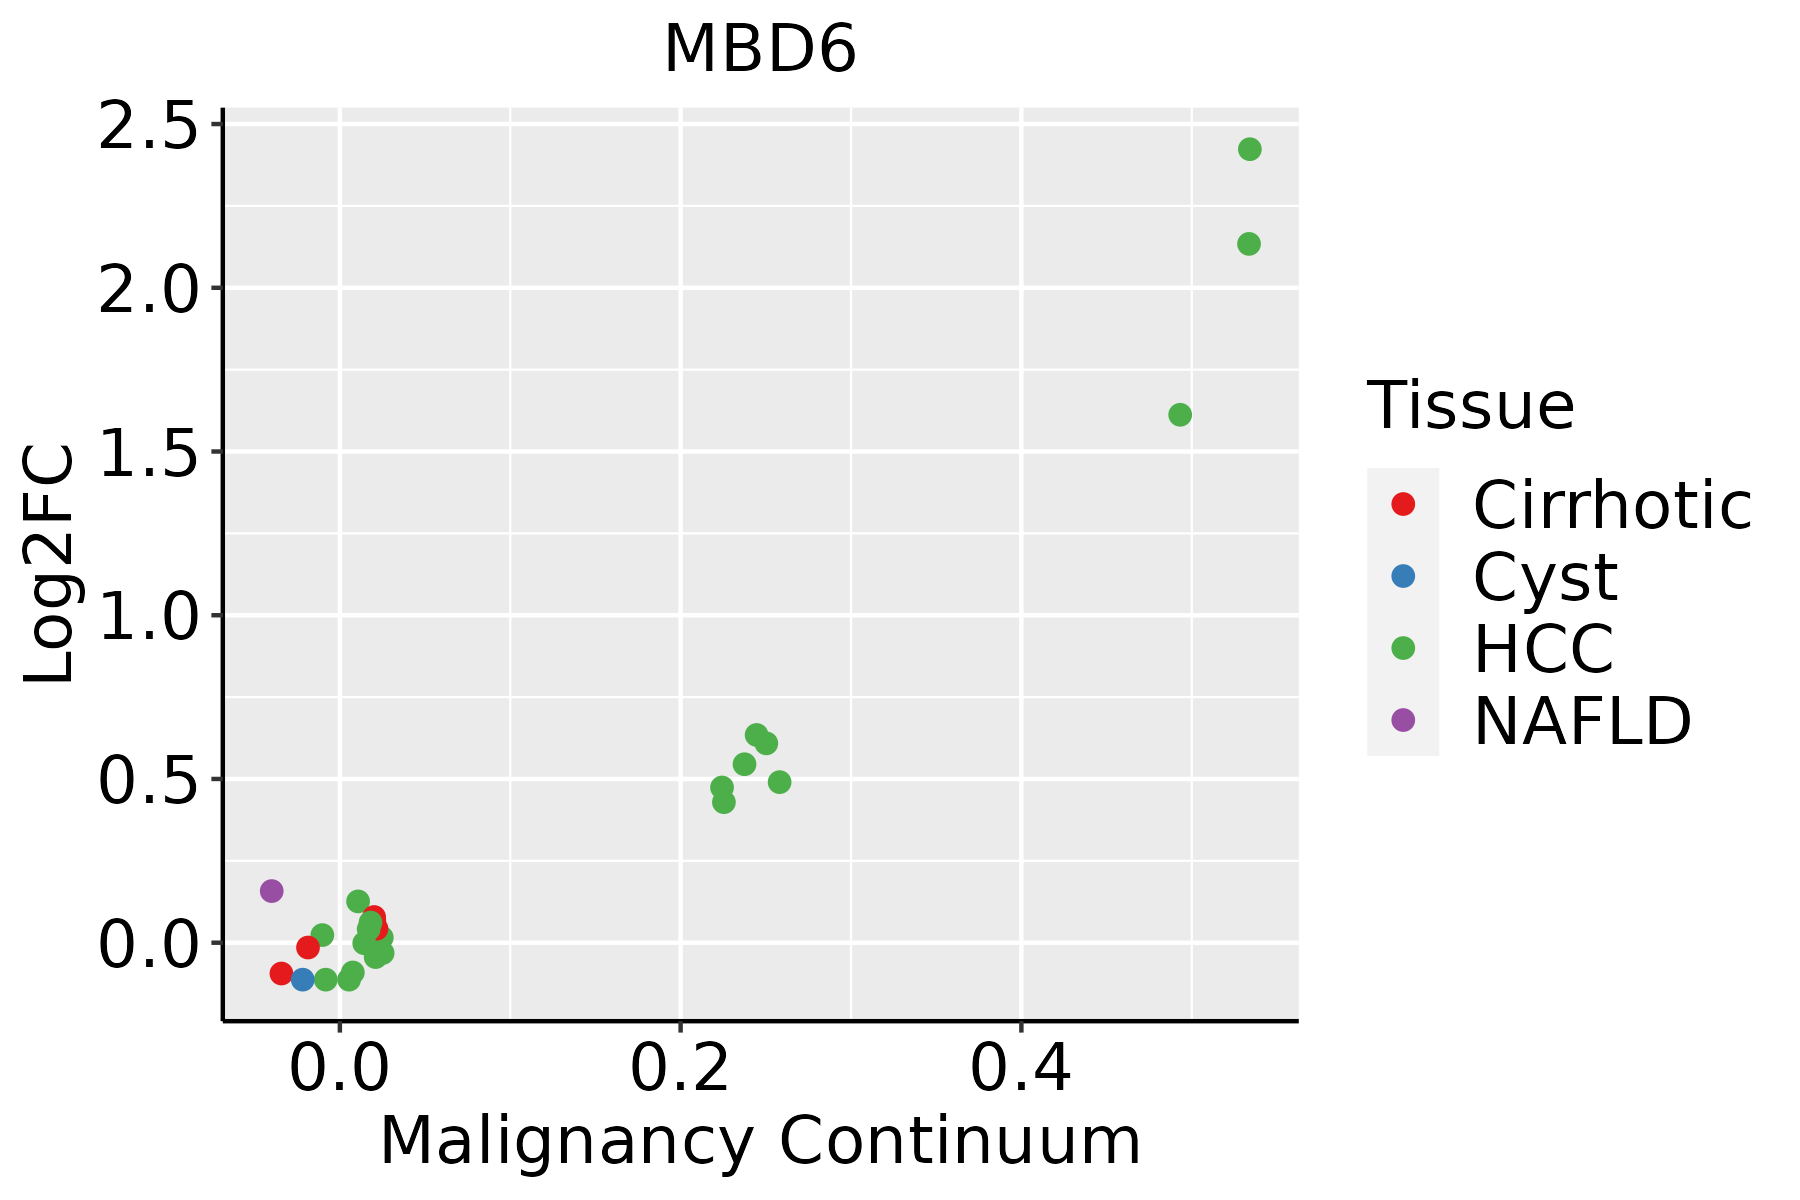 | HCC: Hepatocellular carcinoma |
| NAFLD: Non-alcoholic fatty liver disease | ||
| Oral Cavity | 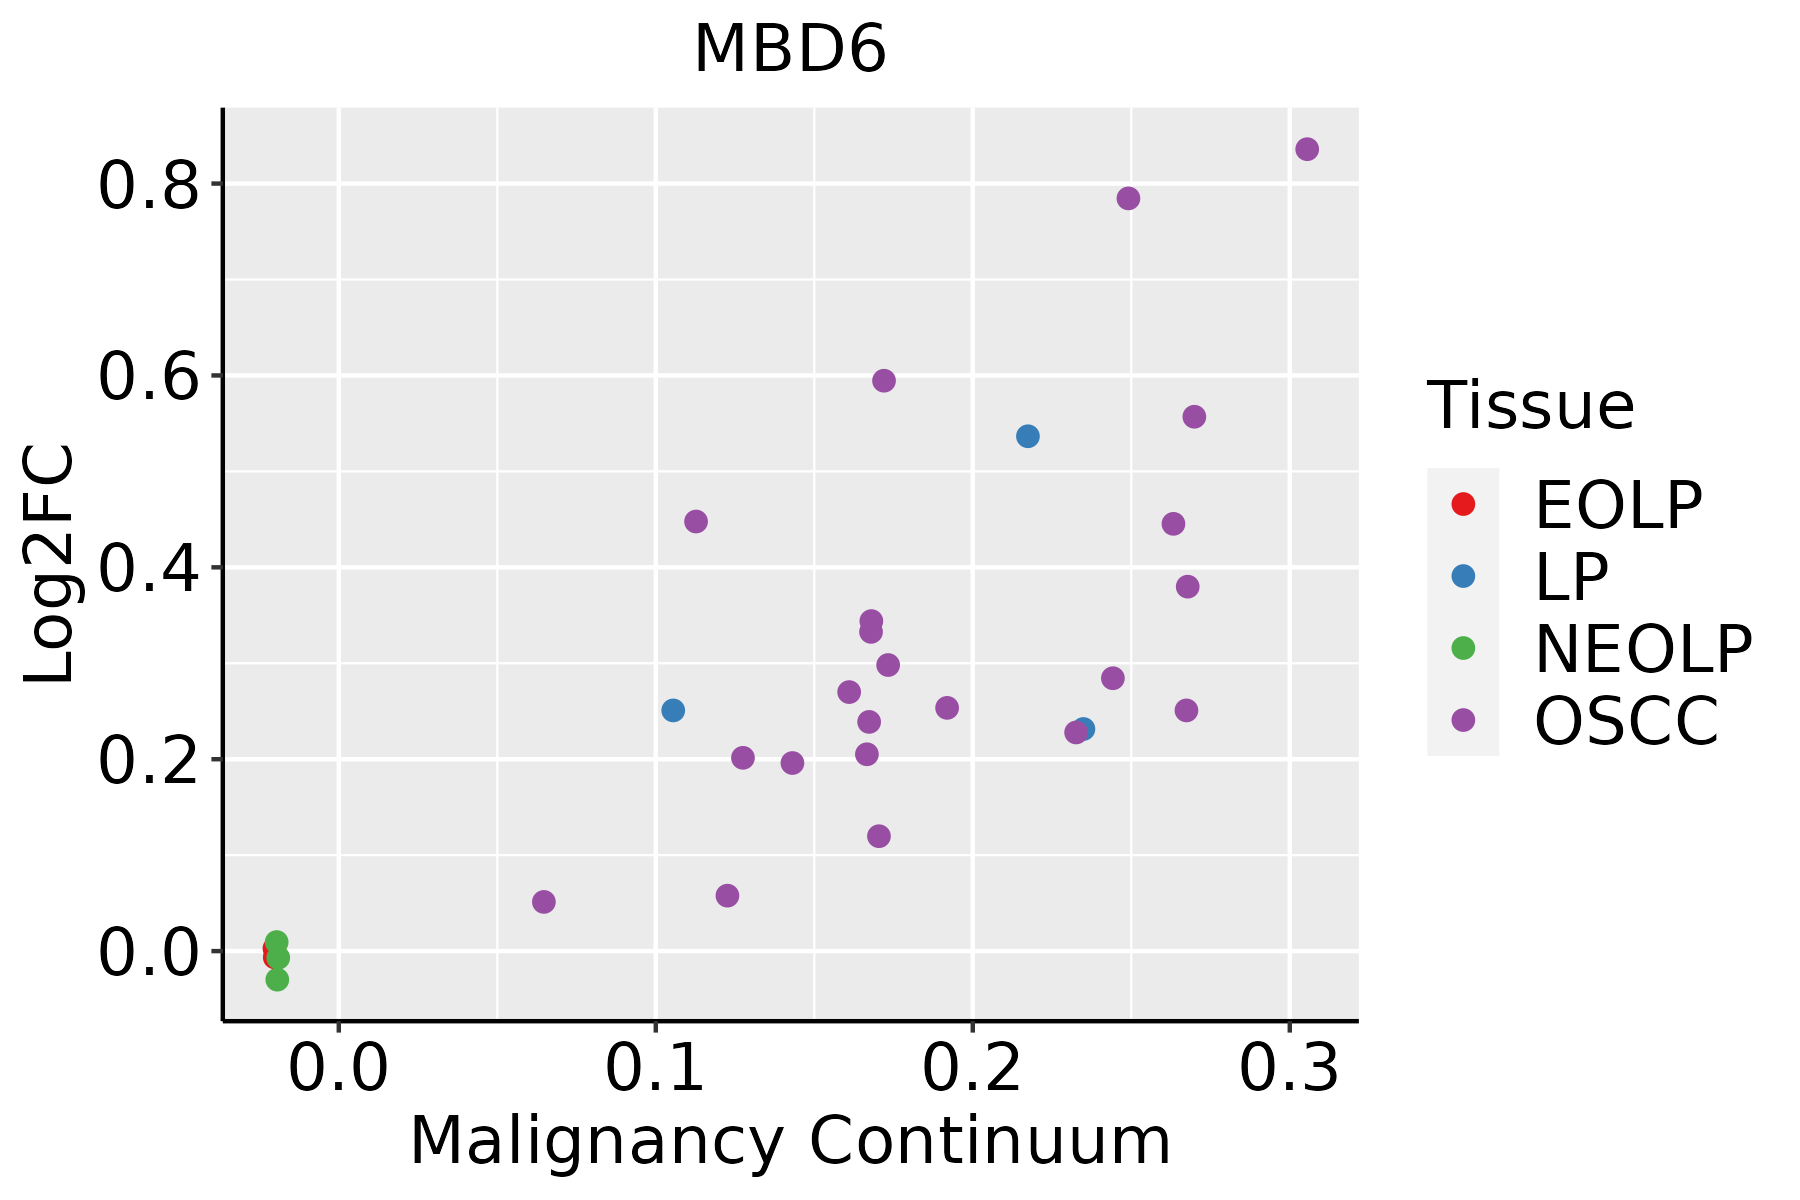 | EOLP: Erosive Oral lichen planus |
| LP: leukoplakia | ||
| NEOLP: Non-erosive oral lichen planus | ||
| OSCC: Oral squamous cell carcinoma | ||
| Thyroid | 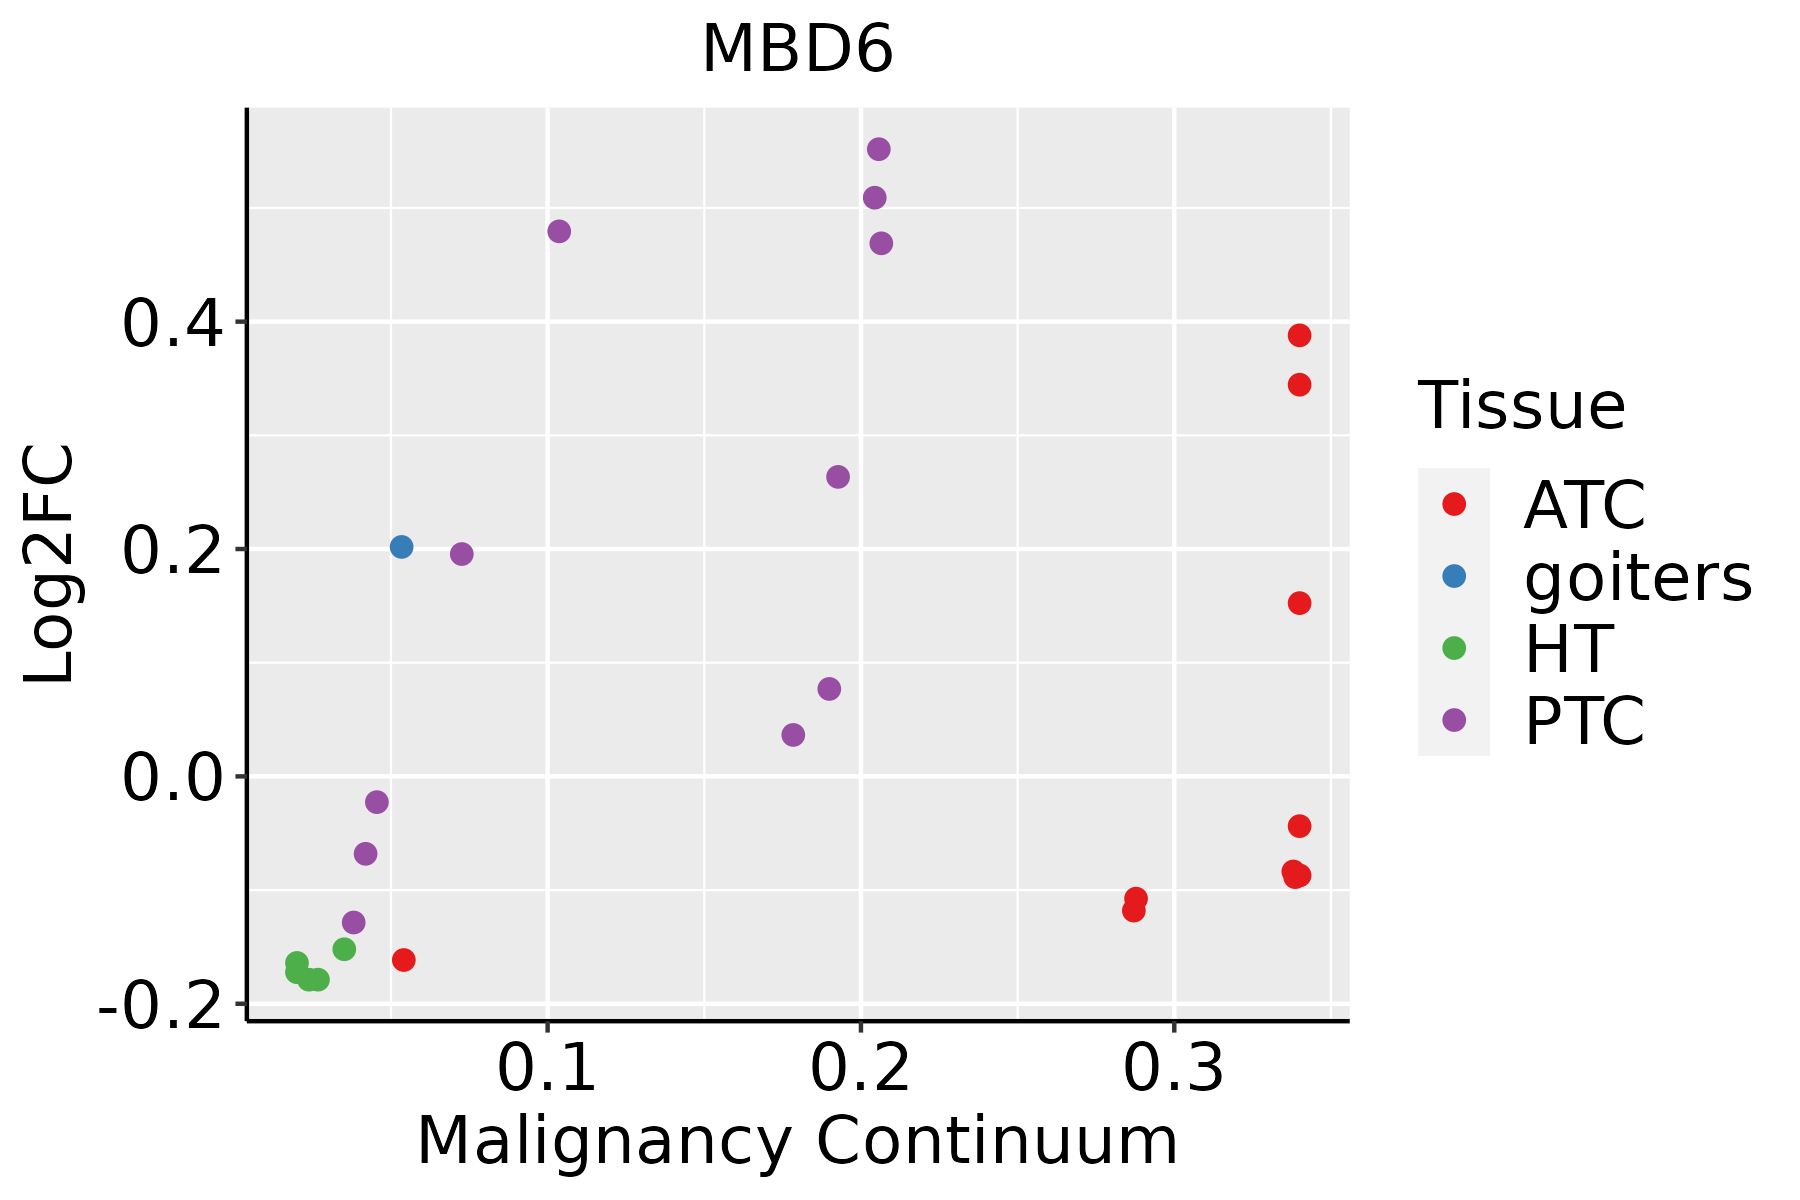 | ATC: Anaplastic thyroid cancer |
| HT: Hashimoto's thyroiditis | ||
| PTC: Papillary thyroid cancer |
| ∗log2FC in expression of this searched gene in stem-like cells from each diseased tissue sample relative to stem-like cells in normal samples in each tissue plotted against the malignancy continuum. Samples are colored based on if they are from different disease stage. |
Top |
Malignant transformation related pathway analysis |
| Find out the enriched GO biological processes and KEGG pathways involved in transition from healthy to precancer to cancer |
| Tissue | Disease Stage | Enriched GO biological Processes |
| Colorectum | AD |  |
| Colorectum | SER |  |
| Colorectum | MSS |  |
| Colorectum | MSI-H |  |
| Colorectum | FAP |  |
| ∗Top 15 enriched GO BP terms are showed in the bar plot of each disease state in each tissue. Each row represents a significant GO biological process which is colored according to the -log10(p.adjust). |
| Page: 1 2 3 4 5 6 7 8 9 |
| GO ID | Tissue | Disease Stage | Description | Gene Ratio | Bg Ratio | pvalue | p.adjust | Count |
| Page: 1 |
| Pathway ID | Tissue | Disease Stage | Description | Gene Ratio | Bg Ratio | pvalue | p.adjust | qvalue | Count |
| Page: 1 |
Top |
Cell-cell communication analysis |
| Identification of potential cell-cell interactions between two cell types and their ligand-receptor pairs for different disease states |
| Ligand | Receptor | LRpair | Pathway | Tissue | Disease Stage |
| Page: 1 |
Top |
Single-cell gene regulatory network inference analysis |
| Find out the significant the regulons (TFs) and the target genes of each regulon across cell types for different disease states |
| TF | Cell Type | Tissue | Disease Stage | Target Gene | RSS | Regulon Activity |
| ∗The dot plots of a searched regulon are shown for all cell subpopulations in each disease state of each tissue based on the regulon specific score inferred using pySCENIC and by calculating the average expression. |
| Page: 1 |
Top |
Somatic mutation of malignant transformation related genes |
| Annotation of somatic variants for genes involved in malignant transformation |
| Hugo Symbol | Variant Class | Variant Classification | dbSNP RS | HGVSc | HGVSp | HGVSp Short | SWISSPROT | BIOTYPE | SIFT | PolyPhen | Tumor Sample Barcode | Tissue | Histology | Sex | Age | Stage | Therapy Types | Drugs | Outcome |
| MBD6 | SNV | Missense_Mutation | novel | c.1973N>G | p.Asp658Gly | p.D658G | Q96DN6 | protein_coding | deleterious_low_confidence(0.01) | possibly_damaging(0.588) | TCGA-A7-A0CJ-01 | Breast | breast invasive carcinoma | Female | <65 | I/II | Chemotherapy | cytoxan | SD |
| MBD6 | SNV | Missense_Mutation | rs377656526 | c.328N>G | p.Met110Val | p.M110V | Q96DN6 | protein_coding | tolerated_low_confidence(0.11) | benign(0.031) | TCGA-A8-A06R-01 | Breast | breast invasive carcinoma | Female | >=65 | I/II | Chemotherapy | 5-fluorouracil | CR |
| MBD6 | SNV | Missense_Mutation | novel | c.1627N>G | p.Leu543Val | p.L543V | Q96DN6 | protein_coding | deleterious_low_confidence(0.01) | probably_damaging(0.969) | TCGA-A8-A095-01 | Breast | breast invasive carcinoma | Female | <65 | I/II | Chemotherapy | 5-fluorouracil | CR |
| MBD6 | SNV | Missense_Mutation | c.2831G>C | p.Gly944Ala | p.G944A | Q96DN6 | protein_coding | deleterious_low_confidence(0.01) | probably_damaging(0.992) | TCGA-BH-A0HA-01 | Breast | breast invasive carcinoma | Female | <65 | I/II | Unknown | Unknown | SD | |
| MBD6 | SNV | Missense_Mutation | rs746957309 | c.1489N>A | p.Glu497Lys | p.E497K | Q96DN6 | protein_coding | tolerated_low_confidence(0.07) | benign(0.019) | TCGA-D8-A1J9-01 | Breast | breast invasive carcinoma | Female | <65 | I/II | Unknown | Unknown | SD |
| MBD6 | SNV | Missense_Mutation | c.532N>G | p.Leu178Val | p.L178V | Q96DN6 | protein_coding | deleterious_low_confidence(0) | possibly_damaging(0.702) | TCGA-D8-A27G-01 | Breast | breast invasive carcinoma | Female | >=65 | I/II | Unknown | Unknown | SD | |
| MBD6 | insertion | In_Frame_Ins | novel | c.1975_1976insTTTTCATGTTTCTTAGGTTGAAACAAATTCTTA | p.Leu659_Ser660insPheMetPheLeuArgLeuLysGlnIleLeuMet | p.L659_S660insFMFLRLKQILM | Q96DN6 | protein_coding | TCGA-A7-A0CJ-01 | Breast | breast invasive carcinoma | Female | <65 | I/II | Chemotherapy | cytoxan | SD | ||
| MBD6 | deletion | Frame_Shift_Del | c.560delC | p.Pro187GlnfsTer81 | p.P187Qfs*81 | Q96DN6 | protein_coding | TCGA-AO-A128-01 | Breast | breast invasive carcinoma | Female | <65 | I/II | Chemotherapy | doxorubicin | SD | |||
| MBD6 | deletion | Frame_Shift_Del | novel | c.1876delC | p.Leu626CysfsTer49 | p.L626Cfs*49 | Q96DN6 | protein_coding | TCGA-BH-A8G0-01 | Breast | breast invasive carcinoma | Female | <65 | I/II | Chemotherapy | taxotere | CR | ||
| MBD6 | deletion | Frame_Shift_Del | novel | c.1088delN | p.Gln363ArgfsTer14 | p.Q363Rfs*14 | Q96DN6 | protein_coding | TCGA-D8-A27V-01 | Breast | breast invasive carcinoma | Female | <65 | I/II | Hormone Therapy | tamoxiphen | SD |
| Page: 1 2 3 4 5 6 7 8 9 10 11 12 13 14 15 16 17 18 19 20 21 |
Top |
Related drugs of malignant transformation related genes |
| Identification of chemicals and drugs interact with genes involved in malignant transfromation |
| (DGIdb 4.0) |
| Entrez ID | Symbol | Category | Interaction Types | Drug Claim Name | Drug Name | PMIDs |
| Page: 1 |

Copyright 2023-Present -The University of Texas Health Science Center at Houston |