
|
|||||
|
 | |
| |
| |
| |
| |
| |
|
Gene: MBD5 |
Gene summary for MBD5 |
| Gene information | Species | Human | Gene symbol | MBD5 | Gene ID | 55777 |
| Gene name | methyl-CpG binding domain protein 5 | |
| Gene Alias | MRD1 | |
| Cytomap | 2q23.1 | |
| Gene Type | protein-coding | GO ID | GO:0007154 | UniProtAcc | Q9P267 |
Top |
Malignant transformation analysis |
| Identification of the aberrant gene expression in precancerous and cancerous lesions by comparing the gene expression of stem-like cells in diseased tissues with normal stem cells |
| Entrez ID | Symbol | Replicates | Species | Organ | Tissue | Adj P-value | Log2FC | Malignancy |
| 55777 | MBD5 | CCI_1 | Human | Cervix | CC | 7.01e-08 | 1.05e+00 | 0.528 |
| 55777 | MBD5 | CCI_2 | Human | Cervix | CC | 1.24e-14 | 1.31e+00 | 0.5249 |
| 55777 | MBD5 | CCI_3 | Human | Cervix | CC | 2.94e-32 | 1.40e+00 | 0.516 |
| 55777 | MBD5 | HTA11_3410_2000001011 | Human | Colorectum | AD | 2.41e-16 | -5.85e-01 | 0.0155 |
| 55777 | MBD5 | HTA11_2487_2000001011 | Human | Colorectum | SER | 4.56e-04 | -4.71e-01 | -0.1808 |
| 55777 | MBD5 | HTA11_3361_2000001011 | Human | Colorectum | AD | 2.78e-09 | -6.86e-01 | -0.1207 |
| 55777 | MBD5 | HTA11_866_2000001011 | Human | Colorectum | AD | 3.17e-02 | -3.22e-01 | -0.1001 |
| 55777 | MBD5 | HTA11_5212_2000001011 | Human | Colorectum | AD | 1.66e-09 | -9.08e-01 | -0.2061 |
| 55777 | MBD5 | HTA11_866_3004761011 | Human | Colorectum | AD | 1.30e-12 | -6.03e-01 | 0.096 |
| 55777 | MBD5 | HTA11_4255_2000001011 | Human | Colorectum | SER | 6.06e-03 | -6.03e-01 | 0.0446 |
| 55777 | MBD5 | HTA11_8622_2000001021 | Human | Colorectum | SER | 1.48e-04 | -5.79e-01 | 0.0528 |
| 55777 | MBD5 | HTA11_10711_2000001011 | Human | Colorectum | AD | 1.30e-04 | -4.49e-01 | 0.0338 |
| 55777 | MBD5 | HTA11_7696_3000711011 | Human | Colorectum | AD | 6.57e-14 | -5.57e-01 | 0.0674 |
| 55777 | MBD5 | HTA11_7469_2000001011 | Human | Colorectum | AD | 5.85e-04 | -1.04e+00 | -0.0124 |
| 55777 | MBD5 | HTA11_99999970781_79442 | Human | Colorectum | MSS | 9.75e-09 | -4.54e-01 | 0.294 |
| 55777 | MBD5 | HTA11_99999973899_84307 | Human | Colorectum | MSS | 6.55e-05 | -6.59e-01 | 0.2585 |
| 55777 | MBD5 | HTA11_99999974143_84620 | Human | Colorectum | MSS | 1.30e-13 | -5.01e-01 | 0.3005 |
| 55777 | MBD5 | A015-C-203 | Human | Colorectum | FAP | 4.79e-25 | -3.56e-01 | -0.1294 |
| 55777 | MBD5 | A015-C-204 | Human | Colorectum | FAP | 5.21e-08 | -3.45e-01 | -0.0228 |
| 55777 | MBD5 | A014-C-040 | Human | Colorectum | FAP | 2.41e-05 | -1.24e-01 | -0.1184 |
| Page: 1 2 3 4 5 6 |
| Tissue | Expression Dynamics | Abbreviation |
| Cervix | 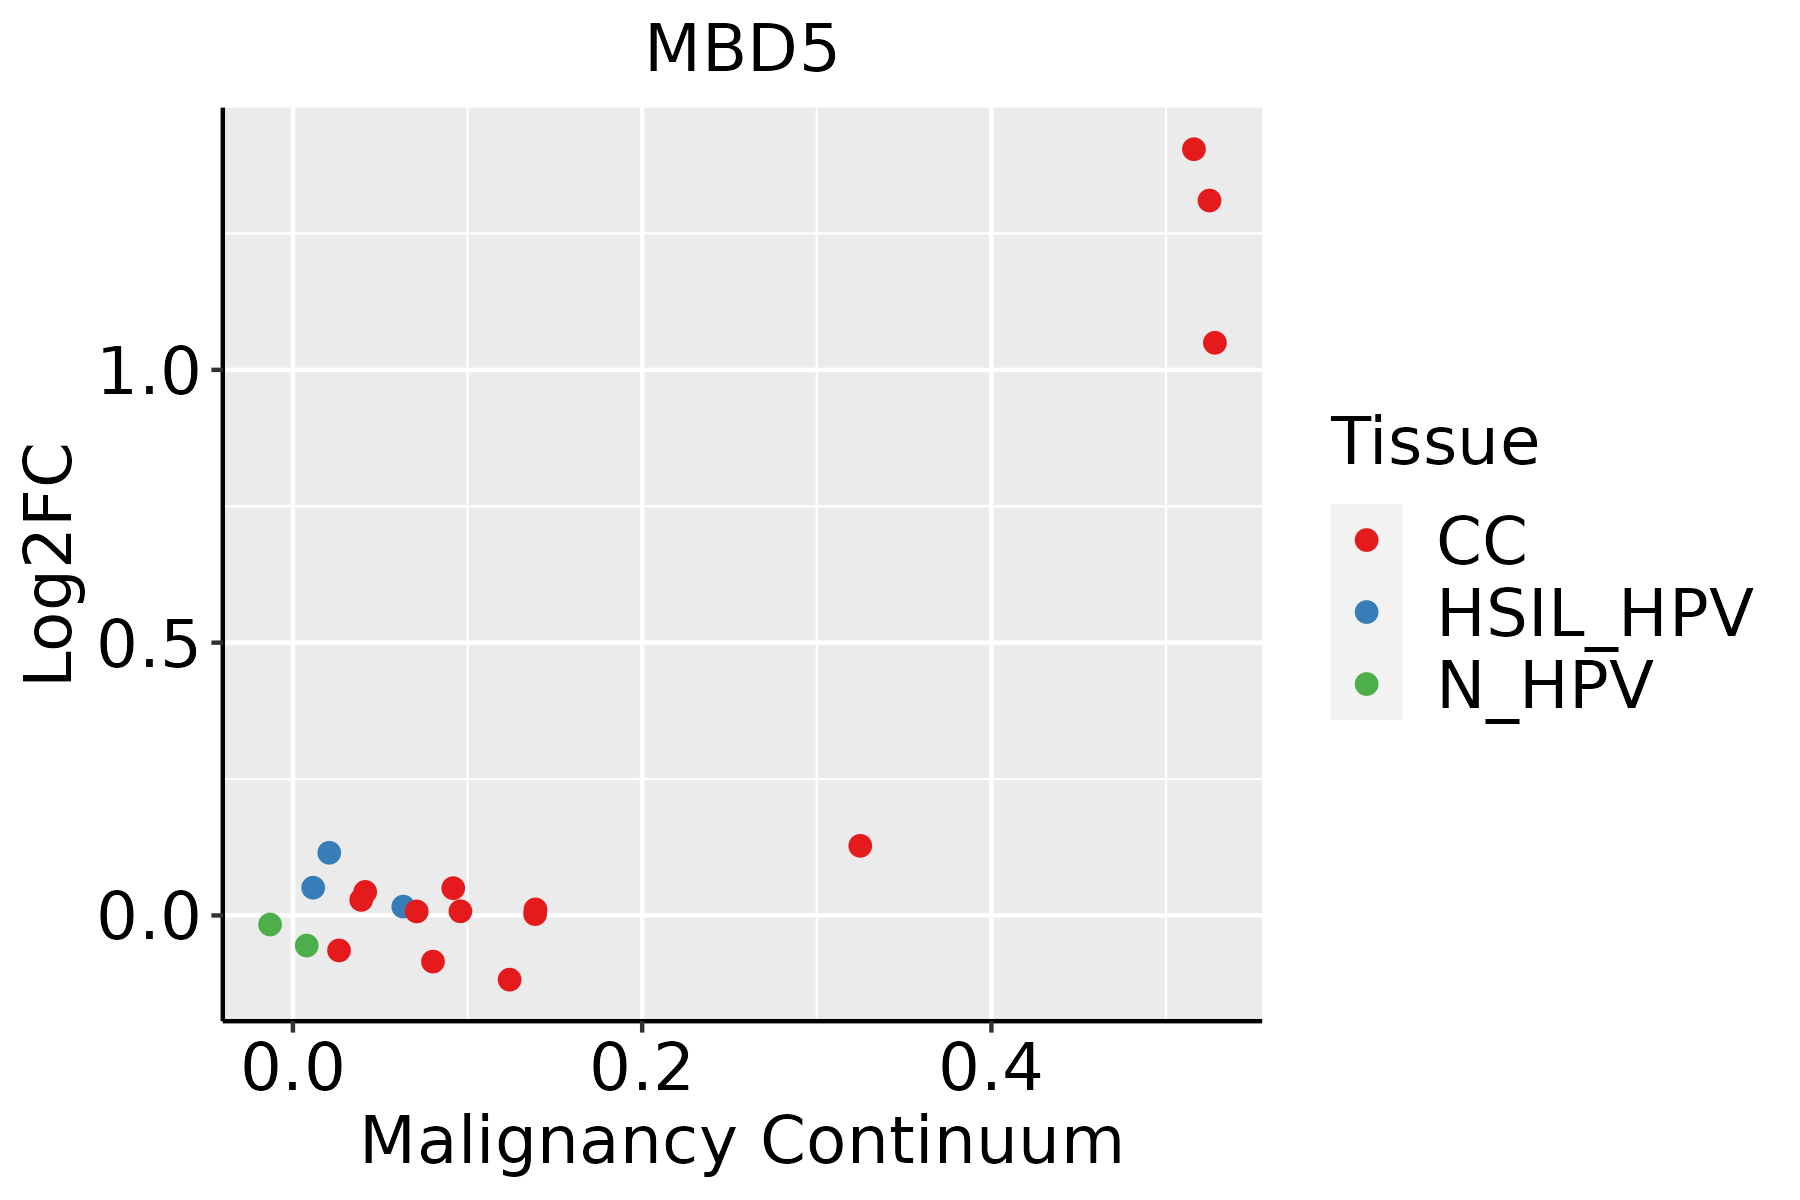 | CC: Cervix cancer |
| HSIL_HPV: HPV-infected high-grade squamous intraepithelial lesions | ||
| N_HPV: HPV-infected normal cervix | ||
| Colorectum (GSE201348) |  | FAP: Familial adenomatous polyposis |
| CRC: Colorectal cancer | ||
| Colorectum (HTA11) |  | AD: Adenomas |
| SER: Sessile serrated lesions | ||
| MSI-H: Microsatellite-high colorectal cancer | ||
| MSS: Microsatellite stable colorectal cancer | ||
| Endometrium | 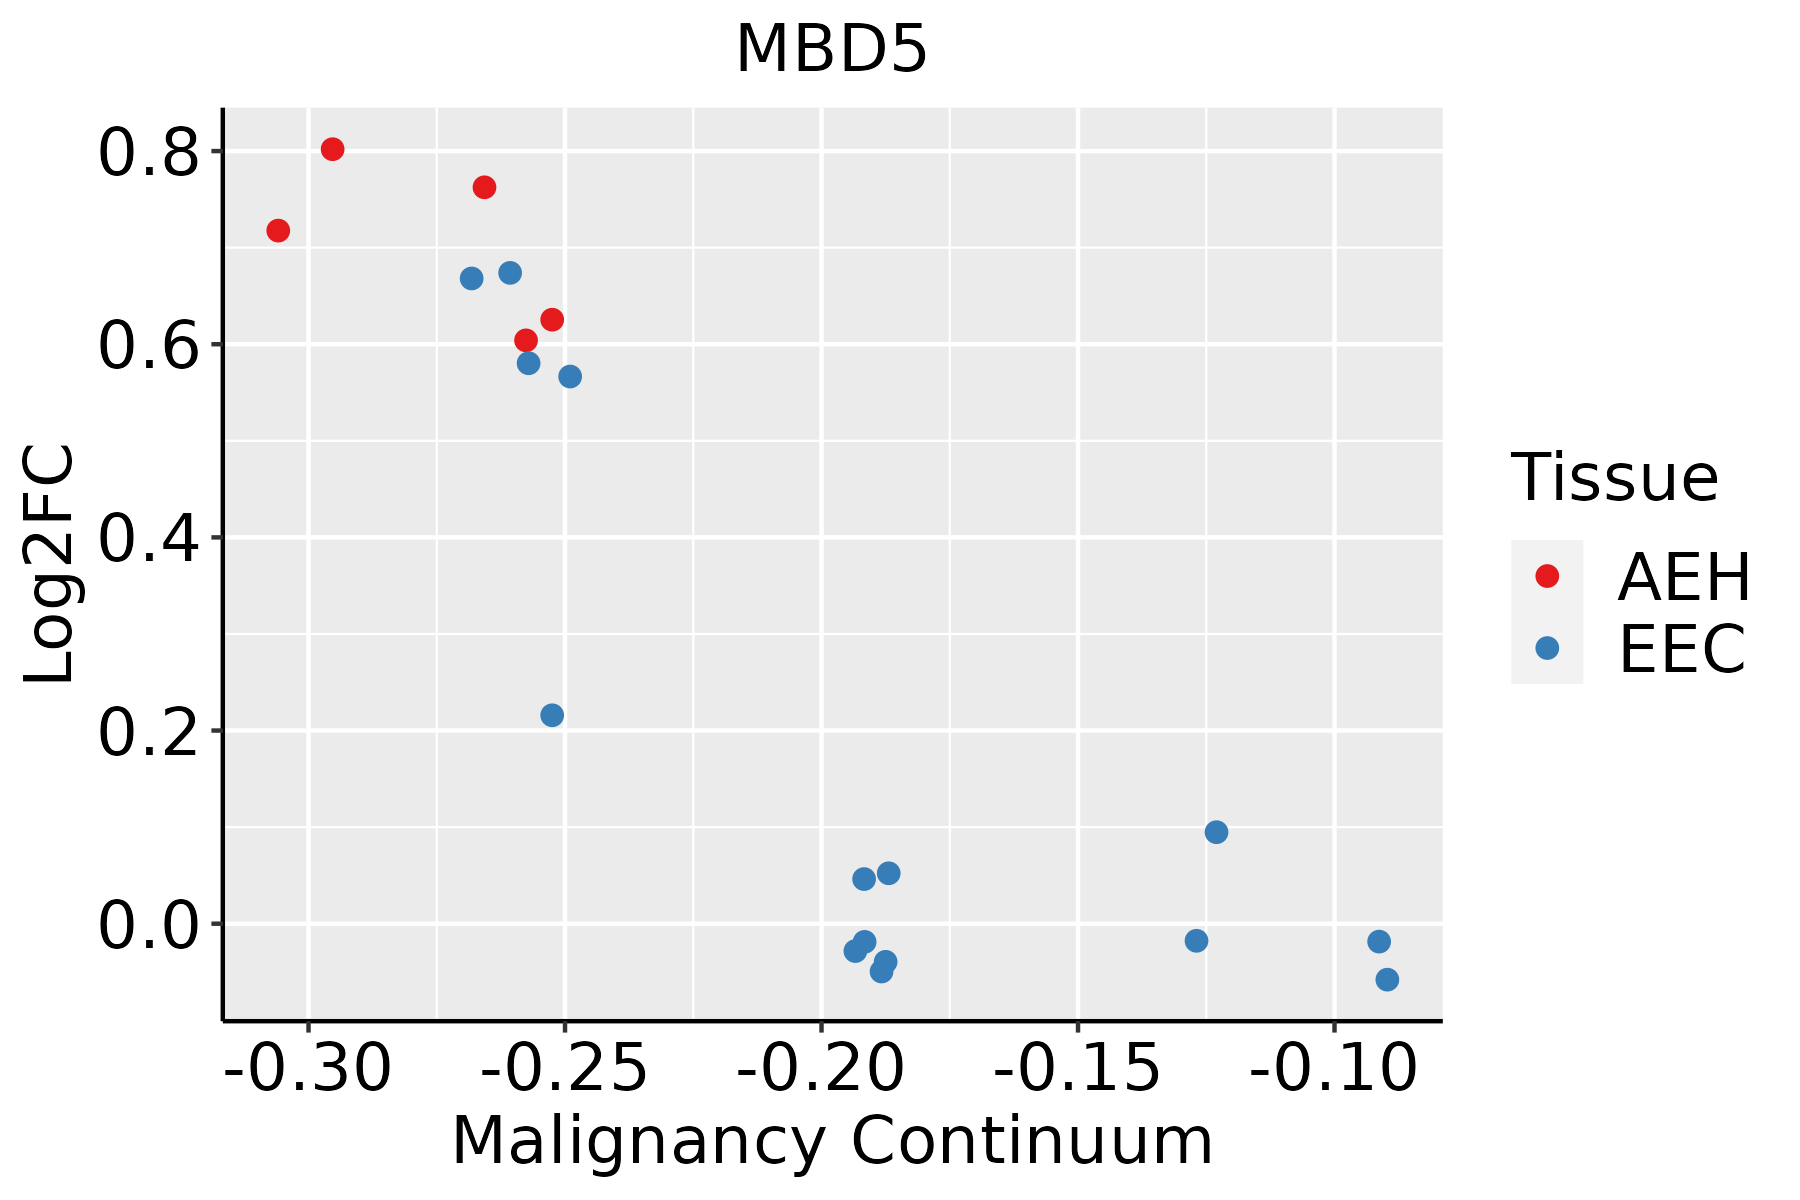 | AEH: Atypical endometrial hyperplasia |
| EEC: Endometrioid Cancer | ||
| Lung |  | AAH: Atypical adenomatous hyperplasia |
| AIS: Adenocarcinoma in situ | ||
| IAC: Invasive lung adenocarcinoma | ||
| MIA: Minimally invasive adenocarcinoma | ||
| Prostate | 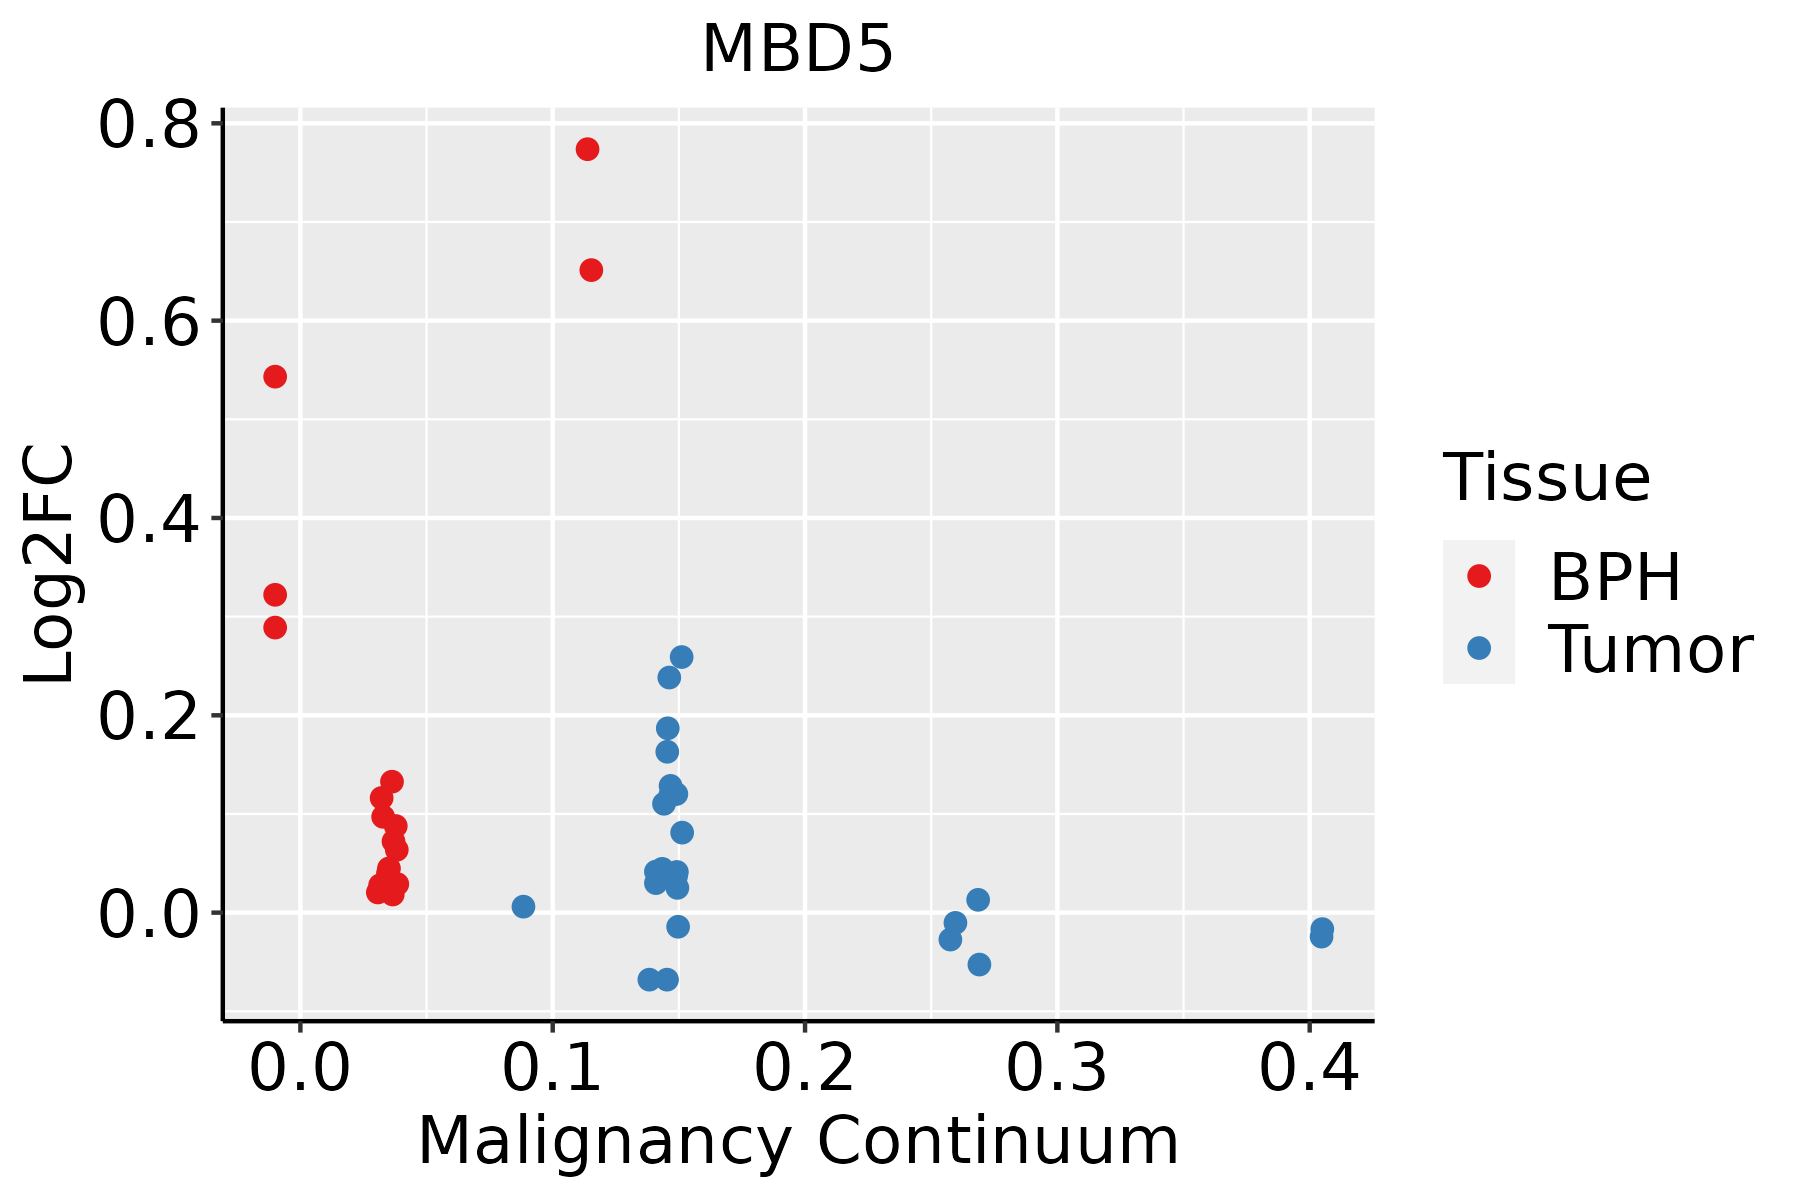 | BPH: Benign Prostatic Hyperplasia |
| Thyroid | 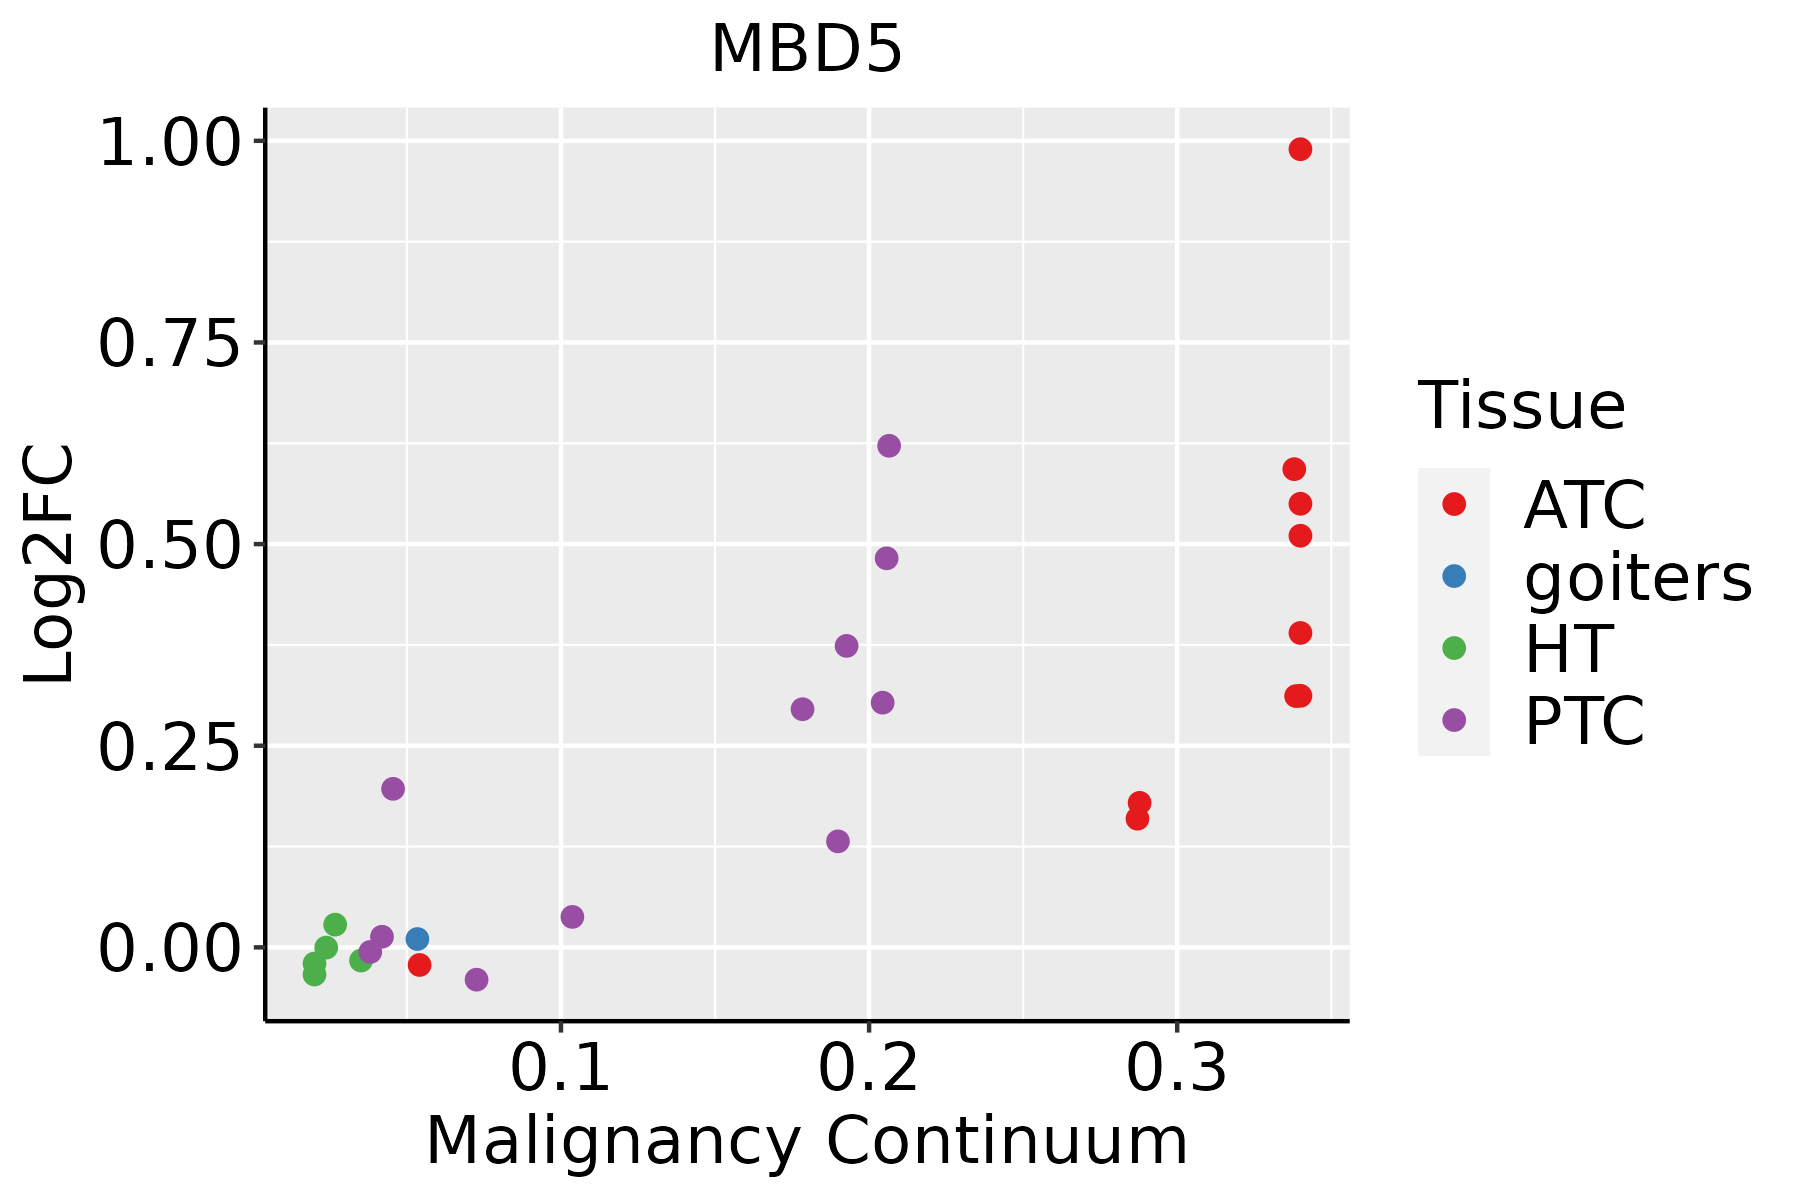 | ATC: Anaplastic thyroid cancer |
| HT: Hashimoto's thyroiditis | ||
| PTC: Papillary thyroid cancer |
| ∗log2FC in expression of this searched gene in stem-like cells from each diseased tissue sample relative to stem-like cells in normal samples in each tissue plotted against the malignancy continuum. Samples are colored based on if they are from different disease stage. |
Top |
Malignant transformation related pathway analysis |
| Find out the enriched GO biological processes and KEGG pathways involved in transition from healthy to precancer to cancer |
| Tissue | Disease Stage | Enriched GO biological Processes |
| Colorectum | AD |  |
| Colorectum | SER |  |
| Colorectum | MSS |  |
| Colorectum | MSI-H |  |
| Colorectum | FAP |  |
| ∗Top 15 enriched GO BP terms are showed in the bar plot of each disease state in each tissue. Each row represents a significant GO biological process which is colored according to the -log10(p.adjust). |
| Page: 1 2 3 4 5 6 7 8 9 |
| GO ID | Tissue | Disease Stage | Description | Gene Ratio | Bg Ratio | pvalue | p.adjust | Count |
| GO:19016538 | Cervix | CC | cellular response to peptide | 72/2311 | 359/18723 | 1.89e-05 | 3.48e-04 | 72 |
| GO:00434349 | Cervix | CC | response to peptide hormone | 77/2311 | 414/18723 | 1.40e-04 | 1.70e-03 | 77 |
| GO:00713757 | Cervix | CC | cellular response to peptide hormone stimulus | 57/2311 | 290/18723 | 2.32e-04 | 2.59e-03 | 57 |
| GO:00425939 | Cervix | CC | glucose homeostasis | 50/2311 | 258/18723 | 7.57e-04 | 6.76e-03 | 50 |
| GO:00486386 | Cervix | CC | regulation of developmental growth | 61/2311 | 330/18723 | 7.69e-04 | 6.85e-03 | 61 |
| GO:00335009 | Cervix | CC | carbohydrate homeostasis | 50/2311 | 259/18723 | 8.28e-04 | 7.22e-03 | 50 |
| GO:1901653 | Colorectum | AD | cellular response to peptide | 114/3918 | 359/18723 | 8.32e-07 | 2.88e-05 | 114 |
| GO:0071375 | Colorectum | AD | cellular response to peptide hormone stimulus | 95/3918 | 290/18723 | 1.50e-06 | 4.66e-05 | 95 |
| GO:0043434 | Colorectum | AD | response to peptide hormone | 126/3918 | 414/18723 | 2.70e-06 | 7.86e-05 | 126 |
| GO:0033500 | Colorectum | AD | carbohydrate homeostasis | 84/3918 | 259/18723 | 9.10e-06 | 2.15e-04 | 84 |
| GO:0042593 | Colorectum | AD | glucose homeostasis | 83/3918 | 258/18723 | 1.44e-05 | 3.11e-04 | 83 |
| GO:0048638 | Colorectum | AD | regulation of developmental growth | 92/3918 | 330/18723 | 1.48e-03 | 1.25e-02 | 92 |
| GO:19016531 | Colorectum | SER | cellular response to peptide | 83/2897 | 359/18723 | 8.03e-05 | 1.77e-03 | 83 |
| GO:00434341 | Colorectum | SER | response to peptide hormone | 93/2897 | 414/18723 | 9.61e-05 | 2.04e-03 | 93 |
| GO:00713751 | Colorectum | SER | cellular response to peptide hormone stimulus | 68/2897 | 290/18723 | 2.20e-04 | 3.89e-03 | 68 |
| GO:00425931 | Colorectum | SER | glucose homeostasis | 57/2897 | 258/18723 | 2.92e-03 | 2.59e-02 | 57 |
| GO:00335001 | Colorectum | SER | carbohydrate homeostasis | 57/2897 | 259/18723 | 3.20e-03 | 2.76e-02 | 57 |
| GO:0060396 | Colorectum | SER | growth hormone receptor signaling pathway | 9/2897 | 23/18723 | 5.20e-03 | 3.95e-02 | 9 |
| GO:0071378 | Colorectum | SER | cellular response to growth hormone stimulus | 9/2897 | 24/18723 | 7.19e-03 | 4.99e-02 | 9 |
| GO:00335002 | Colorectum | MSS | carbohydrate homeostasis | 76/3467 | 259/18723 | 1.37e-05 | 3.14e-04 | 76 |
| Page: 1 2 3 4 5 |
| Pathway ID | Tissue | Disease Stage | Description | Gene Ratio | Bg Ratio | pvalue | p.adjust | qvalue | Count |
| Page: 1 |
Top |
Cell-cell communication analysis |
| Identification of potential cell-cell interactions between two cell types and their ligand-receptor pairs for different disease states |
| Ligand | Receptor | LRpair | Pathway | Tissue | Disease Stage |
| Page: 1 |
Top |
Single-cell gene regulatory network inference analysis |
| Find out the significant the regulons (TFs) and the target genes of each regulon across cell types for different disease states |
| TF | Cell Type | Tissue | Disease Stage | Target Gene | RSS | Regulon Activity |
| ∗The dot plots of a searched regulon are shown for all cell subpopulations in each disease state of each tissue based on the regulon specific score inferred using pySCENIC and by calculating the average expression. |
| Page: 1 |
Top |
Somatic mutation of malignant transformation related genes |
| Annotation of somatic variants for genes involved in malignant transformation |
| Hugo Symbol | Variant Class | Variant Classification | dbSNP RS | HGVSc | HGVSp | HGVSp Short | SWISSPROT | BIOTYPE | SIFT | PolyPhen | Tumor Sample Barcode | Tissue | Histology | Sex | Age | Stage | Therapy Types | Drugs | Outcome |
| MBD5 | SNV | Missense_Mutation | c.1173N>C | p.Met391Ile | p.M391I | Q9P267 | protein_coding | tolerated(0.17) | benign(0) | TCGA-A2-A0YK-01 | Breast | breast invasive carcinoma | Female | <65 | I/II | Chemotherapy | cytoxan | SD | |
| MBD5 | SNV | Missense_Mutation | rs140900949 | c.2056N>C | p.Asp686His | p.D686H | Q9P267 | protein_coding | deleterious(0) | probably_damaging(0.947) | TCGA-AC-A2BK-01 | Breast | breast invasive carcinoma | Female | >=65 | III/IV | Chemotherapy | cytoxan | CR |
| MBD5 | SNV | Missense_Mutation | rs571209967 | c.3532N>A | p.Glu1178Lys | p.E1178K | Q9P267 | protein_coding | deleterious_low_confidence(0.04) | benign(0.127) | TCGA-AN-A046-01 | Breast | breast invasive carcinoma | Female | >=65 | I/II | Unknown | Unknown | SD |
| MBD5 | SNV | Missense_Mutation | c.1640G>T | p.Gly547Val | p.G547V | Q9P267 | protein_coding | deleterious(0.02) | benign(0.055) | TCGA-AR-A0TZ-01 | Breast | breast invasive carcinoma | Female | <65 | III/IV | Unspecific | Doxorubicin | PD | |
| MBD5 | SNV | Missense_Mutation | c.24C>A | p.Asp8Glu | p.D8E | Q9P267 | protein_coding | tolerated(1) | probably_damaging(0.992) | TCGA-BH-A0H6-01 | Breast | breast invasive carcinoma | Female | >=65 | I/II | Unknown | Unknown | SD | |
| MBD5 | SNV | Missense_Mutation | c.2759N>A | p.Ser920Asn | p.S920N | Q9P267 | protein_coding | tolerated(0.45) | benign(0) | TCGA-BH-A0HF-01 | Breast | breast invasive carcinoma | Female | >=65 | I/II | Hormone Therapy | arimidex | SD | |
| MBD5 | SNV | Missense_Mutation | c.3374N>T | p.Ala1125Val | p.A1125V | Q9P267 | protein_coding | deleterious_low_confidence(0) | probably_damaging(0.996) | TCGA-C8-A1HK-01 | Breast | breast invasive carcinoma | Female | <65 | I/II | Unknown | Unknown | SD | |
| MBD5 | SNV | Missense_Mutation | c.2232G>T | p.Met744Ile | p.M744I | Q9P267 | protein_coding | tolerated(0.2) | benign(0) | TCGA-D8-A27G-01 | Breast | breast invasive carcinoma | Female | >=65 | I/II | Unknown | Unknown | SD | |
| MBD5 | SNV | Missense_Mutation | novel | c.52G>A | p.Ala18Thr | p.A18T | Q9P267 | protein_coding | tolerated(0.08) | benign(0.011) | TCGA-2W-A8YY-01 | Cervix | cervical & endocervical cancer | Female | <65 | I/II | Chemotherapy | cisplatin | CR |
| MBD5 | SNV | Missense_Mutation | c.788N>A | p.Ser263Tyr | p.S263Y | Q9P267 | protein_coding | deleterious(0) | probably_damaging(0.944) | TCGA-FU-A3HZ-01 | Cervix | cervical & endocervical cancer | Female | <65 | I/II | Chemotherapy | cisplatin | CR |
| Page: 1 2 3 4 5 6 7 8 9 10 11 12 13 14 15 16 17 18 |
Top |
Related drugs of malignant transformation related genes |
| Identification of chemicals and drugs interact with genes involved in malignant transfromation |
| (DGIdb 4.0) |
| Entrez ID | Symbol | Category | Interaction Types | Drug Claim Name | Drug Name | PMIDs |
| Page: 1 |

Copyright 2023-Present -The University of Texas Health Science Center at Houston |