Schematic overview of the cellular and molecular mechanisms involved in the cancer progression, including the proposed cellular and molecular mechanisms in cancer cells trajectory. AT1: alveolar type 1 cells; AT2: alveolar type 2 cells; AAH: atypical adenomatous hyperplasia; AIS: adenocarcinoma in situ; MIA: minimally invasive adenocarcinoma; IA: invasive adenocarcinoma; EMT: epithelial-mesenchymal transition

Home

Download

Statistics

Help

Contact

Center for Computational Systems Medicine
leaf

Gene summary

leaf

Malignant transformation analysis

leaf

Malignant transformation related pathway analysis

leaf

Cell-cell communication analysis

leaf

Single-cell gene regulatory network inference analysis

leaf

Somatic mutation of malignant transformation related genes

leaf

Related drugs of malignant transformation related genes

Gene: MBD4

Gene summary for MBD4

check button Gene summary.

Gene informationSpeciesHuman
Gene symbol

MBD4

Gene ID

8930

Gene namemethyl-CpG binding domain 4, DNA glycosylase
Gene AliasMED1
Cytomap3q21.3
Gene Typeprotein-coding
GO ID

GO:0006139

UniProtAcc

O95243


Top

Malignant transformation analysis

check button Identification of the aberrant gene expression in precancerous and cancerous lesions by comparing the gene expression of stem-like cells in diseased tissues with normal stem cells
check button Malignant transformation involving gene list.
Entrez IDSymbolReplicatesSpeciesOrganTissueAdj P-valueLog2FCMalignancy
8930MBD4LZE2DHumanEsophagusHGIN1.16e-021.65e-010.0642
8930MBD4LZE2THumanEsophagusESCC1.30e-059.10e-010.082
8930MBD4LZE4THumanEsophagusESCC5.29e-155.38e-010.0811
8930MBD4LZE5THumanEsophagusESCC1.48e-043.58e-010.0514
8930MBD4LZE7THumanEsophagusESCC2.30e-121.12e+000.0667
8930MBD4LZE8THumanEsophagusESCC5.61e-112.29e-010.067
8930MBD4LZE20THumanEsophagusESCC3.49e-041.14e-010.0662
8930MBD4LZE22THumanEsophagusESCC1.09e-023.82e-010.068
8930MBD4LZE24THumanEsophagusESCC7.05e-184.97e-010.0596
8930MBD4LZE6THumanEsophagusESCC3.79e-044.70e-010.0845
8930MBD4P1T-EHumanEsophagusESCC3.09e-177.30e-010.0875
8930MBD4P2T-EHumanEsophagusESCC9.97e-731.24e+000.1177
8930MBD4P4T-EHumanEsophagusESCC3.12e-418.77e-010.1323
8930MBD4P5T-EHumanEsophagusESCC9.04e-265.55e-010.1327
8930MBD4P8T-EHumanEsophagusESCC1.45e-316.00e-010.0889
8930MBD4P9T-EHumanEsophagusESCC2.09e-215.03e-010.1131
8930MBD4P10T-EHumanEsophagusESCC1.11e-417.81e-010.116
8930MBD4P11T-EHumanEsophagusESCC1.72e-145.70e-010.1426
8930MBD4P12T-EHumanEsophagusESCC2.34e-224.67e-010.1122
8930MBD4P15T-EHumanEsophagusESCC3.04e-286.14e-010.1149
Page: 1 2 3 4 5 6 

check button Transcriptomic changes along malignancy continuum.
TissueExpression DynamicsAbbreviation
EsophagusThe image shows the transcriptomic changes along malignancy continuum.log2FC in expression of this searched gene in stem-like cells from each diseased tissue sample relative to stem-like cells in normal samples in each tissue plotted against the malignancy continuum. Samples are colored based on if they are from different disease stage.
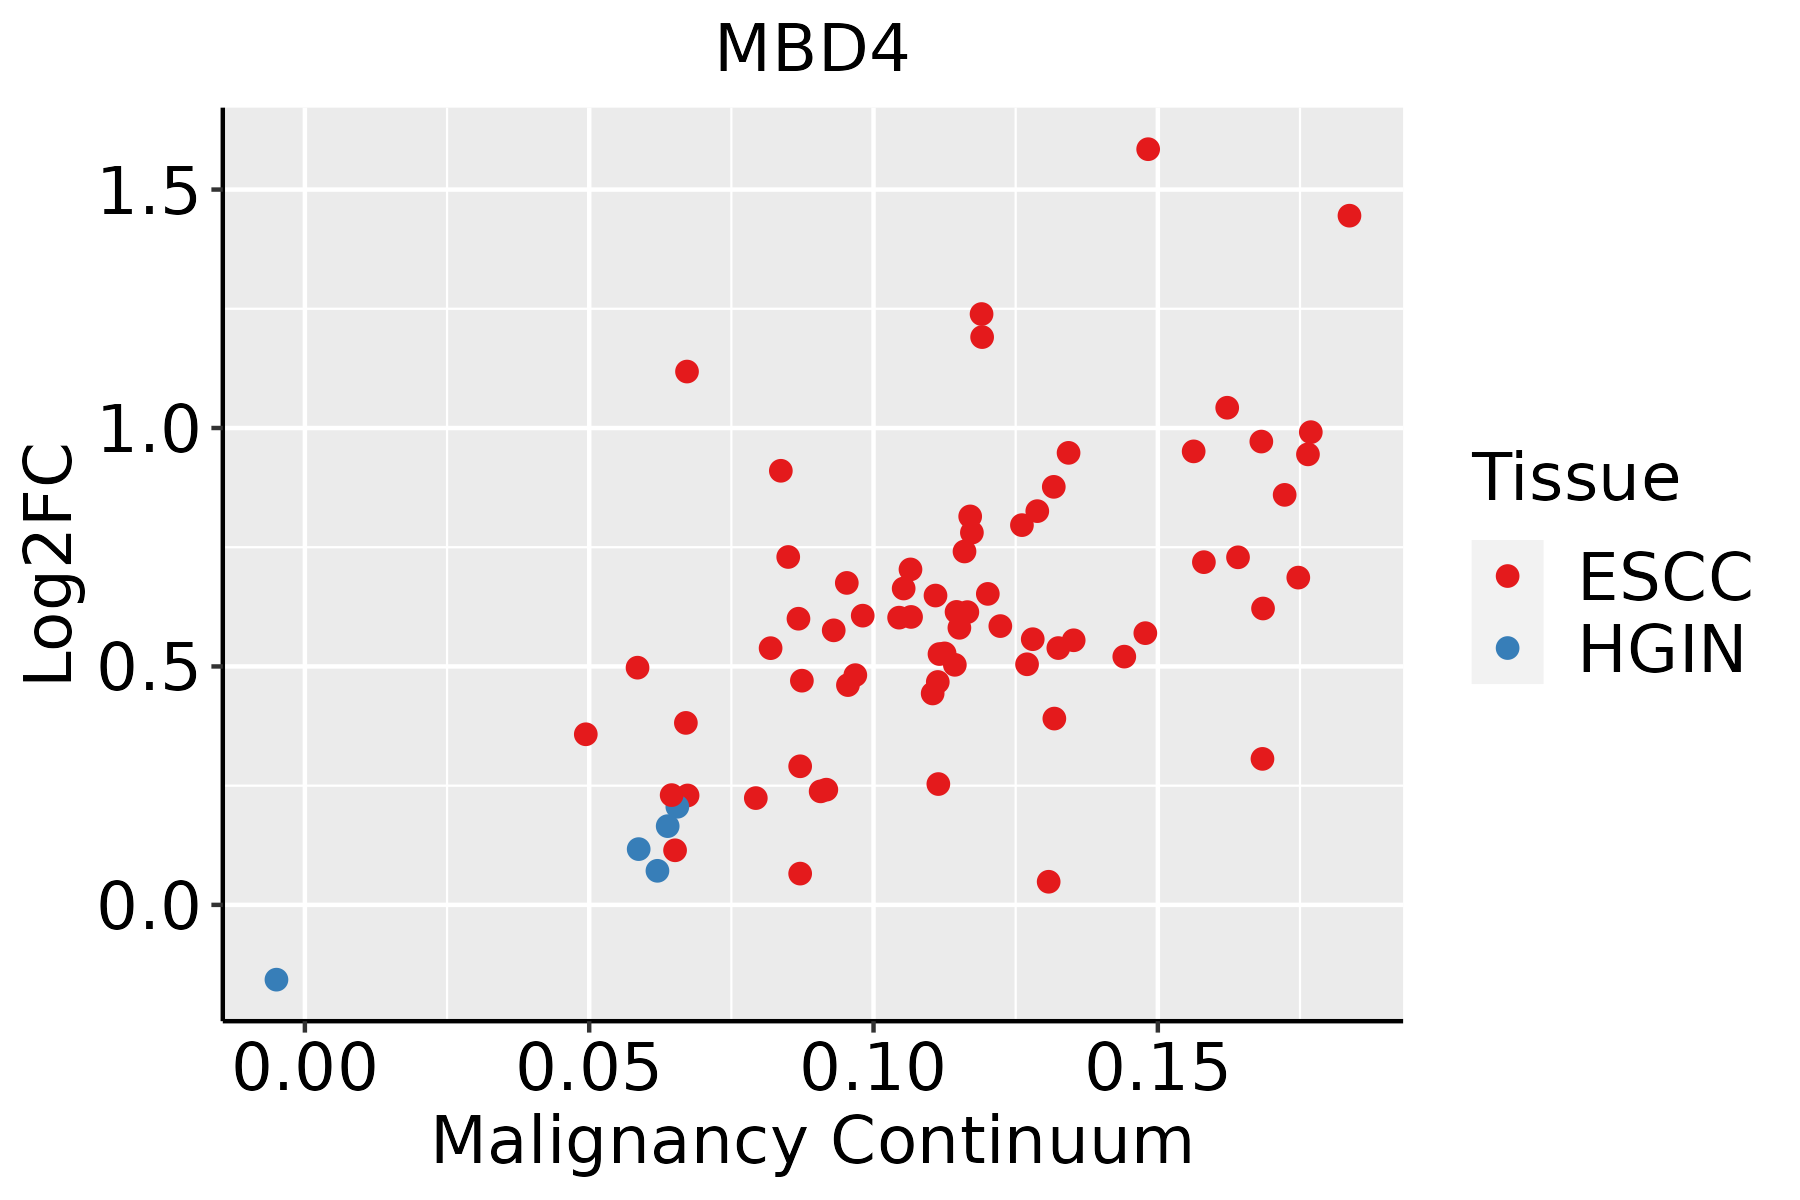
ESCC: Esophageal squamous cell carcinoma
HGIN: High-grade intraepithelial neoplasias
LGIN: Low-grade intraepithelial neoplasias
LiverThe image shows the transcriptomic changes along malignancy continuum.log2FC in expression of this searched gene in stem-like cells from each diseased tissue sample relative to stem-like cells in normal samples in each tissue plotted against the malignancy continuum. Samples are colored based on if they are from different disease stage.
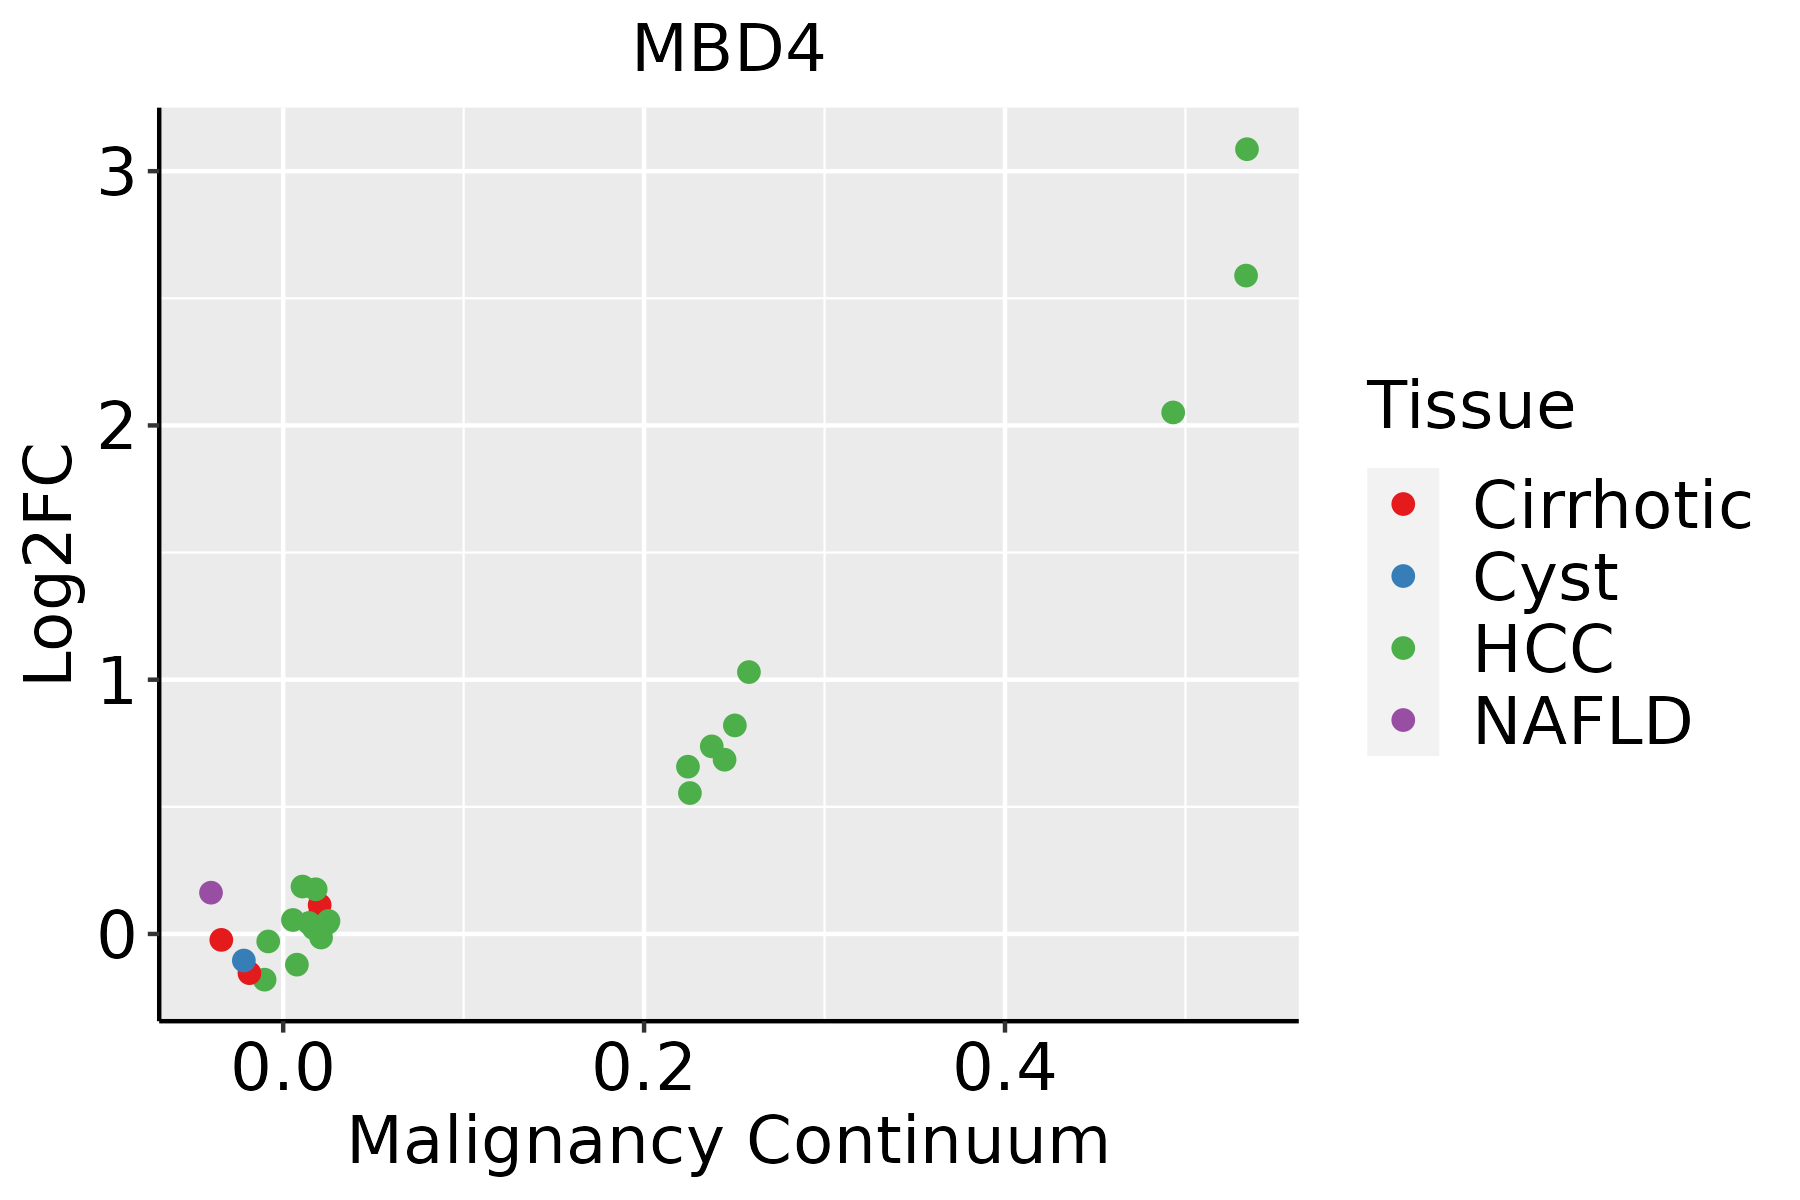
HCC: Hepatocellular carcinoma
NAFLD: Non-alcoholic fatty liver disease
Oral CavityThe image shows the transcriptomic changes along malignancy continuum.log2FC in expression of this searched gene in stem-like cells from each diseased tissue sample relative to stem-like cells in normal samples in each tissue plotted against the malignancy continuum. Samples are colored based on if they are from different disease stage.
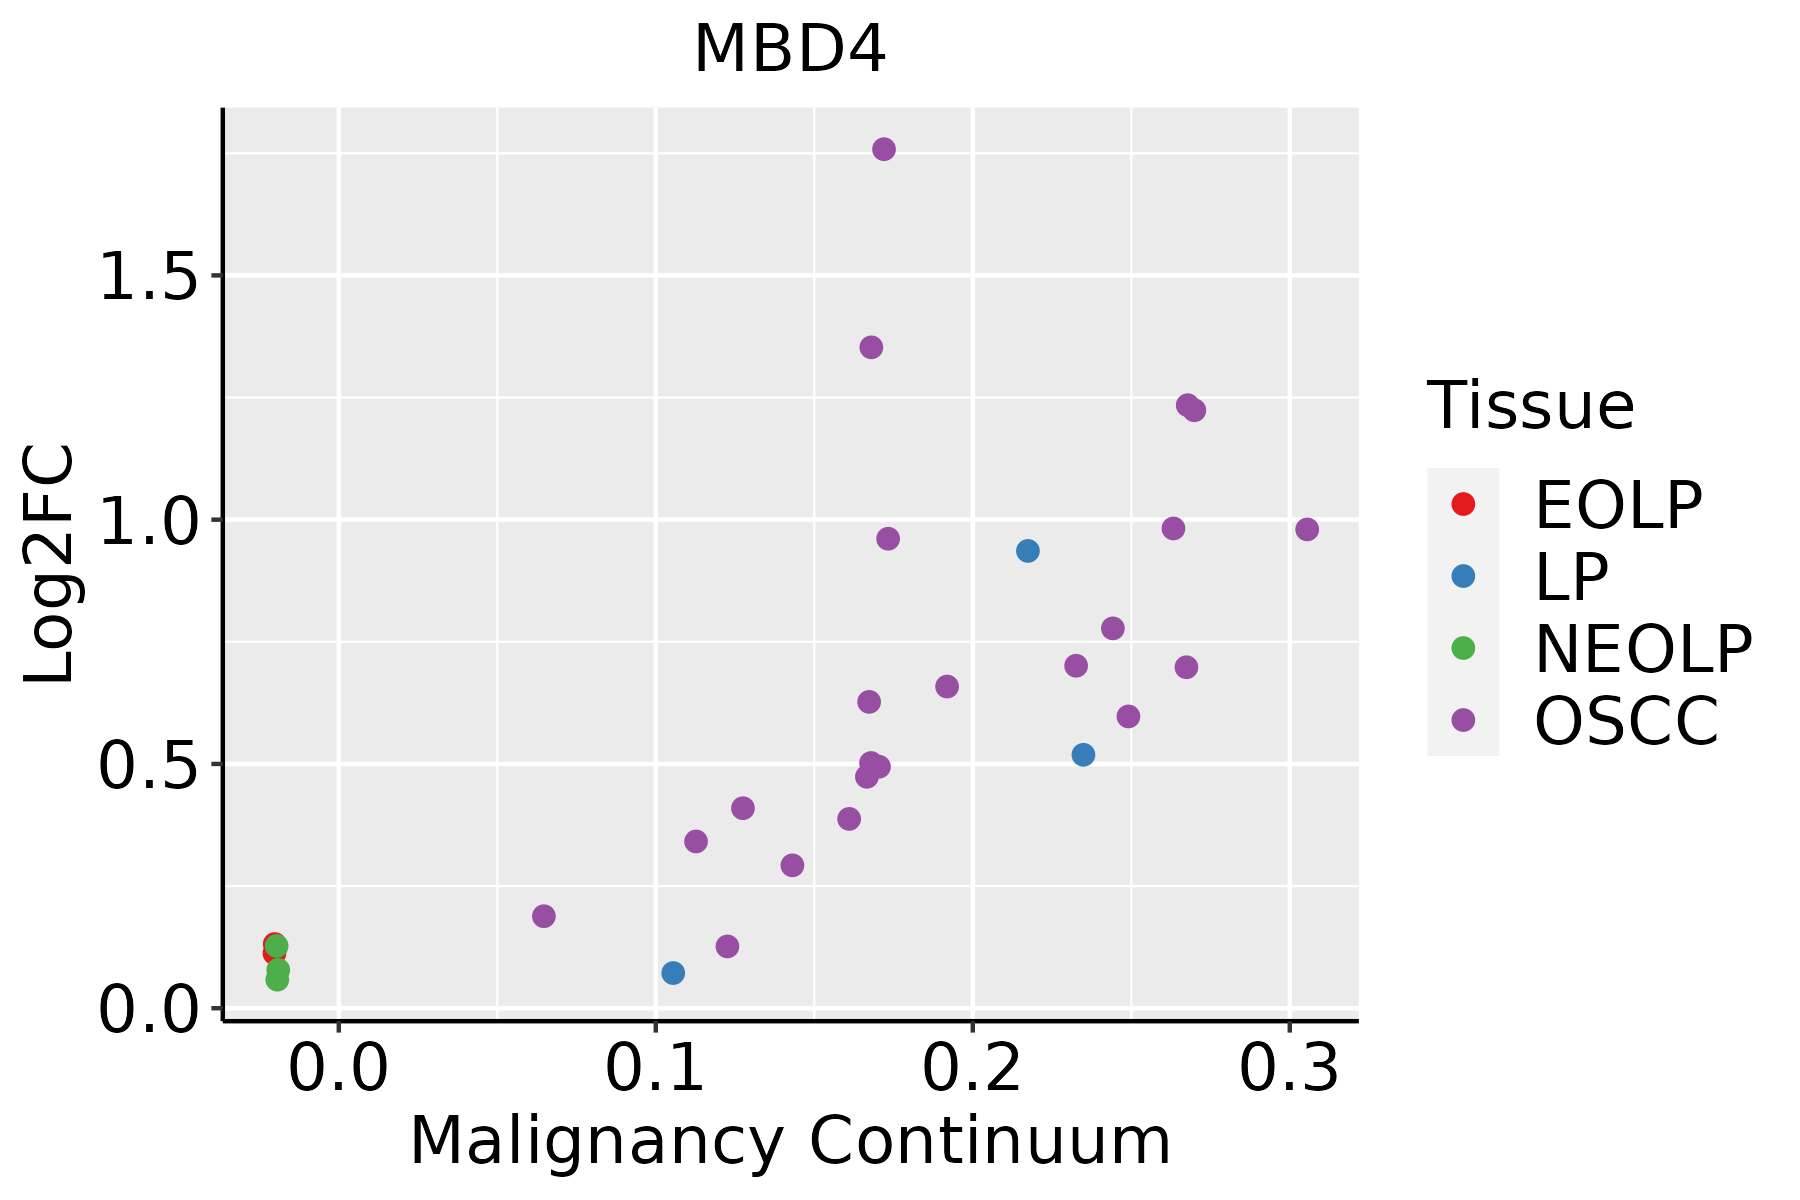
EOLP: Erosive Oral lichen planus
LP: leukoplakia
NEOLP: Non-erosive oral lichen planus
OSCC: Oral squamous cell carcinoma
SkinThe image shows the transcriptomic changes along malignancy continuum.log2FC in expression of this searched gene in stem-like cells from each diseased tissue sample relative to stem-like cells in normal samples in each tissue plotted against the malignancy continuum. Samples are colored based on if they are from different disease stage.AK: Actinic keratosis
cSCC: Cutaneous squamous cell carcinoma
SCCIS:squamous cell carcinoma in situ
ThyroidThe image shows the transcriptomic changes along malignancy continuum.log2FC in expression of this searched gene in stem-like cells from each diseased tissue sample relative to stem-like cells in normal samples in each tissue plotted against the malignancy continuum. Samples are colored based on if they are from different disease stage.
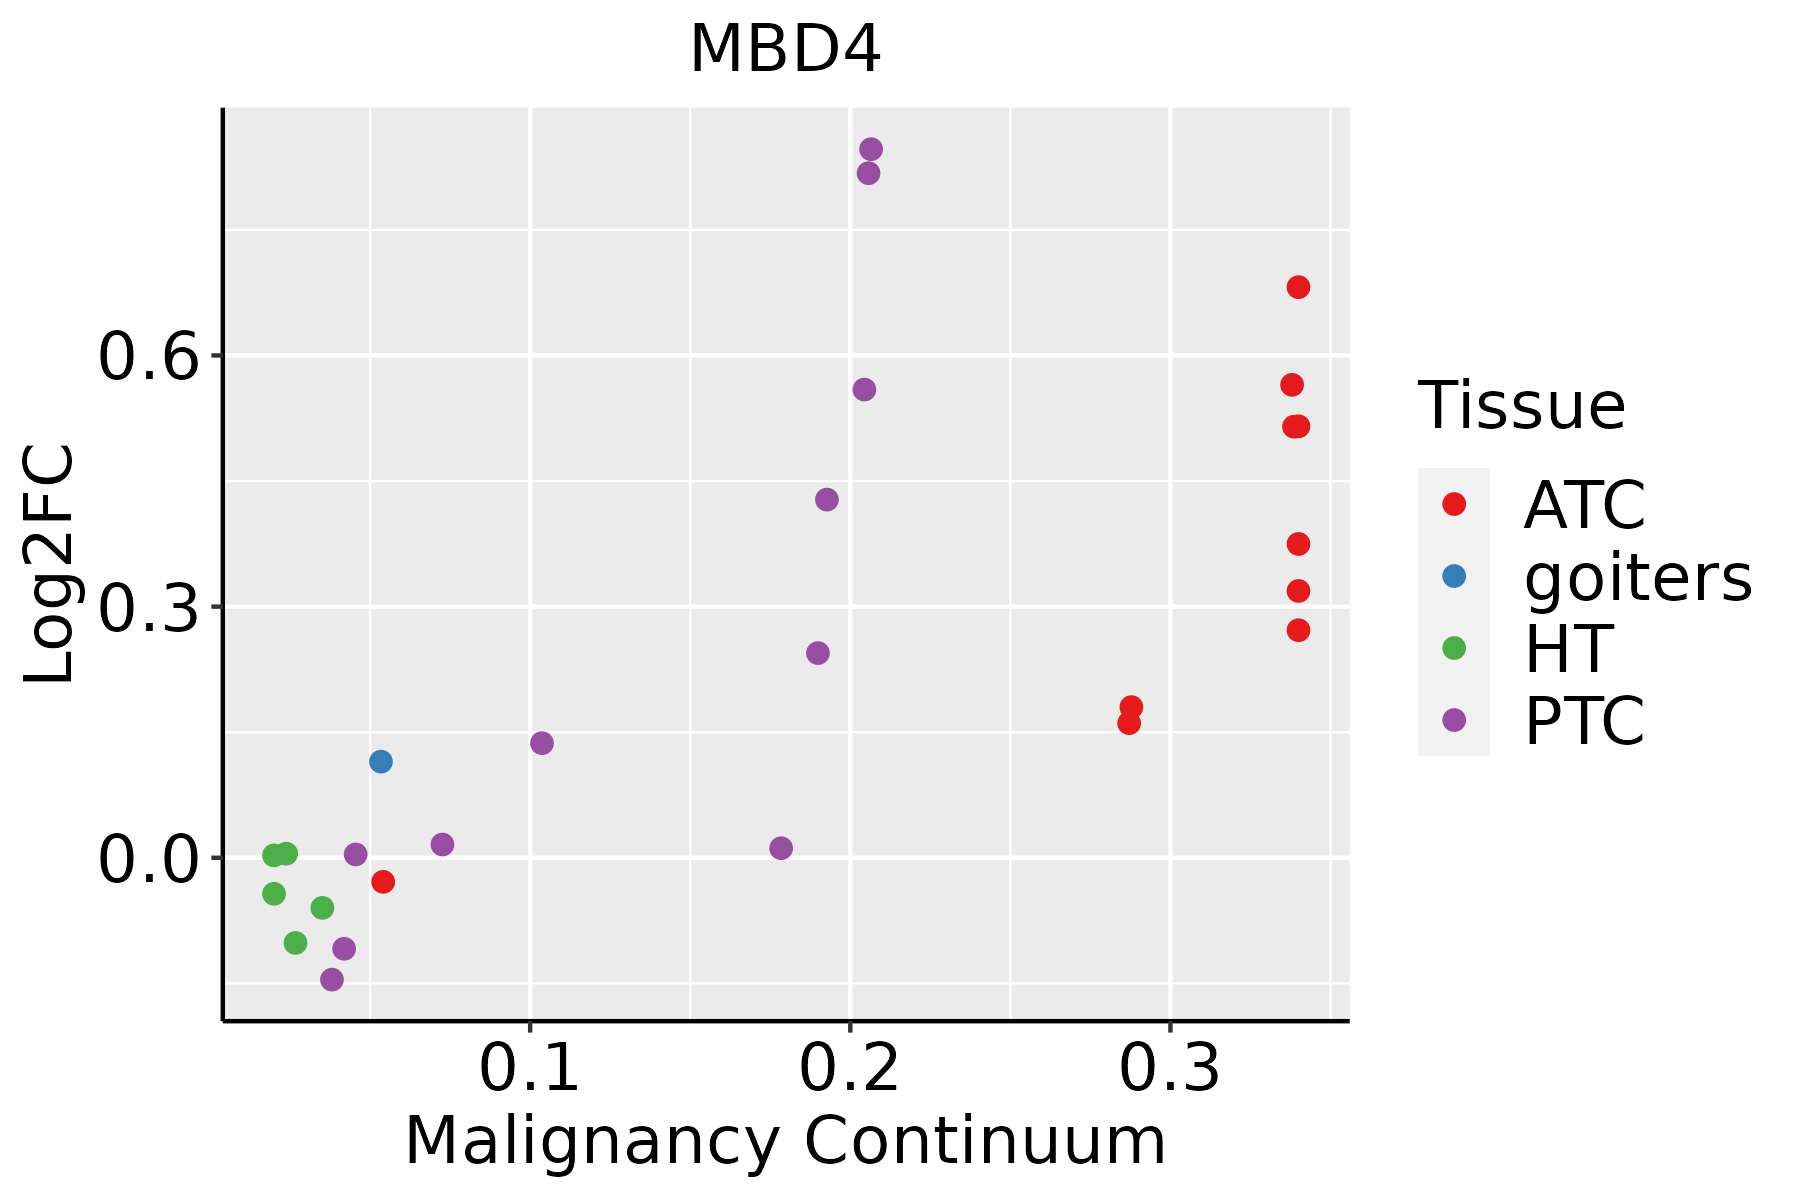
ATC: Anaplastic thyroid cancer
HT: Hashimoto's thyroiditis
PTC: Papillary thyroid cancer
∗log2FC in expression of this searched gene in stem-like cells from each diseased tissue sample relative to stem-like cells in normal samples in each tissue plotted against the malignancy continuum. Samples are colored based on if they are from different disease stage.

Top

Malignant transformation related pathway analysis

check buttonFind out the enriched GO biological processes and KEGG pathways involved in transition from healthy to precancer to cancer
check button Figure of enriched GO biological processes.
TissueDisease StageEnriched GO biological Processes
ColorectumADGO analysis - Figure of enriched GO biological processes: Top 15 enriched GO BP terms are showed in the bar plot of each disease state in each tissue. Each row represents a significant GO biological process which is colored according to the -log10(p.adjust).
ColorectumSERGO analysis - Figure of enriched GO biological processes: Top 15 enriched GO BP terms are showed in the bar plot of each disease state in each tissue. Each row represents a significant GO biological process which is colored according to the -log10(p.adjust).
ColorectumMSSGO analysis - Figure of enriched GO biological processes: Top 15 enriched GO BP terms are showed in the bar plot of each disease state in each tissue. Each row represents a significant GO biological process which is colored according to the -log10(p.adjust).
ColorectumMSI-HGO analysis - Figure of enriched GO biological processes: Top 15 enriched GO BP terms are showed in the bar plot of each disease state in each tissue. Each row represents a significant GO biological process which is colored according to the -log10(p.adjust).
ColorectumFAPGO analysis - Figure of enriched GO biological processes: Top 15 enriched GO BP terms are showed in the bar plot of each disease state in each tissue. Each row represents a significant GO biological process which is colored according to the -log10(p.adjust).
∗Top 15 enriched GO BP terms are showed in the bar plot of each disease state in each tissue. Each row represents a significant GO biological process which is colored according to the -log10(p.adjust).
Page: 1 2 3 4 5 6 7 8 9 

check button Enriched GO biological processes.
GO IDTissueDisease StageDescriptionGene RatioBg Ratiopvaluep.adjustCount
GO:003465519EsophagusHGINnucleobase-containing compound catabolic process98/2587407/187231.44e-088.94e-0798
GO:004670017EsophagusHGINheterocycle catabolic process103/2587445/187235.44e-082.99e-06103
GO:004427018EsophagusHGINcellular nitrogen compound catabolic process103/2587451/187231.10e-075.56e-06103
GO:001943917EsophagusHGINaromatic compound catabolic process105/2587467/187231.89e-079.31e-06105
GO:190136117EsophagusHGINorganic cyclic compound catabolic process106/2587495/187231.94e-067.13e-05106
GO:00196924EsophagusHGINdeoxyribose phosphate metabolic process16/258742/187237.90e-051.76e-0316
GO:00092624EsophagusHGINdeoxyribonucleotide metabolic process16/258744/187231.51e-042.97e-0316
GO:00093944EsophagusHGIN2'-deoxyribonucleotide metabolic process15/258740/187231.62e-043.16e-0315
GO:00092643EsophagusHGINdeoxyribonucleotide catabolic process12/258730/187233.62e-045.68e-0312
GO:00463863EsophagusHGINdeoxyribose phosphate catabolic process12/258731/187235.17e-047.46e-0312
GO:000911720EsophagusHGINnucleotide metabolic process92/2587489/187231.11e-031.36e-0292
GO:000675320EsophagusHGINnucleoside phosphate metabolic process93/2587497/187231.25e-031.49e-0293
GO:00092233EsophagusHGINpyrimidine deoxyribonucleotide catabolic process8/258719/187232.40e-032.41e-028
GO:0006285EsophagusHGINbase-excision repair, AP site formation6/258712/187233.03e-032.88e-026
GO:00092193EsophagusHGINpyrimidine deoxyribonucleotide metabolic process9/258724/187233.33e-033.12e-029
GO:00062442EsophagusHGINpyrimidine nucleotide catabolic process8/258721/187235.00e-034.19e-028
GO:0034655110EsophagusESCCnucleobase-containing compound catabolic process272/8552407/187232.92e-182.90e-16272
GO:004670018EsophagusESCCheterocycle catabolic process286/8552445/187231.12e-157.47e-14286
GO:004427019EsophagusESCCcellular nitrogen compound catabolic process288/8552451/187233.03e-151.79e-13288
GO:001943918EsophagusESCCaromatic compound catabolic process295/8552467/187231.09e-145.98e-13295
Page: 1 2 3 4 5 6 7 8 

check button Enriched KEGG pathways.
Pathway IDTissueDisease StageDescriptionGene RatioBg Ratiopvaluep.adjustqvalueCount
hsa034104EsophagusESCCBase excision repair38/420544/84653.59e-072.62e-061.34e-0638
hsa0341011EsophagusESCCBase excision repair38/420544/84653.59e-072.62e-061.34e-0638
hsa03410Oral cavityOSCCBase excision repair32/370444/84659.11e-053.25e-041.65e-0432
hsa034101Oral cavityOSCCBase excision repair32/370444/84659.11e-053.25e-041.65e-0432
hsa034102Oral cavityLPBase excision repair23/241844/84657.66e-043.75e-032.42e-0323
hsa034103Oral cavityLPBase excision repair23/241844/84657.66e-043.75e-032.42e-0323
Page: 1 

Top

Cell-cell communication analysis

check buttonIdentification of potential cell-cell interactions between two cell types and their ligand-receptor pairs for different disease states
LigandReceptorLRpairPathwayTissueDisease Stage
Page: 1 

Top

Single-cell gene regulatory network inference analysis

check buttonFind out the significant the regulons (TFs) and the target genes of each regulon across cell types for different disease states
TFCell TypeTissueDisease StageTarget GeneRSSRegulon Activity
MBD4CFIBColorectumADRAP2C-AS1,PXDC1,CNIH4, etc.9.59e-02The dot plots of a searched regulon are shown for all cell subpopulations in each disease state of each tissue based on the regulon specific score inferred using pySCENIC and by calculating the average expression.
MBD4CFIBColorectumCRCRAP2C-AS1,PXDC1,CNIH4, etc.8.60e-02The dot plots of a searched regulon are shown for all cell subpopulations in each disease state of each tissue based on the regulon specific score inferred using pySCENIC and by calculating the average expression.
MBD4PCVColorectumCRCRAP2C-AS1,PXDC1,CNIH4, etc.2.64e-02The dot plots of a searched regulon are shown for all cell subpopulations in each disease state of each tissue based on the regulon specific score inferred using pySCENIC and by calculating the average expression.
MBD4LYMENDColorectumMSSRAP2C-AS1,PXDC1,CNIH4, etc.4.81e-02The dot plots of a searched regulon are shown for all cell subpopulations in each disease state of each tissue based on the regulon specific score inferred using pySCENIC and by calculating the average expression.
MBD4TRANSEsophagusADJCD38,TMEM45A,CNBP, etc.3.72e-01The dot plots of a searched regulon are shown for all cell subpopulations in each disease state of each tissue based on the regulon specific score inferred using pySCENIC and by calculating the average expression.
MBD4MMCLungHealthyMBD6,ID2,ARL8A, etc.1.42e-03The dot plots of a searched regulon are shown for all cell subpopulations in each disease state of each tissue based on the regulon specific score inferred using pySCENIC and by calculating the average expression.
MBD4CD8TEREXLungMIACCREB3L2,HMGCS1,ANKRD42, etc.4.24e-02The dot plots of a searched regulon are shown for all cell subpopulations in each disease state of each tissue based on the regulon specific score inferred using pySCENIC and by calculating the average expression.
MBD4ENDOral cavityOSCCHMGA1,CYB5R1,TNFSF10, etc.1.79e-01The dot plots of a searched regulon are shown for all cell subpopulations in each disease state of each tissue based on the regulon specific score inferred using pySCENIC and by calculating the average expression.
MBD4STMPancreasADJAL121839.2,AKIP1,RND1, etc.9.56e-03The dot plots of a searched regulon are shown for all cell subpopulations in each disease state of each tissue based on the regulon specific score inferred using pySCENIC and by calculating the average expression.
MBD4DUCT2PancreasADJAL121839.2,AKIP1,RND1, etc.5.29e-03The dot plots of a searched regulon are shown for all cell subpopulations in each disease state of each tissue based on the regulon specific score inferred using pySCENIC and by calculating the average expression.
∗The dot plots of a searched regulon are shown for all cell subpopulations in each disease state of each tissue based on the regulon specific score inferred using pySCENIC and by calculating the average expression.
Page: 1 2 

Top

Somatic mutation of malignant transformation related genes

check buttonAnnotation of somatic variants for genes involved in malignant transformation
Hugo SymbolVariant ClassVariant ClassificationdbSNP RSHGVScHGVSpHGVSp ShortSWISSPROTBIOTYPESIFTPolyPhenTumor Sample BarcodeTissueHistologySexAgeStageTherapy TypesDrugsOutcome
MBD4SNVMissense_Mutationnovelc.1637N>Ap.Arg546Glnp.R546QO95243protein_codingdeleterious(0)probably_damaging(1)TCGA-AN-A046-01Breastbreast invasive carcinomaFemale>=65I/IIUnknownUnknownSD
MBD4SNVMissense_Mutationc.1483G>Cp.Asp495Hisp.D495HO95243protein_codingdeleterious(0)benign(0.311)TCGA-C8-A8HQ-01Breastbreast invasive carcinomaFemale<65I/IIUnknownUnknownSD
MBD4SNVMissense_Mutationc.58N>Ap.Val20Ilep.V20IO95243protein_codingtolerated_low_confidence(0.23)benign(0)TCGA-EW-A1IZ-01Breastbreast invasive carcinomaFemale<65III/IVChemotherapytaxotereSD
MBD4insertionFrame_Shift_Insnovelc.710_711insCCCCAAACCACAGTCTCCCACTGACCTAp.Leu238ProfsTer16p.L238Pfs*16O95243protein_codingTCGA-B6-A0I6-01Breastbreast invasive carcinomaFemale<65I/IIUnknownUnknownPD
MBD4SNVMissense_Mutationrs776001887c.208G>Ap.Ala70Thrp.A70TO95243protein_codingdeleterious(0.04)benign(0.005)TCGA-2W-A8YY-01Cervixcervical & endocervical cancerFemale<65I/IIChemotherapycisplatinCR
MBD4SNVMissense_Mutationc.932N>Cp.Lys311Thrp.K311TO95243protein_codingtolerated(0.36)benign(0.021)TCGA-FU-A3HZ-01Cervixcervical & endocervical cancerFemale<65I/IIChemotherapycisplatinCR
MBD4SNVMissense_Mutationrs776001887c.208N>Ap.Ala70Thrp.A70TO95243protein_codingdeleterious(0.04)benign(0.005)TCGA-VS-A94Z-01Cervixcervical & endocervical cancerFemale<65I/IIChemotherapycisplatinCR
MBD4SNVMissense_Mutationnovelc.1460N>Tp.Ser487Leup.S487LO95243protein_codingdeleterious(0)probably_damaging(0.986)TCGA-ZJ-AAXT-01Cervixcervical & endocervical cancerFemale<65III/IVUnknownUnknownSD
MBD4SNVMissense_Mutationrs755035506c.139N>Ap.Gly47Argp.G47RO95243protein_codingtolerated(0.77)benign(0)TCGA-A6-6137-01Colorectumcolon adenocarcinomaMale<65III/IVChemotherapyfluorouracilSD
MBD4SNVMissense_Mutationnovelc.1666G>Ap.Val556Metp.V556MO95243protein_codingdeleterious(0)probably_damaging(1)TCGA-AA-3971-01Colorectumcolon adenocarcinomaMale<65III/IVChemotherapyfolinicCR
Page: 1 2 3 4 5 6 

Top

Related drugs of malignant transformation related genes

check buttonIdentification of chemicals and drugs interact with genes involved in malignant transfromation
(DGIdb 4.0)
Entrez IDSymbolCategoryInteraction TypesDrug Claim NameDrug NamePMIDs
8930MBD4DNA REPAIRPD1 INHIBITOR29760383
Page: 1