
|
|||||
|
 | |
| |
| |
| |
| |
| |
|
Gene: MBD1 |
Gene summary for MBD1 |
| Gene information | Species | Human | Gene symbol | MBD1 | Gene ID | 4152 |
| Gene name | methyl-CpG binding domain protein 1 | |
| Gene Alias | CXXC3 | |
| Cytomap | 18q21.1 | |
| Gene Type | protein-coding | GO ID | GO:0006139 | UniProtAcc | A8K654 |
Top |
Malignant transformation analysis |
| Identification of the aberrant gene expression in precancerous and cancerous lesions by comparing the gene expression of stem-like cells in diseased tissues with normal stem cells |
| Entrez ID | Symbol | Replicates | Species | Organ | Tissue | Adj P-value | Log2FC | Malignancy |
| 4152 | MBD1 | LZE4T | Human | Esophagus | ESCC | 1.12e-03 | 2.44e-01 | 0.0811 |
| 4152 | MBD1 | LZE7T | Human | Esophagus | ESCC | 1.32e-07 | 4.00e-01 | 0.0667 |
| 4152 | MBD1 | LZE8T | Human | Esophagus | ESCC | 4.49e-02 | 8.70e-02 | 0.067 |
| 4152 | MBD1 | LZE20T | Human | Esophagus | ESCC | 1.44e-05 | 7.30e-02 | 0.0662 |
| 4152 | MBD1 | LZE24T | Human | Esophagus | ESCC | 5.11e-09 | 2.19e-01 | 0.0596 |
| 4152 | MBD1 | P1T-E | Human | Esophagus | ESCC | 1.10e-13 | 5.22e-01 | 0.0875 |
| 4152 | MBD1 | P2T-E | Human | Esophagus | ESCC | 3.64e-20 | 3.44e-01 | 0.1177 |
| 4152 | MBD1 | P4T-E | Human | Esophagus | ESCC | 3.02e-17 | 4.94e-01 | 0.1323 |
| 4152 | MBD1 | P5T-E | Human | Esophagus | ESCC | 7.92e-13 | 1.46e-01 | 0.1327 |
| 4152 | MBD1 | P8T-E | Human | Esophagus | ESCC | 1.19e-13 | 3.69e-01 | 0.0889 |
| 4152 | MBD1 | P9T-E | Human | Esophagus | ESCC | 9.67e-15 | 4.04e-01 | 0.1131 |
| 4152 | MBD1 | P10T-E | Human | Esophagus | ESCC | 2.60e-29 | 3.42e-01 | 0.116 |
| 4152 | MBD1 | P11T-E | Human | Esophagus | ESCC | 1.64e-05 | 2.17e-01 | 0.1426 |
| 4152 | MBD1 | P12T-E | Human | Esophagus | ESCC | 2.61e-08 | 2.50e-01 | 0.1122 |
| 4152 | MBD1 | P15T-E | Human | Esophagus | ESCC | 6.58e-11 | 2.34e-01 | 0.1149 |
| 4152 | MBD1 | P16T-E | Human | Esophagus | ESCC | 2.35e-22 | 3.36e-01 | 0.1153 |
| 4152 | MBD1 | P17T-E | Human | Esophagus | ESCC | 2.38e-10 | 1.93e-01 | 0.1278 |
| 4152 | MBD1 | P19T-E | Human | Esophagus | ESCC | 6.59e-05 | 5.82e-01 | 0.1662 |
| 4152 | MBD1 | P20T-E | Human | Esophagus | ESCC | 3.62e-20 | 4.22e-01 | 0.1124 |
| 4152 | MBD1 | P21T-E | Human | Esophagus | ESCC | 3.89e-16 | 3.88e-01 | 0.1617 |
| Page: 1 2 3 4 5 |
| Tissue | Expression Dynamics | Abbreviation |
| Esophagus |  | ESCC: Esophageal squamous cell carcinoma |
| HGIN: High-grade intraepithelial neoplasias | ||
| LGIN: Low-grade intraepithelial neoplasias | ||
| Liver | 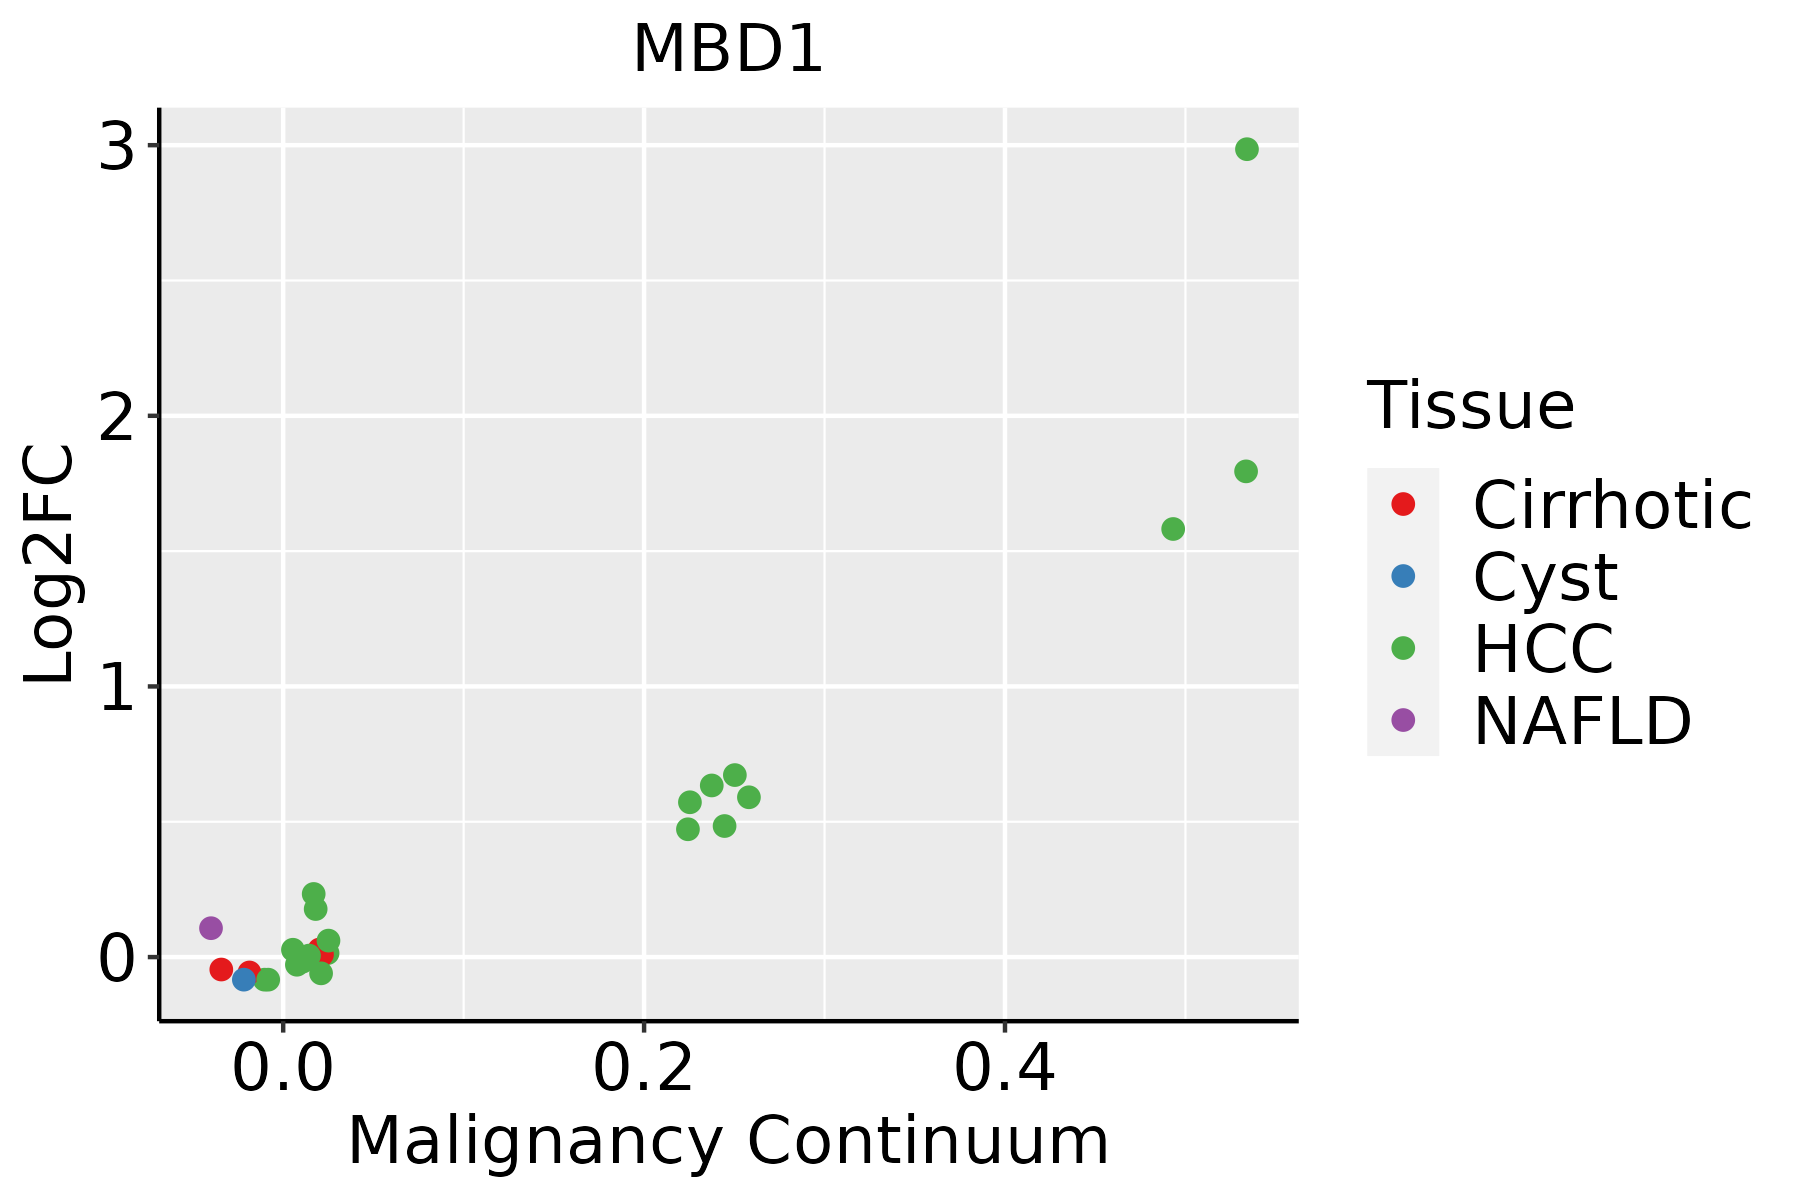 | HCC: Hepatocellular carcinoma |
| NAFLD: Non-alcoholic fatty liver disease | ||
| Oral Cavity | 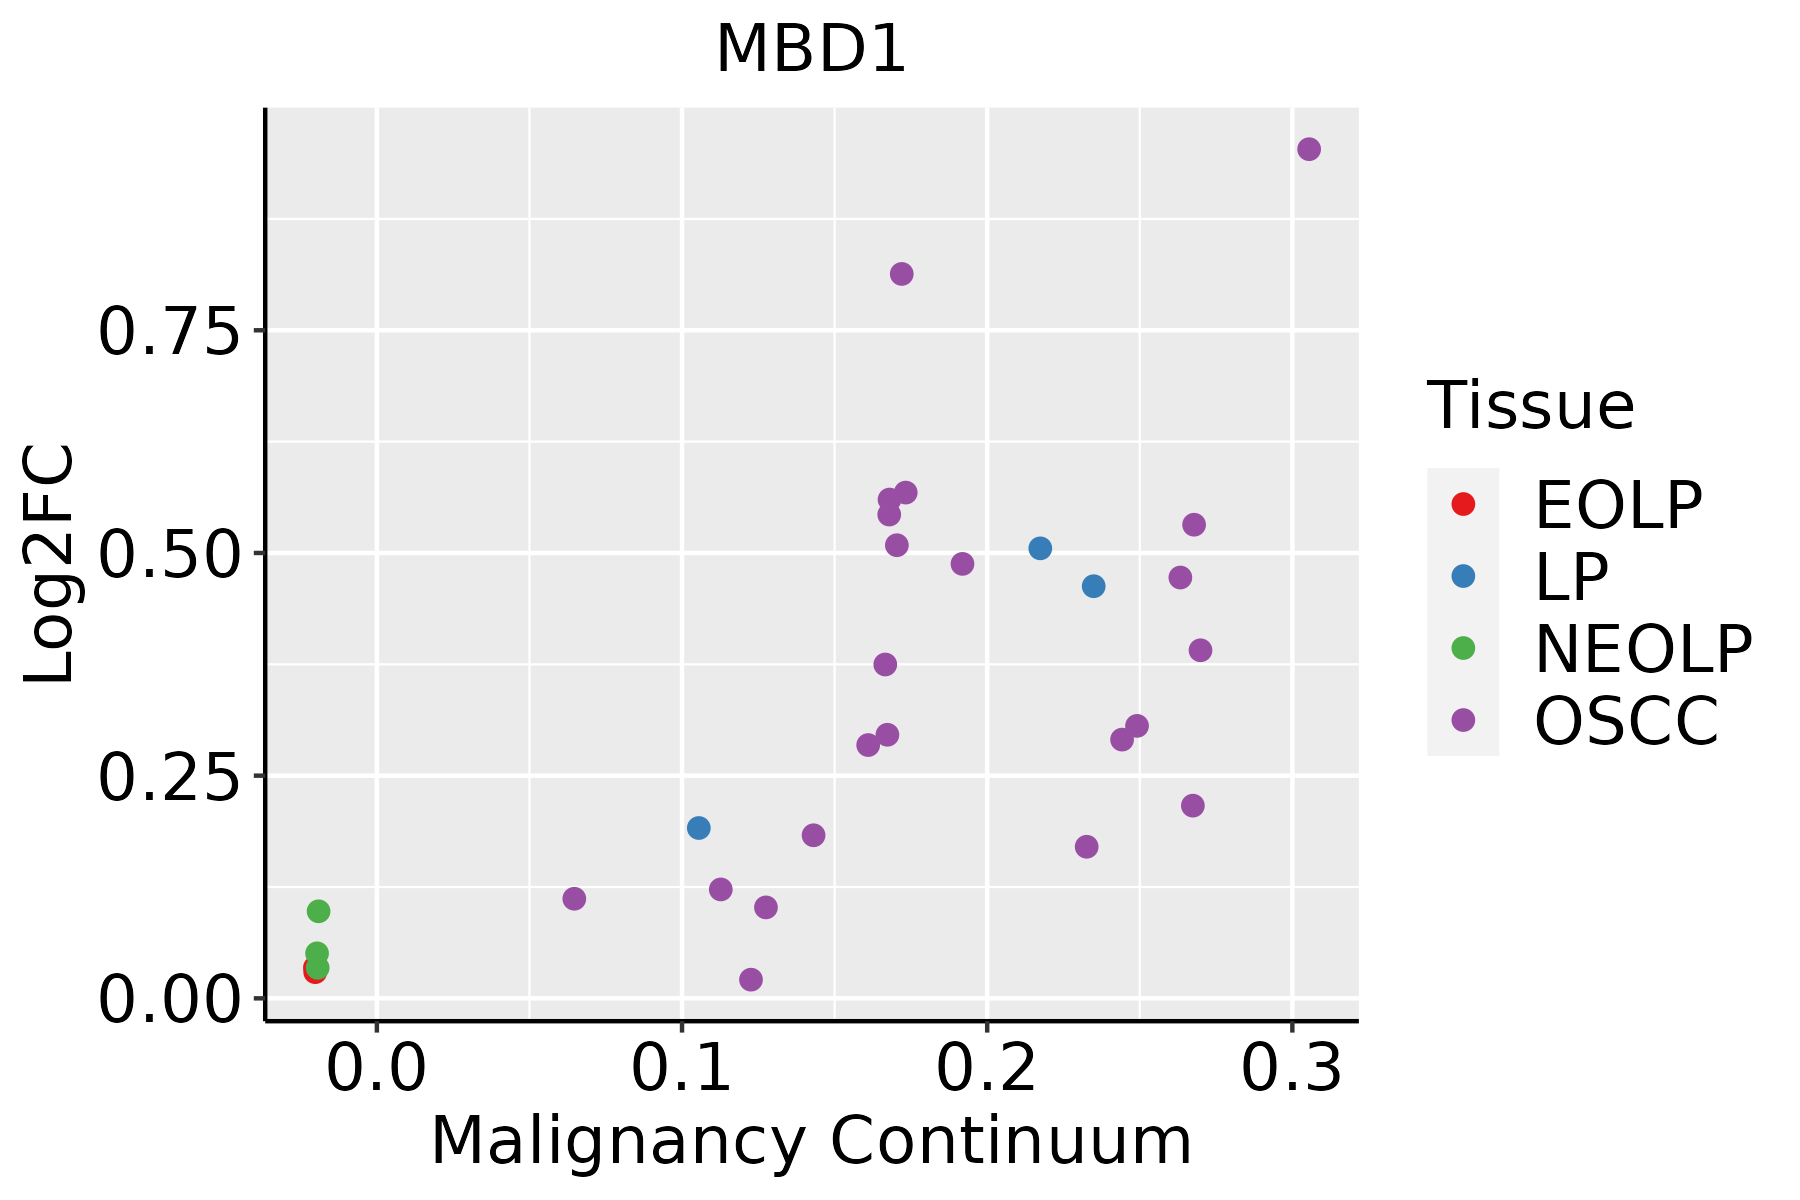 | EOLP: Erosive Oral lichen planus |
| LP: leukoplakia | ||
| NEOLP: Non-erosive oral lichen planus | ||
| OSCC: Oral squamous cell carcinoma |
| ∗log2FC in expression of this searched gene in stem-like cells from each diseased tissue sample relative to stem-like cells in normal samples in each tissue plotted against the malignancy continuum. Samples are colored based on if they are from different disease stage. |
Top |
Malignant transformation related pathway analysis |
| Find out the enriched GO biological processes and KEGG pathways involved in transition from healthy to precancer to cancer |
| Tissue | Disease Stage | Enriched GO biological Processes |
| Colorectum | AD |  |
| Colorectum | SER |  |
| Colorectum | MSS |  |
| Colorectum | MSI-H |  |
| Colorectum | FAP |  |
| ∗Top 15 enriched GO BP terms are showed in the bar plot of each disease state in each tissue. Each row represents a significant GO biological process which is colored according to the -log10(p.adjust). |
| Page: 1 2 3 4 5 6 7 8 9 |
| GO ID | Tissue | Disease Stage | Description | Gene Ratio | Bg Ratio | pvalue | p.adjust | Count |
| GO:005105215 | Esophagus | ESCC | regulation of DNA metabolic process | 232/8552 | 359/18723 | 2.40e-13 | 1.13e-11 | 232 |
| GO:0031667111 | Esophagus | ESCC | response to nutrient levels | 289/8552 | 474/18723 | 9.25e-12 | 3.47e-10 | 289 |
| GO:00434143 | Esophagus | ESCC | macromolecule methylation | 199/8552 | 316/18723 | 3.44e-10 | 9.57e-09 | 199 |
| GO:00322592 | Esophagus | ESCC | methylation | 222/8552 | 364/18723 | 2.26e-09 | 5.09e-08 | 222 |
| GO:000756820 | Esophagus | ESCC | aging | 201/8552 | 339/18723 | 2.64e-07 | 3.94e-06 | 201 |
| GO:00420636 | Esophagus | ESCC | gliogenesis | 172/8552 | 301/18723 | 3.75e-05 | 3.04e-04 | 172 |
| GO:000941020 | Esophagus | ESCC | response to xenobiotic stimulus | 253/8552 | 462/18723 | 4.55e-05 | 3.58e-04 | 253 |
| GO:005076710 | Esophagus | ESCC | regulation of neurogenesis | 203/8552 | 364/18723 | 6.10e-05 | 4.68e-04 | 203 |
| GO:00100016 | Esophagus | ESCC | glial cell differentiation | 129/8552 | 225/18723 | 2.73e-04 | 1.65e-03 | 129 |
| GO:00519606 | Esophagus | ESCC | regulation of nervous system development | 237/8552 | 443/18723 | 5.02e-04 | 2.78e-03 | 237 |
| GO:0006304 | Esophagus | ESCC | DNA modification | 68/8552 | 120/18723 | 9.95e-03 | 3.42e-02 | 68 |
| GO:00140131 | Esophagus | ESCC | regulation of gliogenesis | 59/8552 | 103/18723 | 1.17e-02 | 3.91e-02 | 59 |
| GO:003166722 | Liver | HCC | response to nutrient levels | 276/7958 | 474/18723 | 2.30e-12 | 1.08e-10 | 276 |
| GO:00434141 | Liver | HCC | macromolecule methylation | 183/7958 | 316/18723 | 2.00e-08 | 4.72e-07 | 183 |
| GO:0032259 | Liver | HCC | methylation | 206/7958 | 364/18723 | 3.35e-08 | 7.53e-07 | 206 |
| GO:000941022 | Liver | HCC | response to xenobiotic stimulus | 248/7958 | 462/18723 | 6.47e-07 | 1.02e-05 | 248 |
| GO:005105221 | Liver | HCC | regulation of DNA metabolic process | 198/7958 | 359/18723 | 7.62e-07 | 1.17e-05 | 198 |
| GO:000756822 | Liver | HCC | aging | 185/7958 | 339/18723 | 4.28e-06 | 5.50e-05 | 185 |
| GO:00323552 | Liver | HCC | response to estradiol | 81/7958 | 141/18723 | 2.39e-04 | 1.79e-03 | 81 |
| GO:00507674 | Liver | HCC | regulation of neurogenesis | 181/7958 | 364/18723 | 3.00e-03 | 1.40e-02 | 181 |
| Page: 1 2 3 |
| Pathway ID | Tissue | Disease Stage | Description | Gene Ratio | Bg Ratio | pvalue | p.adjust | qvalue | Count |
| Page: 1 |
Top |
Cell-cell communication analysis |
| Identification of potential cell-cell interactions between two cell types and their ligand-receptor pairs for different disease states |
| Ligand | Receptor | LRpair | Pathway | Tissue | Disease Stage |
| Page: 1 |
Top |
Single-cell gene regulatory network inference analysis |
| Find out the significant the regulons (TFs) and the target genes of each regulon across cell types for different disease states |
| TF | Cell Type | Tissue | Disease Stage | Target Gene | RSS | Regulon Activity |
| MBD1 | TFH | Breast | Precancer | CHI3L1,USPL1,ADTRP, etc. | 3.54e-02 |  |
| ∗The dot plots of a searched regulon are shown for all cell subpopulations in each disease state of each tissue based on the regulon specific score inferred using pySCENIC and by calculating the average expression. |
| Page: 1 |
Top |
Somatic mutation of malignant transformation related genes |
| Annotation of somatic variants for genes involved in malignant transformation |
| Hugo Symbol | Variant Class | Variant Classification | dbSNP RS | HGVSc | HGVSp | HGVSp Short | SWISSPROT | BIOTYPE | SIFT | PolyPhen | Tumor Sample Barcode | Tissue | Histology | Sex | Age | Stage | Therapy Types | Drugs | Outcome |
| MBD1 | SNV | Missense_Mutation | novel | c.1763N>T | p.Ala588Val | p.A588V | Q9UIS9 | protein_coding | deleterious_low_confidence(0) | benign(0.412) | TCGA-AO-A0JD-01 | Breast | breast invasive carcinoma | Female | <65 | III/IV | Chemotherapy | cyclophosphamide | SD |
| MBD1 | SNV | Missense_Mutation | rs545375854 | c.455N>T | p.Thr152Met | p.T152M | Q9UIS9 | protein_coding | deleterious(0.01) | probably_damaging(0.999) | TCGA-BH-A0HA-01 | Breast | breast invasive carcinoma | Female | <65 | I/II | Unknown | Unknown | SD |
| MBD1 | SNV | Missense_Mutation | c.640N>T | p.Arg214Cys | p.R214C | Q9UIS9 | protein_coding | deleterious(0) | probably_damaging(0.998) | TCGA-E2-A15K-06 | Breast | breast invasive carcinoma | Female | <65 | I/II | Chemotherapy | adriamycin | SD | |
| MBD1 | insertion | Frame_Shift_Ins | novel | c.1760_1761insTGAATATTTTCTTTTAATT | p.Ala588GlufsTer25 | p.A588Efs*25 | Q9UIS9 | protein_coding | TCGA-AO-A0JD-01 | Breast | breast invasive carcinoma | Female | <65 | III/IV | Chemotherapy | cyclophosphamide | SD | ||
| MBD1 | deletion | Frame_Shift_Del | c.1592delA | p.Asp531AlafsTer7 | p.D531Afs*7 | Q9UIS9 | protein_coding | TCGA-AR-A0TX-01 | Breast | breast invasive carcinoma | Female | <65 | I/II | Unknown | Unknown | SD | |||
| MBD1 | deletion | Frame_Shift_Del | novel | c.83delN | p.Cys28LeufsTer22 | p.C28Lfs*22 | Q9UIS9 | protein_coding | TCGA-D8-A27V-01 | Breast | breast invasive carcinoma | Female | <65 | I/II | Hormone Therapy | tamoxiphen | SD | ||
| MBD1 | deletion | Frame_Shift_Del | novel | c.1205delN | p.Pro402LeufsTer20 | p.P402Lfs*20 | Q9UIS9 | protein_coding | TCGA-EW-A2FV-01 | Breast | breast invasive carcinoma | Female | <65 | III/IV | Chemotherapy | docetaxel | SD | ||
| MBD1 | SNV | Missense_Mutation | rs775229161 | c.1282N>T | p.Arg428Cys | p.R428C | Q9UIS9 | protein_coding | tolerated(0.16) | benign(0.007) | TCGA-2W-A8YY-01 | Cervix | cervical & endocervical cancer | Female | <65 | I/II | Chemotherapy | cisplatin | CR |
| MBD1 | SNV | Missense_Mutation | novel | c.297N>T | p.Gln99His | p.Q99H | Q9UIS9 | protein_coding | tolerated(0.14) | probably_damaging(0.996) | TCGA-2W-A8YY-01 | Cervix | cervical & endocervical cancer | Female | <65 | I/II | Chemotherapy | cisplatin | CR |
| MBD1 | SNV | Missense_Mutation | novel | c.55N>A | p.Glu19Lys | p.E19K | Q9UIS9 | protein_coding | deleterious(0.01) | probably_damaging(0.993) | TCGA-2W-A8YY-01 | Cervix | cervical & endocervical cancer | Female | <65 | I/II | Chemotherapy | cisplatin | CR |
| Page: 1 2 3 4 5 6 7 8 9 10 11 12 |
Top |
Related drugs of malignant transformation related genes |
| Identification of chemicals and drugs interact with genes involved in malignant transfromation |
| (DGIdb 4.0) |
| Entrez ID | Symbol | Category | Interaction Types | Drug Claim Name | Drug Name | PMIDs |
| Page: 1 |

Copyright 2023-Present -The University of Texas Health Science Center at Houston |