
|
|||||
|
 | |
| |
| |
| |
| |
| |
|
Gene: MAZ |
Gene summary for MAZ |
| Gene information | Species | Human | Gene symbol | MAZ | Gene ID | 4150 |
| Gene name | MYC associated zinc finger protein | |
| Gene Alias | PUR1 | |
| Cytomap | 16p11.2 | |
| Gene Type | protein-coding | GO ID | GO:0000122 | UniProtAcc | P56270 |
Top |
Malignant transformation analysis |
| Identification of the aberrant gene expression in precancerous and cancerous lesions by comparing the gene expression of stem-like cells in diseased tissues with normal stem cells |
| Entrez ID | Symbol | Replicates | Species | Organ | Tissue | Adj P-value | Log2FC | Malignancy |
| 4150 | MAZ | GSM4909293 | Human | Breast | IDC | 1.29e-06 | 2.38e-01 | 0.1581 |
| 4150 | MAZ | GSM4909297 | Human | Breast | IDC | 1.31e-03 | -1.58e-01 | 0.1517 |
| 4150 | MAZ | GSM4909304 | Human | Breast | IDC | 6.10e-25 | 5.20e-01 | 0.1636 |
| 4150 | MAZ | GSM4909306 | Human | Breast | IDC | 3.73e-03 | 2.82e-01 | 0.1564 |
| 4150 | MAZ | GSM4909311 | Human | Breast | IDC | 4.07e-10 | -7.51e-02 | 0.1534 |
| 4150 | MAZ | GSM4909312 | Human | Breast | IDC | 4.69e-02 | 6.05e-02 | 0.1552 |
| 4150 | MAZ | GSM4909313 | Human | Breast | IDC | 2.51e-02 | 2.20e-03 | 0.0391 |
| 4150 | MAZ | GSM4909319 | Human | Breast | IDC | 9.93e-14 | -5.46e-02 | 0.1563 |
| 4150 | MAZ | GSM4909321 | Human | Breast | IDC | 2.51e-04 | -2.78e-03 | 0.1559 |
| 4150 | MAZ | M1 | Human | Breast | IDC | 7.04e-04 | 3.40e-01 | 0.1577 |
| 4150 | MAZ | NCCBC11 | Human | Breast | DCIS | 2.20e-02 | 3.65e-01 | 0.1232 |
| 4150 | MAZ | NCCBC14 | Human | Breast | DCIS | 1.26e-03 | 1.62e-01 | 0.2021 |
| 4150 | MAZ | NCCBC2 | Human | Breast | DCIS | 1.31e-02 | 2.58e-01 | 0.1554 |
| 4150 | MAZ | NCCBC6 | Human | Breast | DCIS | 1.52e-06 | 6.36e-01 | 0.2095 |
| 4150 | MAZ | P1 | Human | Breast | IDC | 2.42e-06 | 1.12e-01 | 0.1527 |
| 4150 | MAZ | P2 | Human | Breast | IDC | 3.62e-02 | 2.40e-01 | 0.21 |
| 4150 | MAZ | DCIS2 | Human | Breast | DCIS | 1.77e-30 | 7.69e-02 | 0.0085 |
| 4150 | MAZ | LZE4T | Human | Esophagus | ESCC | 3.29e-05 | 1.22e-01 | 0.0811 |
| 4150 | MAZ | LZE8T | Human | Esophagus | ESCC | 7.46e-07 | 7.60e-02 | 0.067 |
| 4150 | MAZ | LZE20T | Human | Esophagus | ESCC | 3.02e-05 | 1.64e-01 | 0.0662 |
| Page: 1 2 3 4 5 6 7 |
| Tissue | Expression Dynamics | Abbreviation |
| Breast |  | IDC: Invasive ductal carcinoma |
| DCIS: Ductal carcinoma in situ | ||
| Precancer(BRCA1-mut): Precancerous lesion from BRCA1 mutation carriers | ||
| Esophagus | 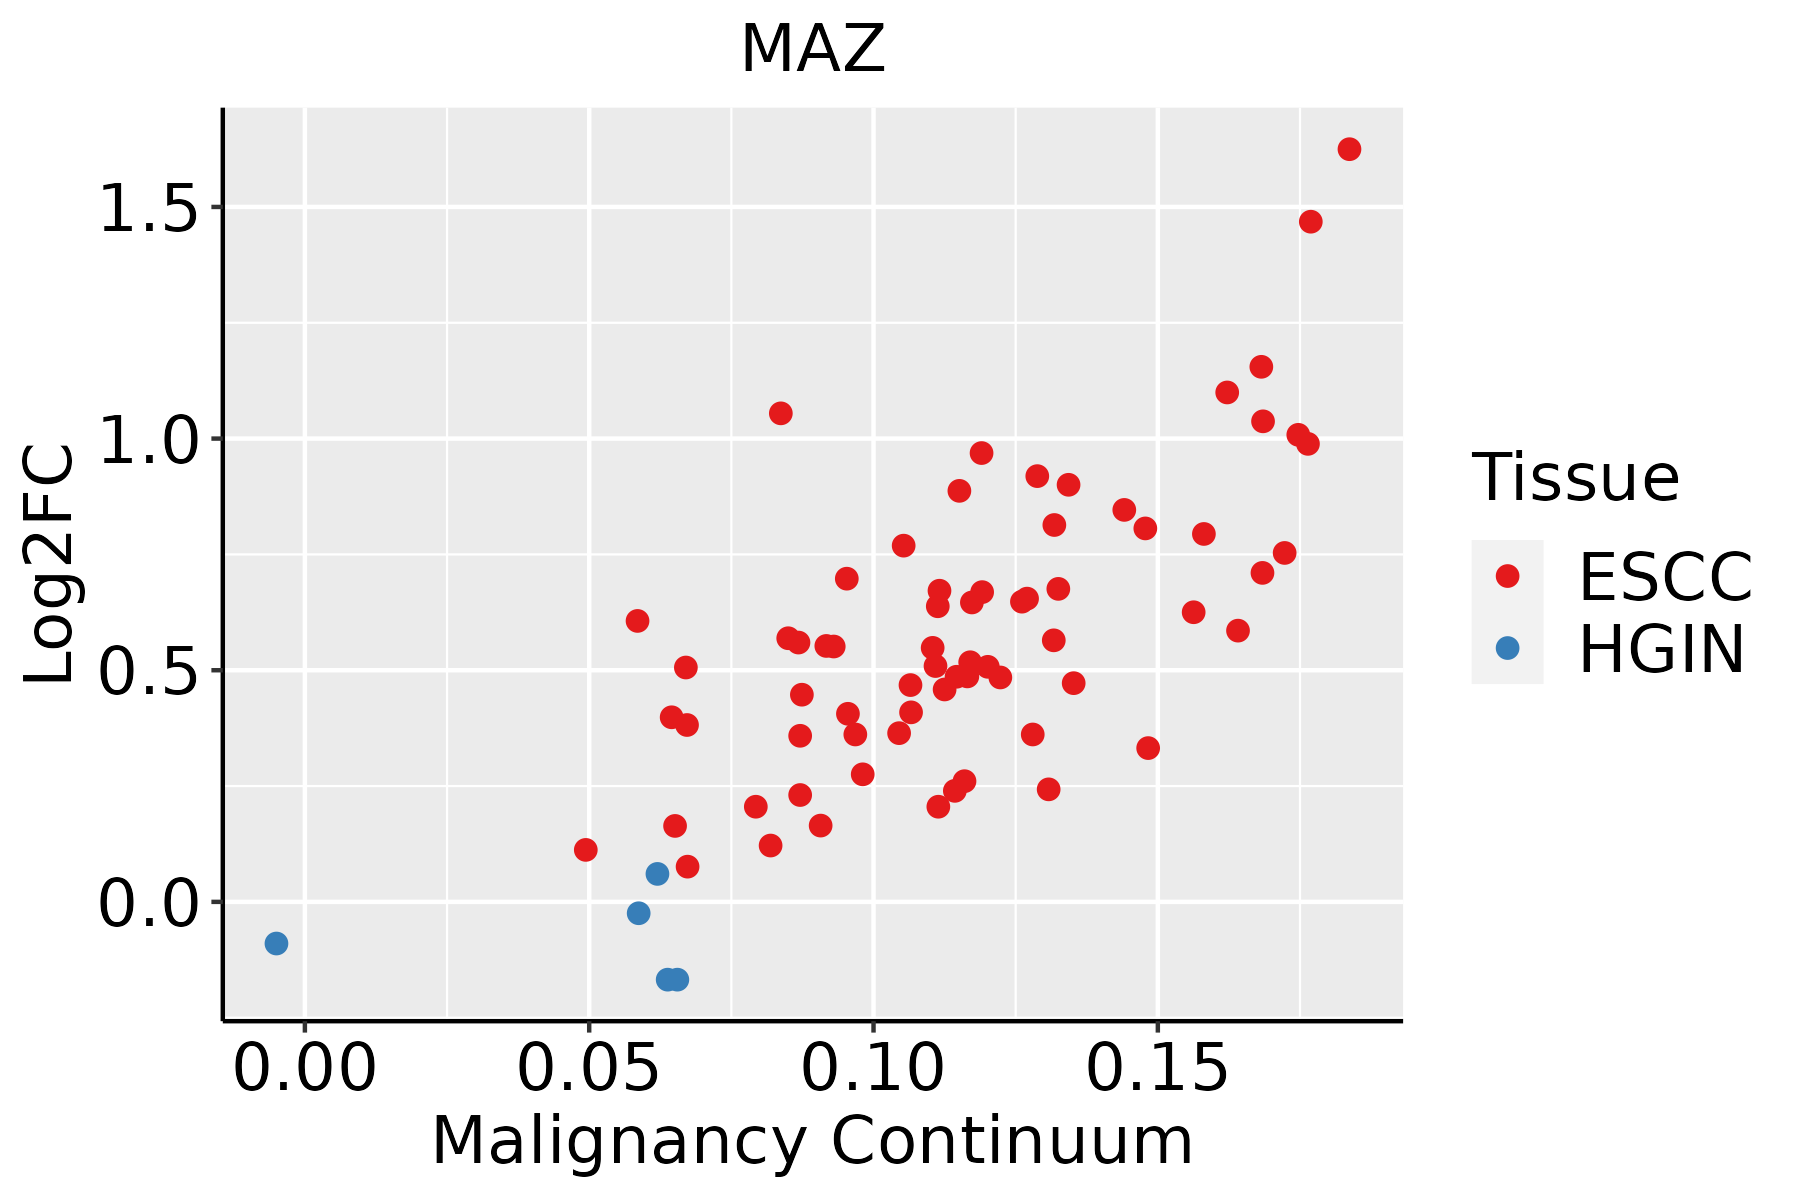 | ESCC: Esophageal squamous cell carcinoma |
| HGIN: High-grade intraepithelial neoplasias | ||
| LGIN: Low-grade intraepithelial neoplasias | ||
| Liver |  | HCC: Hepatocellular carcinoma |
| NAFLD: Non-alcoholic fatty liver disease | ||
| Oral Cavity | 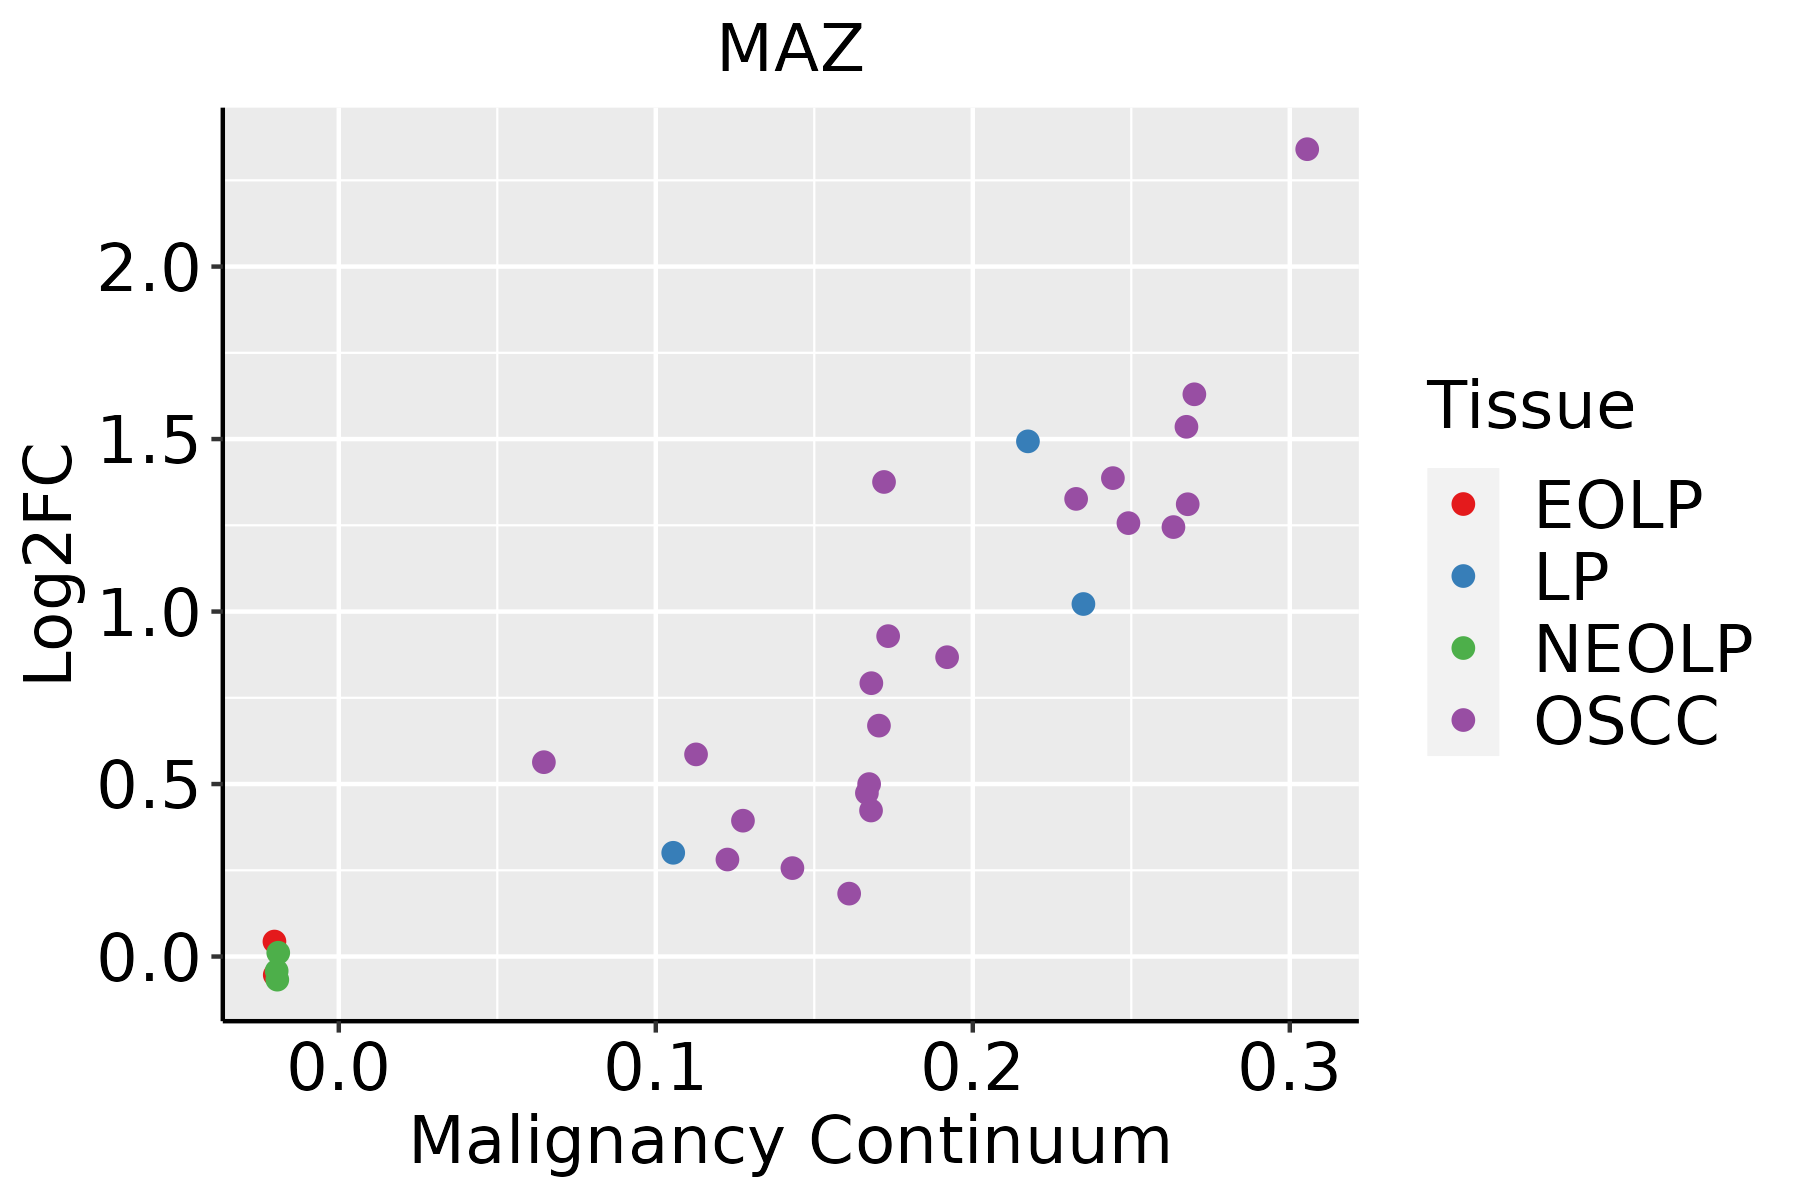 | EOLP: Erosive Oral lichen planus |
| LP: leukoplakia | ||
| NEOLP: Non-erosive oral lichen planus | ||
| OSCC: Oral squamous cell carcinoma | ||
| Prostate | 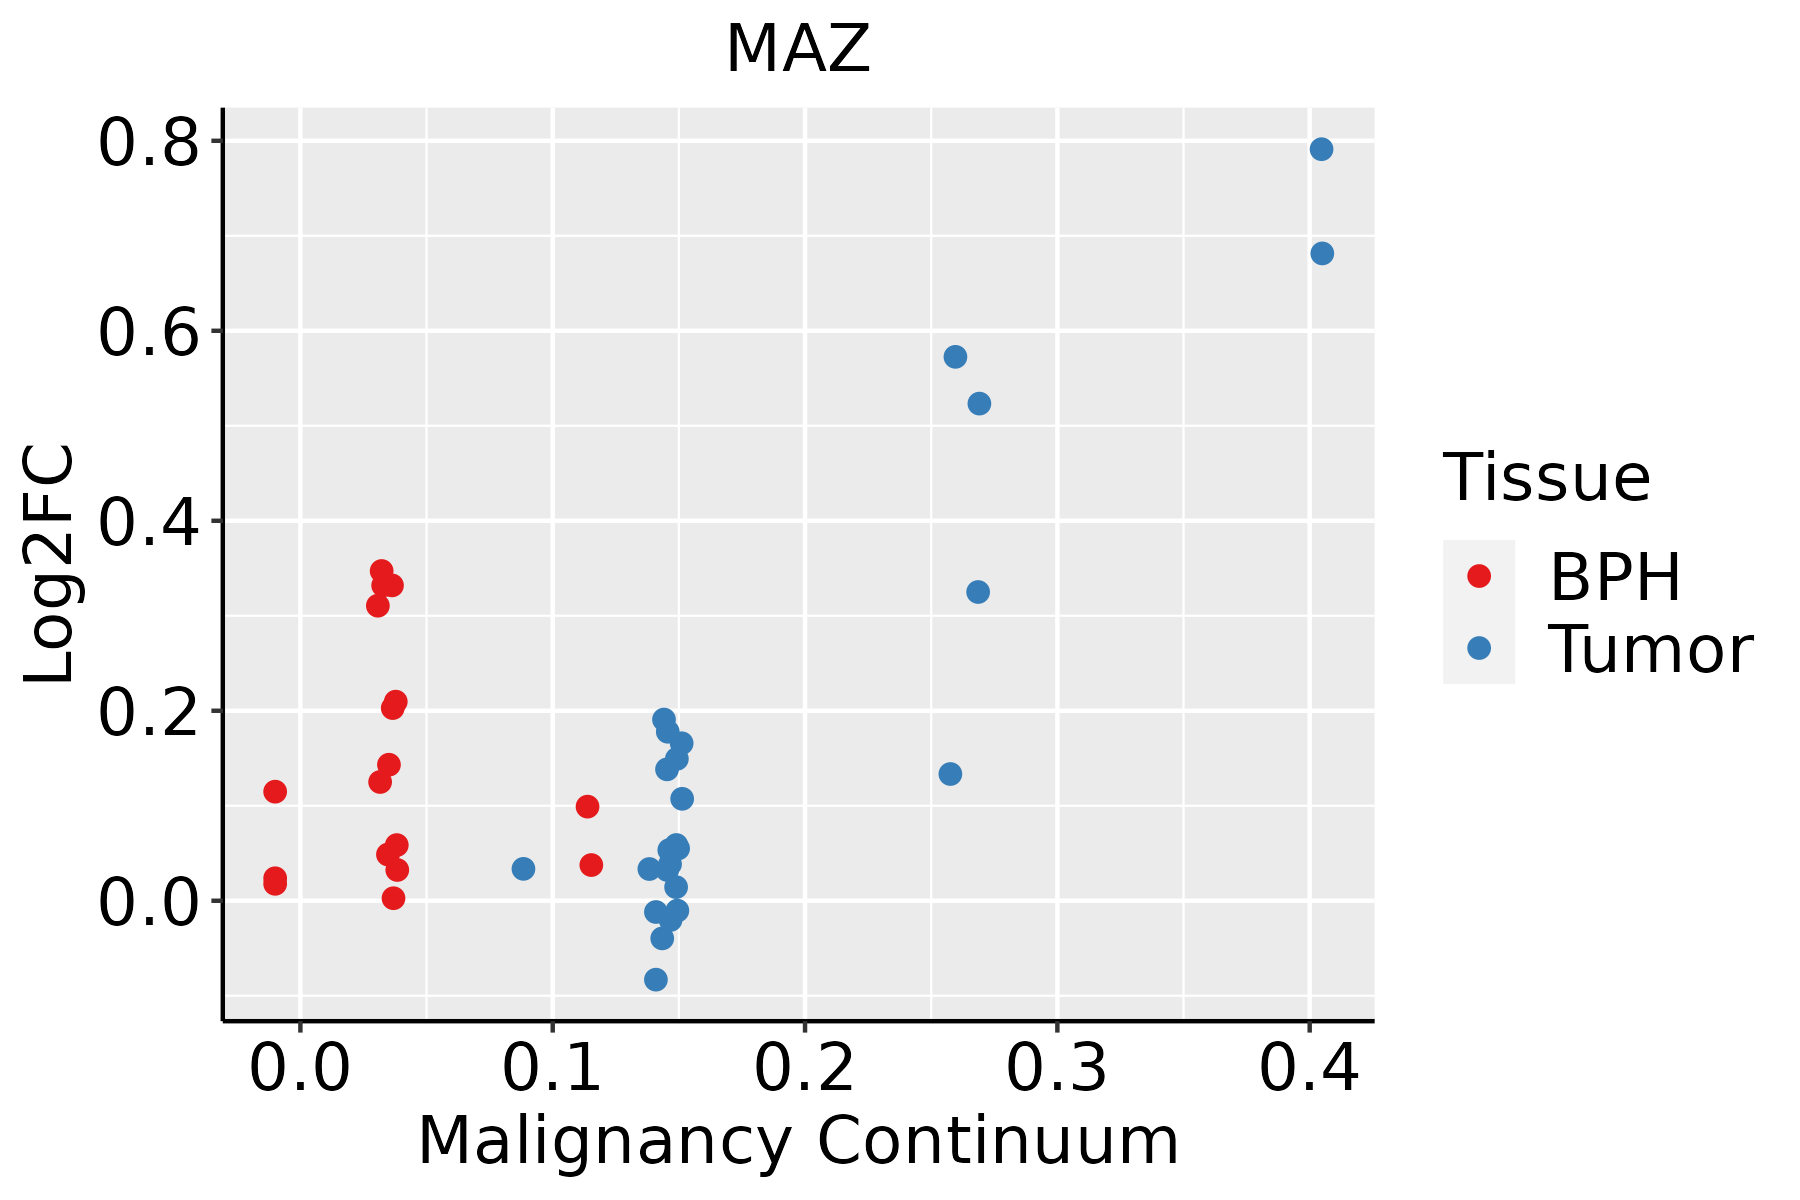 | BPH: Benign Prostatic Hyperplasia |
| Skin |  | AK: Actinic keratosis |
| cSCC: Cutaneous squamous cell carcinoma | ||
| SCCIS:squamous cell carcinoma in situ | ||
| Thyroid |  | ATC: Anaplastic thyroid cancer |
| HT: Hashimoto's thyroiditis | ||
| PTC: Papillary thyroid cancer |
| ∗log2FC in expression of this searched gene in stem-like cells from each diseased tissue sample relative to stem-like cells in normal samples in each tissue plotted against the malignancy continuum. Samples are colored based on if they are from different disease stage. |
Top |
Malignant transformation related pathway analysis |
| Find out the enriched GO biological processes and KEGG pathways involved in transition from healthy to precancer to cancer |
| Tissue | Disease Stage | Enriched GO biological Processes |
| Colorectum | AD |  |
| Colorectum | SER |  |
| Colorectum | MSS |  |
| Colorectum | MSI-H |  |
| Colorectum | FAP |  |
| ∗Top 15 enriched GO BP terms are showed in the bar plot of each disease state in each tissue. Each row represents a significant GO biological process which is colored according to the -log10(p.adjust). |
| Page: 1 2 3 4 5 6 7 8 9 |
| GO ID | Tissue | Disease Stage | Description | Gene Ratio | Bg Ratio | pvalue | p.adjust | Count |
| GO:200123314 | Breast | IDC | regulation of apoptotic signaling pathway | 82/1434 | 356/18723 | 6.27e-20 | 5.93e-17 | 82 |
| GO:200123414 | Breast | IDC | negative regulation of apoptotic signaling pathway | 49/1434 | 224/18723 | 1.45e-11 | 2.58e-09 | 49 |
| GO:004349111 | Breast | IDC | protein kinase B signaling | 27/1434 | 211/18723 | 5.92e-03 | 4.26e-02 | 27 |
| GO:200123324 | Breast | DCIS | regulation of apoptotic signaling pathway | 81/1390 | 356/18723 | 3.51e-20 | 3.31e-17 | 81 |
| GO:200123424 | Breast | DCIS | negative regulation of apoptotic signaling pathway | 48/1390 | 224/18723 | 1.70e-11 | 3.22e-09 | 48 |
| GO:2001233111 | Esophagus | ESCC | regulation of apoptotic signaling pathway | 256/8552 | 356/18723 | 4.11e-24 | 1.04e-21 | 256 |
| GO:2001234111 | Esophagus | ESCC | negative regulation of apoptotic signaling pathway | 161/8552 | 224/18723 | 1.24e-15 | 8.09e-14 | 161 |
| GO:00063673 | Esophagus | ESCC | transcription initiation from RNA polymerase II promoter | 56/8552 | 77/18723 | 1.30e-06 | 1.59e-05 | 56 |
| GO:000635211 | Esophagus | ESCC | DNA-templated transcription, initiation | 86/8552 | 130/18723 | 1.88e-06 | 2.19e-05 | 86 |
| GO:00063532 | Esophagus | ESCC | DNA-templated transcription, termination | 15/8552 | 21/18723 | 1.54e-02 | 4.96e-02 | 15 |
| GO:200123312 | Liver | Cirrhotic | regulation of apoptotic signaling pathway | 163/4634 | 356/18723 | 2.62e-18 | 4.43e-16 | 163 |
| GO:20012347 | Liver | Cirrhotic | negative regulation of apoptotic signaling pathway | 102/4634 | 224/18723 | 8.40e-12 | 5.60e-10 | 102 |
| GO:0006367 | Liver | Cirrhotic | transcription initiation from RNA polymerase II promoter | 31/4634 | 77/18723 | 1.91e-03 | 1.20e-02 | 31 |
| GO:200123322 | Liver | HCC | regulation of apoptotic signaling pathway | 226/7958 | 356/18723 | 7.26e-16 | 5.68e-14 | 226 |
| GO:200123412 | Liver | HCC | negative regulation of apoptotic signaling pathway | 145/7958 | 224/18723 | 1.33e-11 | 5.36e-10 | 145 |
| GO:00063671 | Liver | HCC | transcription initiation from RNA polymerase II promoter | 52/7958 | 77/18723 | 7.87e-06 | 9.27e-05 | 52 |
| GO:0006352 | Liver | HCC | DNA-templated transcription, initiation | 78/7958 | 130/18723 | 4.19e-05 | 4.11e-04 | 78 |
| GO:200123320 | Oral cavity | OSCC | regulation of apoptotic signaling pathway | 242/7305 | 356/18723 | 6.66e-29 | 3.24e-26 | 242 |
| GO:200123420 | Oral cavity | OSCC | negative regulation of apoptotic signaling pathway | 148/7305 | 224/18723 | 1.71e-16 | 1.36e-14 | 148 |
| GO:00063522 | Oral cavity | OSCC | DNA-templated transcription, initiation | 74/7305 | 130/18723 | 2.56e-05 | 2.39e-04 | 74 |
| Page: 1 2 3 |
| Pathway ID | Tissue | Disease Stage | Description | Gene Ratio | Bg Ratio | pvalue | p.adjust | qvalue | Count |
| Page: 1 |
Top |
Cell-cell communication analysis |
| Identification of potential cell-cell interactions between two cell types and their ligand-receptor pairs for different disease states |
| Ligand | Receptor | LRpair | Pathway | Tissue | Disease Stage |
| Page: 1 |
Top |
Single-cell gene regulatory network inference analysis |
| Find out the significant the regulons (TFs) and the target genes of each regulon across cell types for different disease states |
| TF | Cell Type | Tissue | Disease Stage | Target Gene | RSS | Regulon Activity |
| MAZ | STM | Cervix | CC | PSMD3,SRSF1,PSAT1, etc. | 1.29e-01 |  |
| MAZ | LUM | Prostate | Tumor | KIF22,PPDPF,MZT2A, etc. | 7.55e-01 |  |
| ∗The dot plots of a searched regulon are shown for all cell subpopulations in each disease state of each tissue based on the regulon specific score inferred using pySCENIC and by calculating the average expression. |
| Page: 1 |
Top |
Somatic mutation of malignant transformation related genes |
| Annotation of somatic variants for genes involved in malignant transformation |
| Hugo Symbol | Variant Class | Variant Classification | dbSNP RS | HGVSc | HGVSp | HGVSp Short | SWISSPROT | BIOTYPE | SIFT | PolyPhen | Tumor Sample Barcode | Tissue | Histology | Sex | Age | Stage | Therapy Types | Drugs | Outcome |
| MAZ | SNV | Missense_Mutation | c.1220N>G | p.Ser407Trp | p.S407W | P56270 | protein_coding | deleterious(0) | probably_damaging(0.987) | TCGA-AC-A23H-01 | Breast | breast invasive carcinoma | Female | >=65 | I/II | Unknown | Unknown | PD | |
| MAZ | SNV | Missense_Mutation | c.1298N>G | p.Tyr433Cys | p.Y433C | P56270 | protein_coding | deleterious(0.02) | probably_damaging(0.999) | TCGA-AR-A0TY-01 | Breast | breast invasive carcinoma | Female | <65 | I/II | Unspecific | Paclitaxel | PD | |
| MAZ | SNV | Missense_Mutation | c.881N>A | p.Leu294Gln | p.L294Q | P56270 | protein_coding | deleterious(0.01) | probably_damaging(0.998) | TCGA-E2-A15C-01 | Breast | breast invasive carcinoma | Female | <65 | I/II | Hormone Therapy | arimidex | SD | |
| MAZ | SNV | Missense_Mutation | novel | c.1208C>G | p.Ser403Trp | p.S403W | P56270 | protein_coding | deleterious(0) | probably_damaging(0.914) | TCGA-VS-A9UB-01 | Cervix | cervical & endocervical cancer | Female | <65 | I/II | Chemotherapy | cisplatin | CR |
| MAZ | SNV | Missense_Mutation | c.31G>C | p.Ala11Pro | p.A11P | P56270 | protein_coding | deleterious_low_confidence(0.01) | benign(0) | TCGA-5M-AAT6-01 | Colorectum | colon adenocarcinoma | Female | <65 | III/IV | Unknown | Unknown | PD | |
| MAZ | SNV | Missense_Mutation | c.1346N>A | p.Ala449Asp | p.A449D | P56270 | protein_coding | tolerated_low_confidence(0.1) | possibly_damaging(0.804) | TCGA-AA-3663-01 | Colorectum | colon adenocarcinoma | Male | <65 | I/II | Unknown | Unknown | SD | |
| MAZ | SNV | Missense_Mutation | c.605G>A | p.Gly202Asp | p.G202D | P56270 | protein_coding | deleterious(0.04) | benign(0.201) | TCGA-CK-6746-01 | Colorectum | colon adenocarcinoma | Female | >=65 | I/II | Unknown | Unknown | SD | |
| MAZ | SNV | Missense_Mutation | rs765655408 | c.1342N>T | p.Arg448Trp | p.R448W | P56270 | protein_coding | deleterious(0) | probably_damaging(0.952) | TCGA-D5-6928-01 | Colorectum | colon adenocarcinoma | Male | >=65 | I/II | Unknown | Unknown | SD |
| MAZ | deletion | Frame_Shift_Del | rs769505112 | c.1432delG | p.Ala478ProfsTer47 | p.A478Pfs*47 | P56270 | protein_coding | TCGA-5M-AAT6-01 | Colorectum | colon adenocarcinoma | Female | <65 | III/IV | Unknown | Unknown | PD | ||
| MAZ | deletion | Frame_Shift_Del | rs767720617 | c.39delC | p.Phe14SerfsTer15 | p.F14Sfs*15 | P56270 | protein_coding | TCGA-A6-3809-01 | Colorectum | colon adenocarcinoma | Female | >=65 | I/II | Unknown | Unknown | SD |
| Page: 1 2 3 4 5 |
Top |
Related drugs of malignant transformation related genes |
| Identification of chemicals and drugs interact with genes involved in malignant transfromation |
| (DGIdb 4.0) |
| Entrez ID | Symbol | Category | Interaction Types | Drug Claim Name | Drug Name | PMIDs |
| 4150 | MAZ | TRANSCRIPTION FACTOR | IL-1 | 11809795 |
| Page: 1 |

Copyright 2023-Present -The University of Texas Health Science Center at Houston |