
|
|||||
|
 | |
| |
| |
| |
| |
| |
|
Gene: MAX |
Gene summary for MAX |
| Gene information | Species | Human | Gene symbol | MAX | Gene ID | 4149 |
| Gene name | MYC associated factor X | |
| Gene Alias | bHLHd4 | |
| Cytomap | 14q23.3 | |
| Gene Type | protein-coding | GO ID | GO:0000122 | UniProtAcc | P61244 |
Top |
Malignant transformation analysis |
| Identification of the aberrant gene expression in precancerous and cancerous lesions by comparing the gene expression of stem-like cells in diseased tissues with normal stem cells |
| Entrez ID | Symbol | Replicates | Species | Organ | Tissue | Adj P-value | Log2FC | Malignancy |
| 4149 | MAX | CA_HPV_2 | Human | Cervix | CC | 6.35e-04 | 2.47e-01 | 0.0391 |
| 4149 | MAX | CCI_1 | Human | Cervix | CC | 3.84e-02 | 5.54e-01 | 0.528 |
| 4149 | MAX | CCI_2 | Human | Cervix | CC | 6.25e-03 | 8.47e-01 | 0.5249 |
| 4149 | MAX | HTA11_1938_2000001011 | Human | Colorectum | AD | 4.96e-02 | 2.45e-01 | -0.0811 |
| 4149 | MAX | HTA11_411_2000001011 | Human | Colorectum | SER | 2.35e-02 | 9.96e-01 | -0.2602 |
| 4149 | MAX | HTA11_99999965062_69753 | Human | Colorectum | MSI-H | 1.86e-02 | 9.27e-01 | 0.3487 |
| 4149 | MAX | A015-C-203 | Human | Colorectum | FAP | 6.68e-11 | -2.58e-01 | -0.1294 |
| 4149 | MAX | A002-C-201 | Human | Colorectum | FAP | 1.63e-02 | -2.09e-01 | 0.0324 |
| 4149 | MAX | A001-C-108 | Human | Colorectum | FAP | 6.10e-03 | -1.44e-01 | -0.0272 |
| 4149 | MAX | A002-C-205 | Human | Colorectum | FAP | 1.91e-02 | -1.48e-01 | -0.1236 |
| 4149 | MAX | A015-C-106 | Human | Colorectum | FAP | 1.09e-03 | -1.78e-01 | -0.0511 |
| 4149 | MAX | A002-C-114 | Human | Colorectum | FAP | 1.23e-03 | -2.32e-01 | -0.1561 |
| 4149 | MAX | A015-C-104 | Human | Colorectum | FAP | 2.71e-12 | -2.45e-01 | -0.1899 |
| 4149 | MAX | A001-C-014 | Human | Colorectum | FAP | 2.37e-03 | -1.79e-01 | 0.0135 |
| 4149 | MAX | A002-C-016 | Human | Colorectum | FAP | 1.58e-09 | -2.33e-01 | 0.0521 |
| 4149 | MAX | A001-C-203 | Human | Colorectum | FAP | 2.16e-05 | -1.76e-01 | -0.0481 |
| 4149 | MAX | A002-C-116 | Human | Colorectum | FAP | 5.12e-09 | -1.95e-01 | -0.0452 |
| 4149 | MAX | A018-E-020 | Human | Colorectum | FAP | 1.83e-04 | -2.59e-01 | -0.2034 |
| 4149 | MAX | F034 | Human | Colorectum | FAP | 1.43e-07 | -2.27e-01 | -0.0665 |
| 4149 | MAX | LZE2T | Human | Esophagus | ESCC | 2.82e-06 | 3.44e-01 | 0.082 |
| Page: 1 2 3 4 5 6 7 |
| Tissue | Expression Dynamics | Abbreviation |
| Cervix | 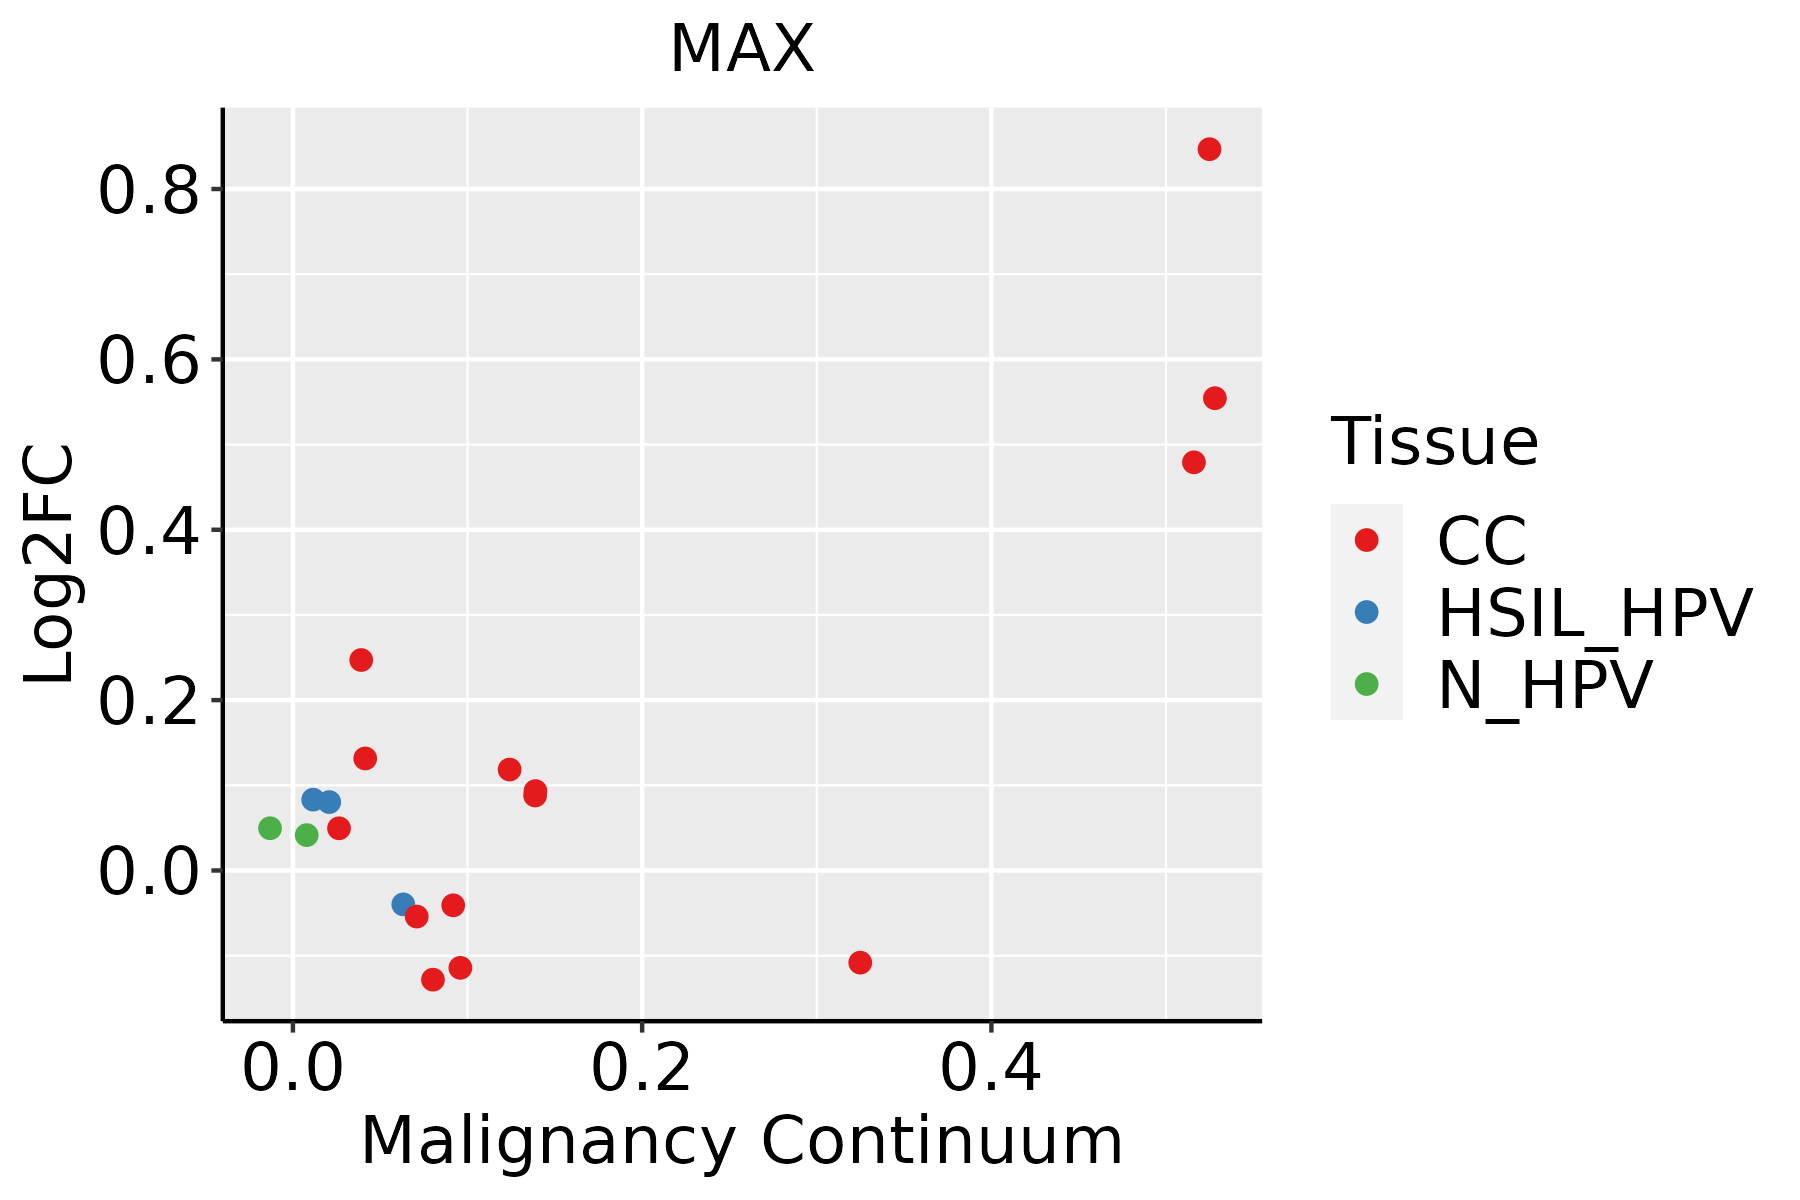 | CC: Cervix cancer |
| HSIL_HPV: HPV-infected high-grade squamous intraepithelial lesions | ||
| N_HPV: HPV-infected normal cervix | ||
| Colorectum (GSE201348) |  | FAP: Familial adenomatous polyposis |
| CRC: Colorectal cancer | ||
| Colorectum (HTA11) |  | AD: Adenomas |
| SER: Sessile serrated lesions | ||
| MSI-H: Microsatellite-high colorectal cancer | ||
| MSS: Microsatellite stable colorectal cancer | ||
| Esophagus | 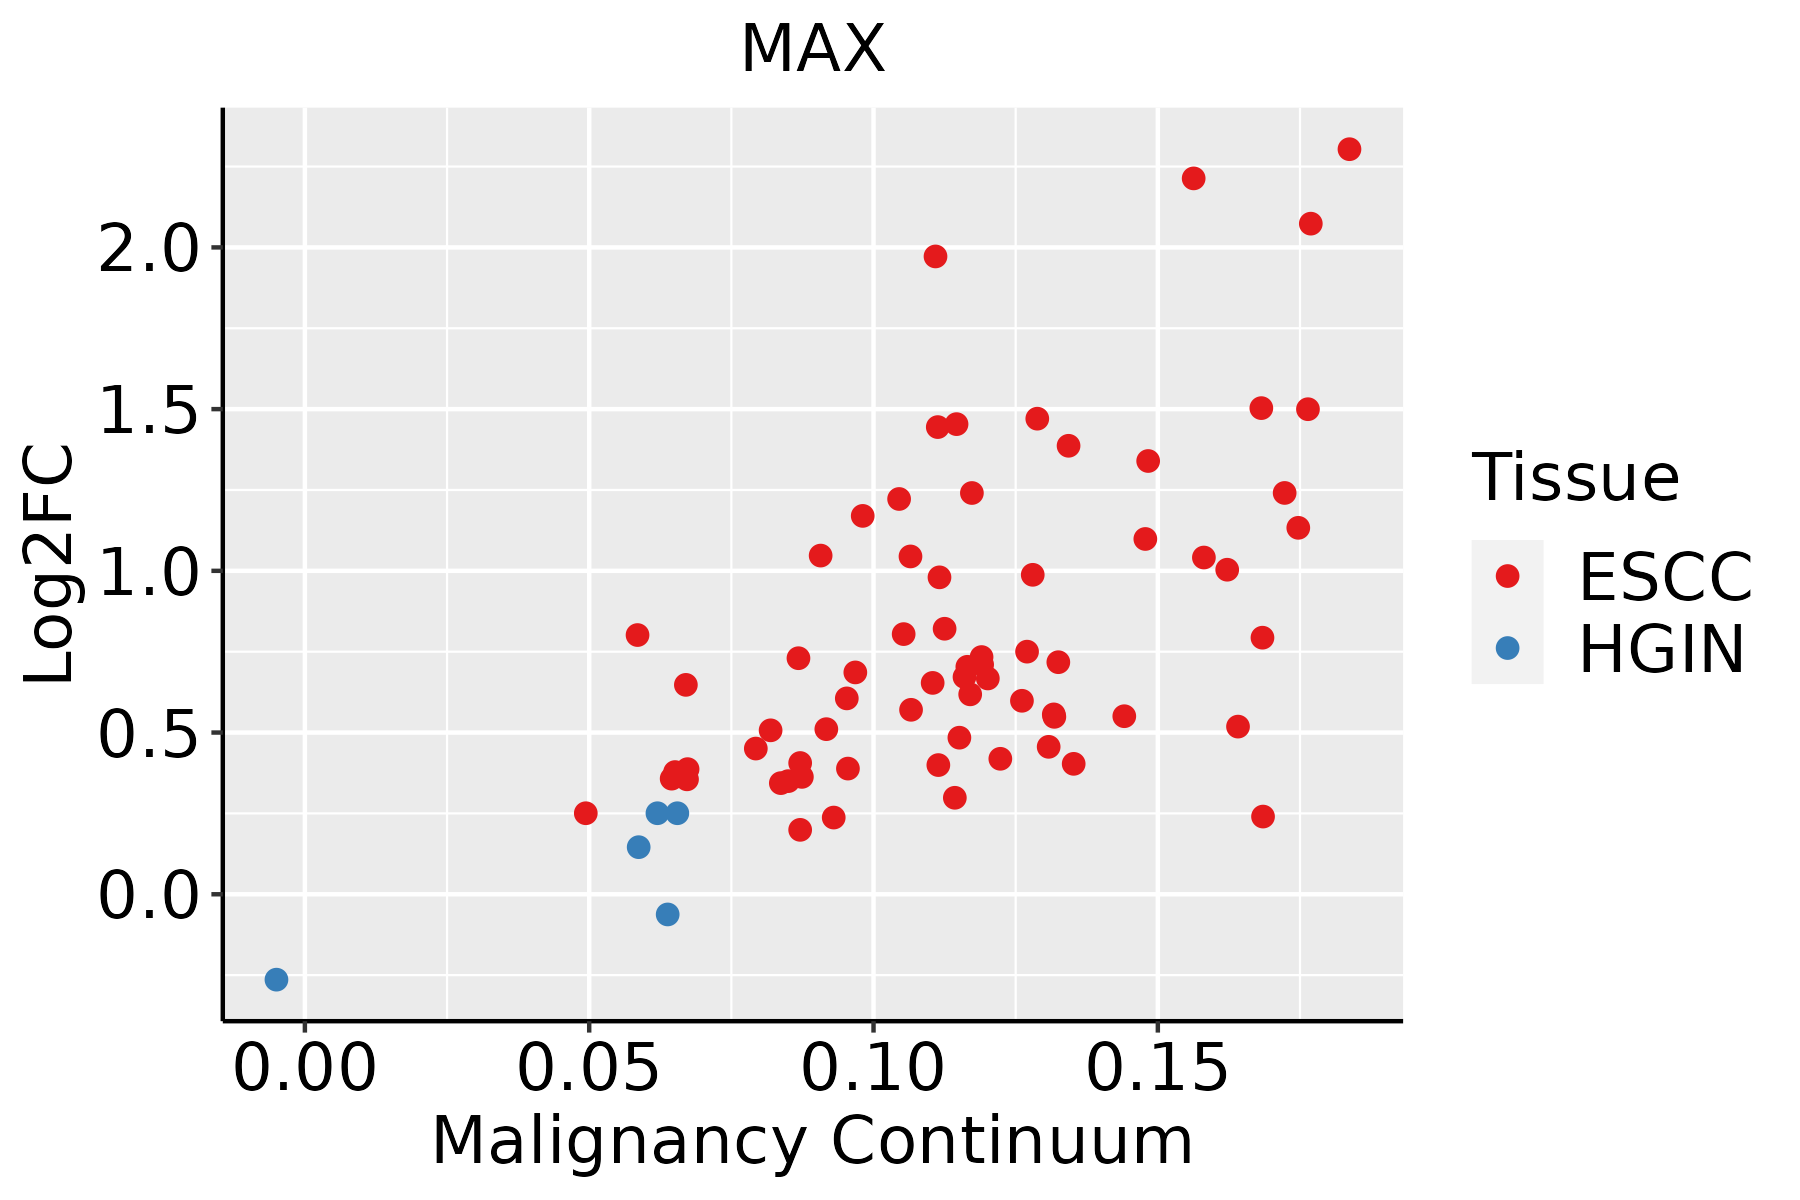 | ESCC: Esophageal squamous cell carcinoma |
| HGIN: High-grade intraepithelial neoplasias | ||
| LGIN: Low-grade intraepithelial neoplasias | ||
| Liver |  | HCC: Hepatocellular carcinoma |
| NAFLD: Non-alcoholic fatty liver disease | ||
| Oral Cavity |  | EOLP: Erosive Oral lichen planus |
| LP: leukoplakia | ||
| NEOLP: Non-erosive oral lichen planus | ||
| OSCC: Oral squamous cell carcinoma | ||
| Skin | 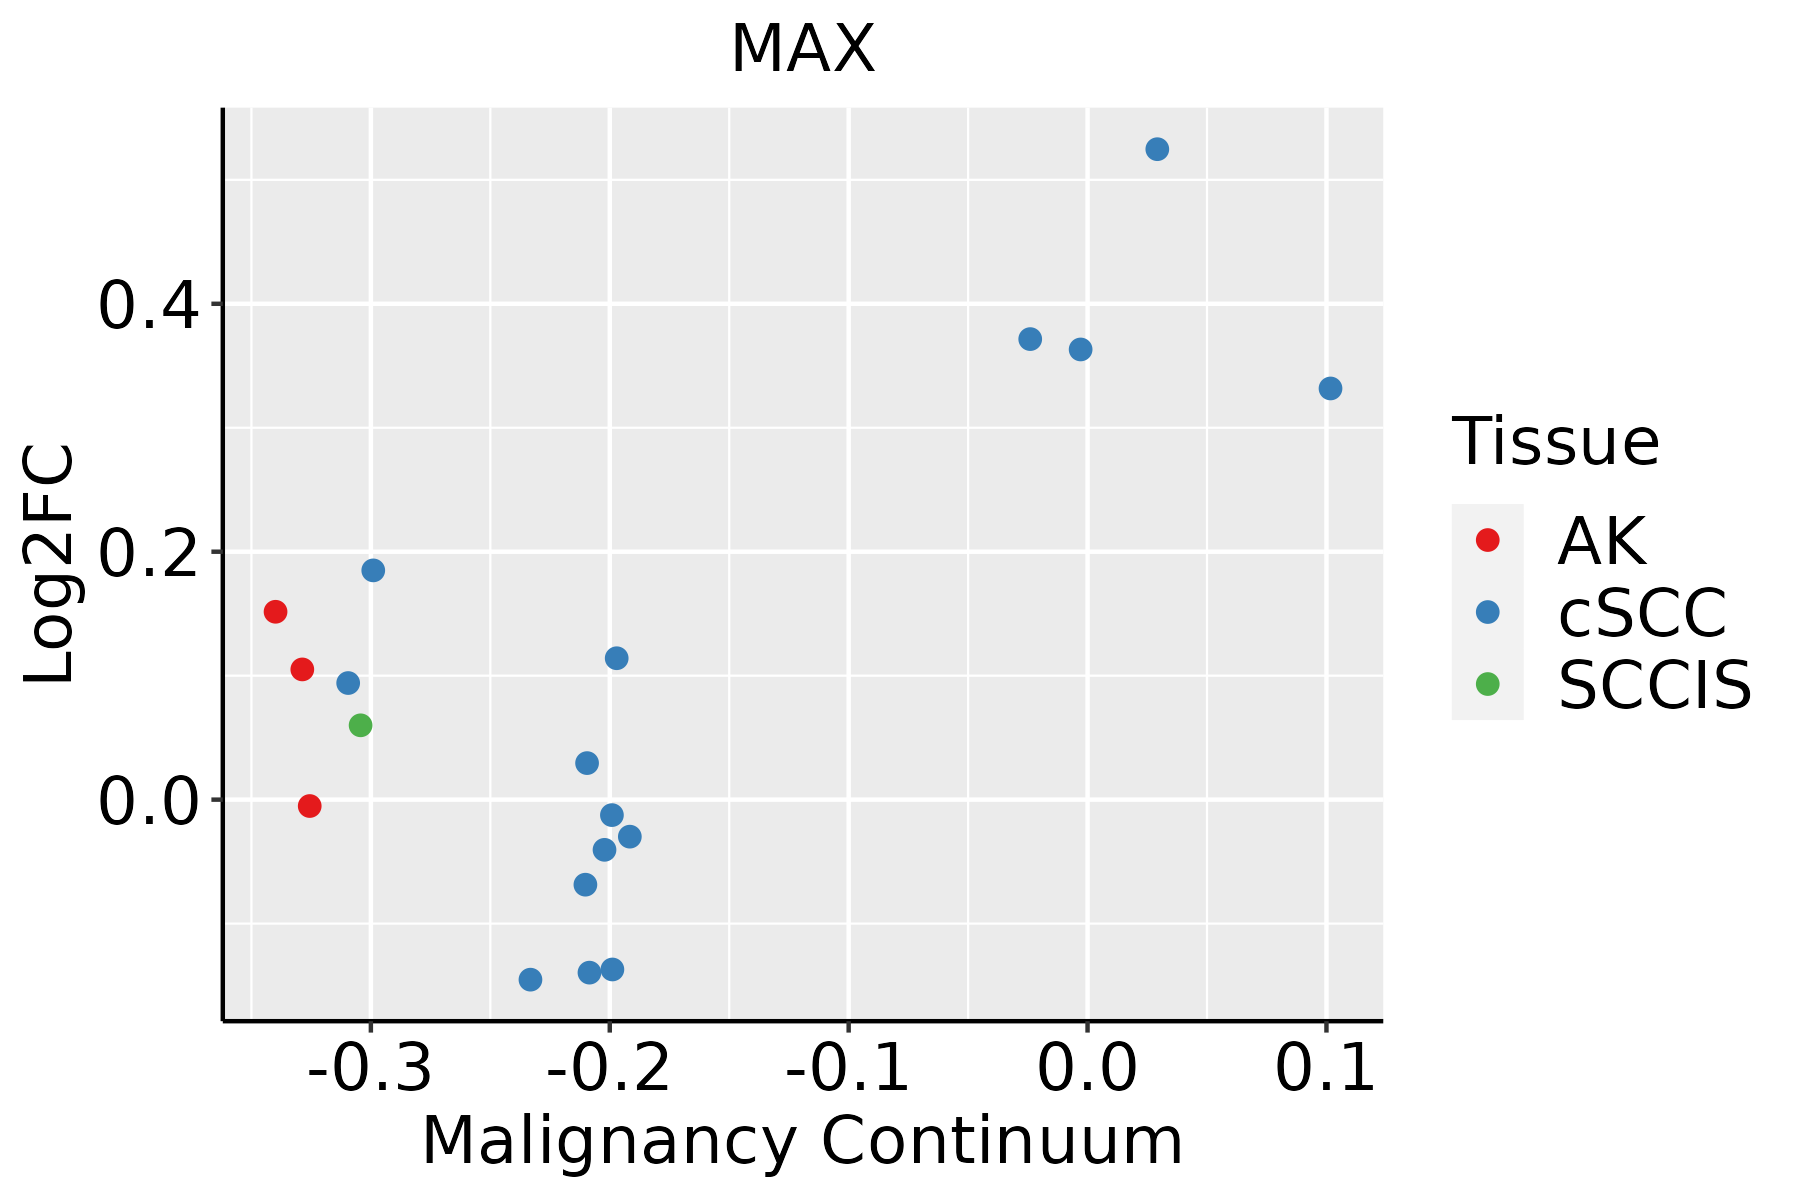 | AK: Actinic keratosis |
| cSCC: Cutaneous squamous cell carcinoma | ||
| SCCIS:squamous cell carcinoma in situ | ||
| Thyroid | 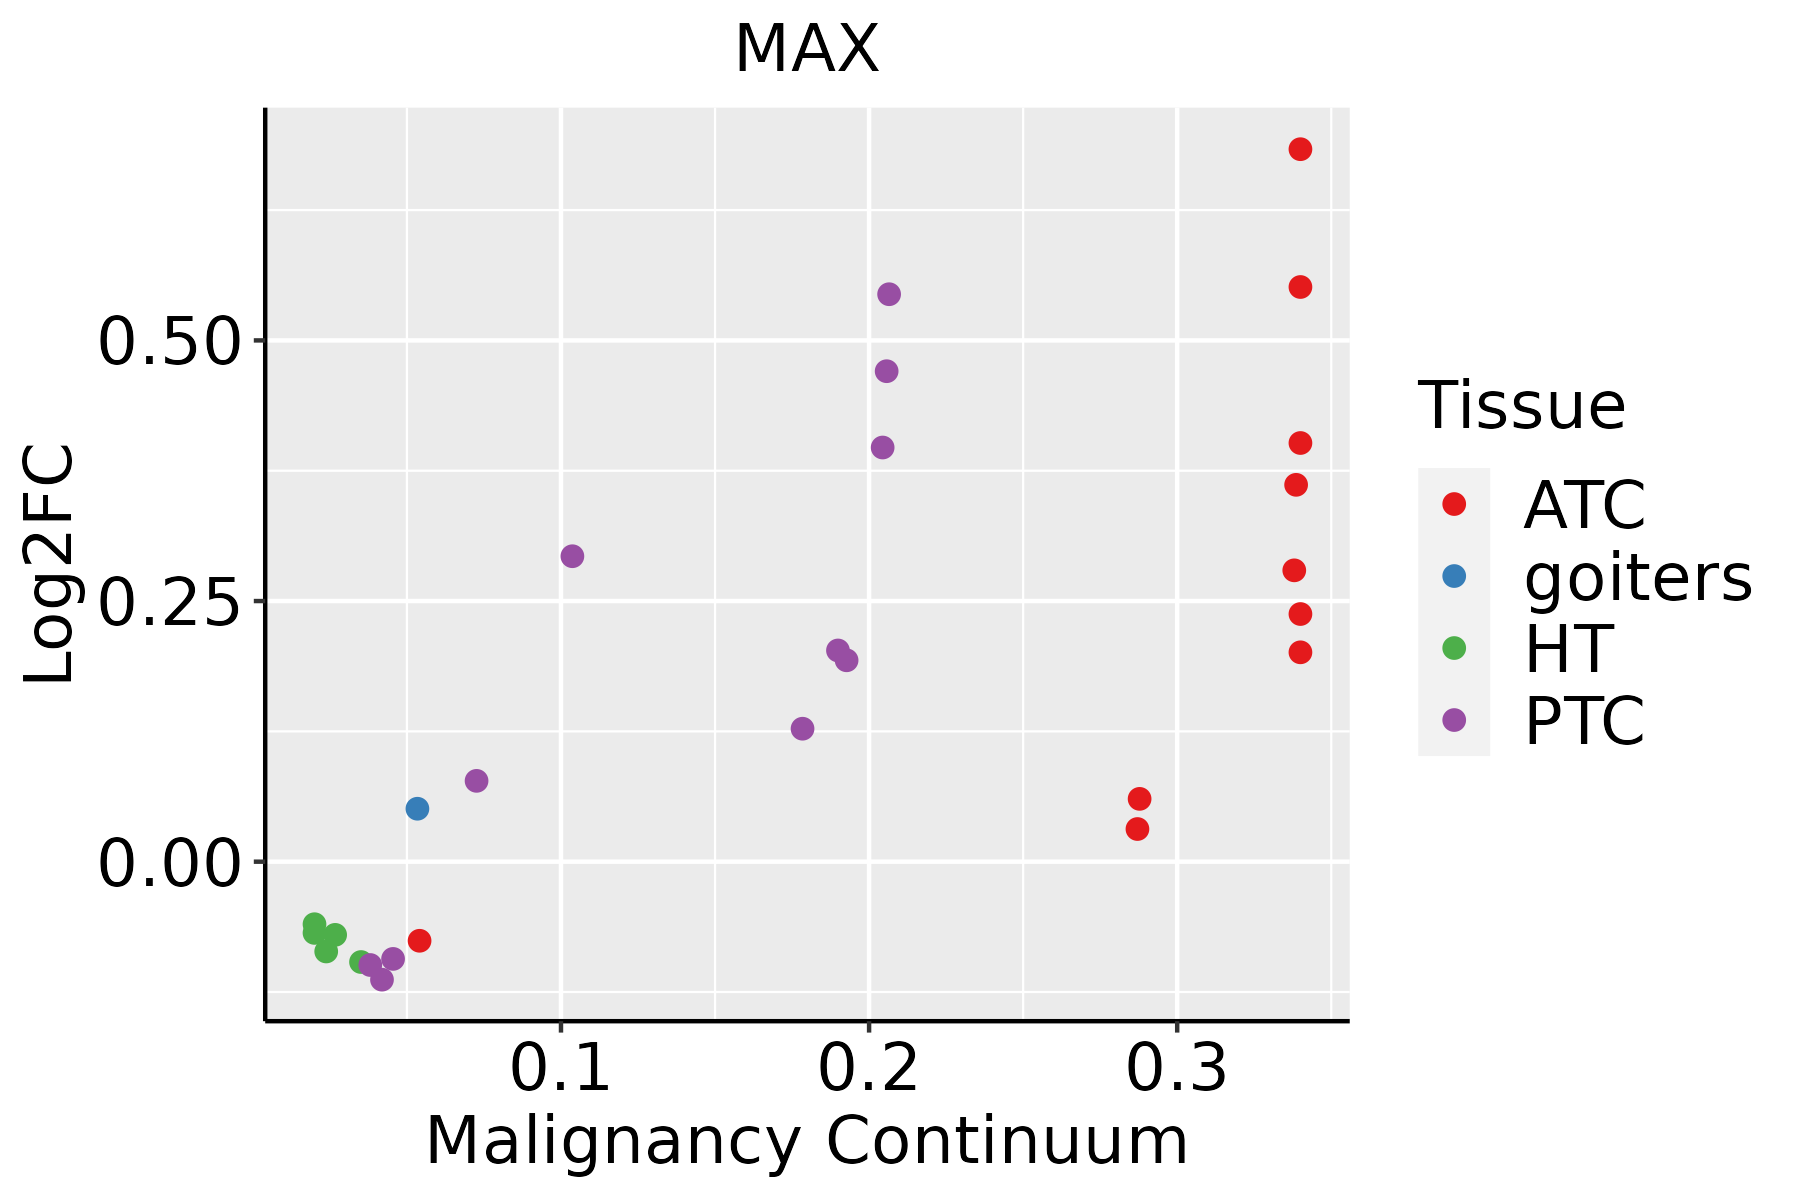 | ATC: Anaplastic thyroid cancer |
| HT: Hashimoto's thyroiditis | ||
| PTC: Papillary thyroid cancer |
| ∗log2FC in expression of this searched gene in stem-like cells from each diseased tissue sample relative to stem-like cells in normal samples in each tissue plotted against the malignancy continuum. Samples are colored based on if they are from different disease stage. |
Top |
Malignant transformation related pathway analysis |
| Find out the enriched GO biological processes and KEGG pathways involved in transition from healthy to precancer to cancer |
| Tissue | Disease Stage | Enriched GO biological Processes |
| Colorectum | AD |  |
| Colorectum | SER |  |
| Colorectum | MSS |  |
| Colorectum | MSI-H |  |
| Colorectum | FAP |  |
| ∗Top 15 enriched GO BP terms are showed in the bar plot of each disease state in each tissue. Each row represents a significant GO biological process which is colored according to the -log10(p.adjust). |
| Page: 1 2 3 4 5 6 7 8 9 |
| GO ID | Tissue | Disease Stage | Description | Gene Ratio | Bg Ratio | pvalue | p.adjust | Count |
| GO:007149610 | Cervix | CC | cellular response to external stimulus | 78/2311 | 320/18723 | 1.82e-09 | 1.98e-07 | 78 |
| GO:00316689 | Cervix | CC | cellular response to extracellular stimulus | 59/2311 | 246/18723 | 3.03e-07 | 1.24e-05 | 59 |
| GO:003166710 | Cervix | CC | response to nutrient levels | 92/2311 | 474/18723 | 5.80e-06 | 1.42e-04 | 92 |
| GO:00092678 | Cervix | CC | cellular response to starvation | 39/2311 | 156/18723 | 1.04e-05 | 2.32e-04 | 39 |
| GO:00425948 | Cervix | CC | response to starvation | 46/2311 | 197/18723 | 1.24e-05 | 2.59e-04 | 46 |
| GO:00316698 | Cervix | CC | cellular response to nutrient levels | 49/2311 | 215/18723 | 1.32e-05 | 2.68e-04 | 49 |
| GO:19016538 | Cervix | CC | cellular response to peptide | 72/2311 | 359/18723 | 1.89e-05 | 3.48e-04 | 72 |
| GO:007099710 | Cervix | CC | neuron death | 70/2311 | 361/18723 | 7.50e-05 | 1.03e-03 | 70 |
| GO:00434349 | Cervix | CC | response to peptide hormone | 77/2311 | 414/18723 | 1.40e-04 | 1.70e-03 | 77 |
| GO:00713757 | Cervix | CC | cellular response to peptide hormone stimulus | 57/2311 | 290/18723 | 2.32e-04 | 2.59e-03 | 57 |
| GO:005140210 | Cervix | CC | neuron apoptotic process | 49/2311 | 246/18723 | 4.48e-04 | 4.48e-03 | 49 |
| GO:00328688 | Cervix | CC | response to insulin | 50/2311 | 264/18723 | 1.28e-03 | 1.02e-02 | 50 |
| GO:00486782 | Cervix | CC | response to axon injury | 19/2311 | 83/18723 | 5.25e-03 | 3.08e-02 | 19 |
| GO:0150063 | Cervix | CC | visual system development | 63/2311 | 375/18723 | 6.58e-03 | 3.65e-02 | 63 |
| GO:0001654 | Cervix | CC | eye development | 62/2311 | 371/18723 | 7.83e-03 | 4.13e-02 | 62 |
| GO:0048880 | Cervix | CC | sensory system development | 63/2311 | 381/18723 | 9.29e-03 | 4.66e-02 | 63 |
| GO:0032868 | Colorectum | AD | response to insulin | 91/3918 | 264/18723 | 2.02e-07 | 8.48e-06 | 91 |
| GO:1901653 | Colorectum | AD | cellular response to peptide | 114/3918 | 359/18723 | 8.32e-07 | 2.88e-05 | 114 |
| GO:0070997 | Colorectum | AD | neuron death | 114/3918 | 361/18723 | 1.13e-06 | 3.72e-05 | 114 |
| GO:0071375 | Colorectum | AD | cellular response to peptide hormone stimulus | 95/3918 | 290/18723 | 1.50e-06 | 4.66e-05 | 95 |
| Page: 1 2 3 4 5 6 7 8 |
| Pathway ID | Tissue | Disease Stage | Description | Gene Ratio | Bg Ratio | pvalue | p.adjust | qvalue | Count |
| hsa052226 | Cervix | CC | Small cell lung cancer | 29/1267 | 92/8465 | 4.38e-05 | 3.09e-04 | 1.83e-04 | 29 |
| hsa040109 | Cervix | CC | MAPK signaling pathway | 62/1267 | 302/8465 | 4.89e-03 | 1.67e-02 | 9.86e-03 | 62 |
| hsa0522213 | Cervix | CC | Small cell lung cancer | 29/1267 | 92/8465 | 4.38e-05 | 3.09e-04 | 1.83e-04 | 29 |
| hsa0401012 | Cervix | CC | MAPK signaling pathway | 62/1267 | 302/8465 | 4.89e-03 | 1.67e-02 | 9.86e-03 | 62 |
| hsa04010 | Colorectum | FAP | MAPK signaling pathway | 68/1404 | 302/8465 | 4.00e-03 | 1.67e-02 | 1.02e-02 | 68 |
| hsa05202 | Colorectum | FAP | Transcriptional misregulation in cancer | 45/1404 | 193/8465 | 9.19e-03 | 3.33e-02 | 2.03e-02 | 45 |
| hsa052222 | Colorectum | FAP | Small cell lung cancer | 24/1404 | 92/8465 | 1.33e-02 | 4.46e-02 | 2.71e-02 | 24 |
| hsa040101 | Colorectum | FAP | MAPK signaling pathway | 68/1404 | 302/8465 | 4.00e-03 | 1.67e-02 | 1.02e-02 | 68 |
| hsa052021 | Colorectum | FAP | Transcriptional misregulation in cancer | 45/1404 | 193/8465 | 9.19e-03 | 3.33e-02 | 2.03e-02 | 45 |
| hsa052223 | Colorectum | FAP | Small cell lung cancer | 24/1404 | 92/8465 | 1.33e-02 | 4.46e-02 | 2.71e-02 | 24 |
| hsa052229 | Esophagus | ESCC | Small cell lung cancer | 69/4205 | 92/8465 | 5.40e-07 | 3.85e-06 | 1.97e-06 | 69 |
| hsa052028 | Esophagus | ESCC | Transcriptional misregulation in cancer | 116/4205 | 193/8465 | 2.08e-03 | 5.95e-03 | 3.05e-03 | 116 |
| hsa0522216 | Esophagus | ESCC | Small cell lung cancer | 69/4205 | 92/8465 | 5.40e-07 | 3.85e-06 | 1.97e-06 | 69 |
| hsa0520213 | Esophagus | ESCC | Transcriptional misregulation in cancer | 116/4205 | 193/8465 | 2.08e-03 | 5.95e-03 | 3.05e-03 | 116 |
| hsa052224 | Liver | HCC | Small cell lung cancer | 57/4020 | 92/8465 | 3.54e-03 | 1.12e-02 | 6.22e-03 | 57 |
| hsa0522211 | Liver | HCC | Small cell lung cancer | 57/4020 | 92/8465 | 3.54e-03 | 1.12e-02 | 6.22e-03 | 57 |
| hsa052228 | Oral cavity | OSCC | Small cell lung cancer | 66/3704 | 92/8465 | 4.43e-08 | 3.38e-07 | 1.72e-07 | 66 |
| hsa0401014 | Oral cavity | OSCC | MAPK signaling pathway | 165/3704 | 302/8465 | 7.11e-05 | 2.74e-04 | 1.40e-04 | 165 |
| hsa0522215 | Oral cavity | OSCC | Small cell lung cancer | 66/3704 | 92/8465 | 4.43e-08 | 3.38e-07 | 1.72e-07 | 66 |
| hsa0401015 | Oral cavity | OSCC | MAPK signaling pathway | 165/3704 | 302/8465 | 7.11e-05 | 2.74e-04 | 1.40e-04 | 165 |
| Page: 1 2 |
Top |
Cell-cell communication analysis |
| Identification of potential cell-cell interactions between two cell types and their ligand-receptor pairs for different disease states |
| Ligand | Receptor | LRpair | Pathway | Tissue | Disease Stage |
| Page: 1 |
Top |
Single-cell gene regulatory network inference analysis |
| Find out the significant the regulons (TFs) and the target genes of each regulon across cell types for different disease states |
| TF | Cell Type | Tissue | Disease Stage | Target Gene | RSS | Regulon Activity |
| MAX | MES | Cervix | CC | CXCL10,AL139022.1,KLF7, etc. | 7.10e-01 |  |
| MAX | CD8TEXINT | Lung | AIS | AL139022.1,FNTB,CD8A, etc. | 3.23e-01 |  |
| ∗The dot plots of a searched regulon are shown for all cell subpopulations in each disease state of each tissue based on the regulon specific score inferred using pySCENIC and by calculating the average expression. |
| Page: 1 |
Top |
Somatic mutation of malignant transformation related genes |
| Annotation of somatic variants for genes involved in malignant transformation |
| Hugo Symbol | Variant Class | Variant Classification | dbSNP RS | HGVSc | HGVSp | HGVSp Short | SWISSPROT | BIOTYPE | SIFT | PolyPhen | Tumor Sample Barcode | Tissue | Histology | Sex | Age | Stage | Therapy Types | Drugs | Outcome |
| MAX | SNV | Missense_Mutation | c.13N>A | p.Asp5Asn | p.D5N | P61244 | protein_coding | deleterious(0.01) | possibly_damaging(0.707) | TCGA-A2-A0YT-01 | Breast | breast invasive carcinoma | Female | <65 | III/IV | Hormone Therapy | arimidex | SD | |
| MAX | SNV | Missense_Mutation | novel | c.121N>T | p.Asp41Tyr | p.D41Y | P61244 | protein_coding | deleterious(0.02) | possibly_damaging(0.775) | TCGA-AN-A046-01 | Breast | breast invasive carcinoma | Female | >=65 | I/II | Unknown | Unknown | SD |
| MAX | SNV | Missense_Mutation | rs866762160 | c.139C>T | p.Arg47Trp | p.R47W | P61244 | protein_coding | deleterious(0) | probably_damaging(0.999) | TCGA-C5-A1BI-01 | Cervix | cervical & endocervical cancer | Female | <65 | III/IV | Chemotherapy | cisplatin | SD |
| MAX | SNV | Missense_Mutation | c.179N>A | p.Arg60Gln | p.R60Q | P61244 | protein_coding | deleterious(0) | probably_damaging(0.995) | TCGA-EA-A410-01 | Cervix | cervical & endocervical cancer | Female | <65 | I/II | Unknown | Unknown | SD | |
| MAX | SNV | Missense_Mutation | rs762084527 | c.298N>T | p.Arg100Cys | p.R100C | P61244 | protein_coding | deleterious(0.05) | probably_damaging(0.943) | TCGA-AA-A01R-01 | Colorectum | colon adenocarcinoma | Male | <65 | III/IV | Chemotherapy | 5-fluorouracil | PD |
| MAX | SNV | Missense_Mutation | c.173C>T | p.Ala58Val | p.A58V | P61244 | protein_coding | tolerated(0.11) | possibly_damaging(0.838) | TCGA-AD-6895-01 | Colorectum | colon adenocarcinoma | Male | >=65 | III/IV | Unknown | Unknown | SD | |
| MAX | SNV | Missense_Mutation | c.94N>A | p.Glu32Lys | p.E32K | P61244 | protein_coding | deleterious(0) | probably_damaging(1) | TCGA-AZ-4315-01 | Colorectum | colon adenocarcinoma | Male | <65 | I/II | Unknown | Unknown | SD | |
| MAX | SNV | Missense_Mutation | c.137T>C | p.Leu46Ser | p.L46S | P61244 | protein_coding | deleterious(0) | probably_damaging(1) | TCGA-CA-6717-01 | Colorectum | colon adenocarcinoma | Male | <65 | I/II | Chemotherapy | oxaliplatin | CR | |
| MAX | insertion | Frame_Shift_Ins | novel | c.329_330insG | p.Leu111ThrfsTer35 | p.L111Tfs*35 | P61244 | protein_coding | TCGA-AM-5820-01 | Colorectum | colon adenocarcinoma | Female | <65 | I/II | Unknown | Unknown | SD | ||
| MAX | SNV | Missense_Mutation | novel | c.37G>A | p.Glu13Lys | p.E13K | P61244 | protein_coding | tolerated(0.31) | benign(0.081) | TCGA-A5-A0G2-01 | Endometrium | uterine corpus endometrioid carcinoma | Female | <65 | III/IV | Unknown | Unknown | SD |
| Page: 1 2 3 4 |
Top |
Related drugs of malignant transformation related genes |
| Identification of chemicals and drugs interact with genes involved in malignant transfromation |
| (DGIdb 4.0) |
| Entrez ID | Symbol | Category | Interaction Types | Drug Claim Name | Drug Name | PMIDs |
| Page: 1 |

Copyright 2023-Present -The University of Texas Health Science Center at Houston |