
|
|||||
|
 | |
| |
| |
| |
| |
| |
|
Gene: MAU2 |
Gene summary for MAU2 |
| Gene information | Species | Human | Gene symbol | MAU2 | Gene ID | 23383 |
| Gene name | MAU2 sister chromatid cohesion factor | |
| Gene Alias | KIAA0892 | |
| Cytomap | 19p13.11 | |
| Gene Type | protein-coding | GO ID | GO:0000070 | UniProtAcc | Q9Y6X3 |
Top |
Malignant transformation analysis |
| Identification of the aberrant gene expression in precancerous and cancerous lesions by comparing the gene expression of stem-like cells in diseased tissues with normal stem cells |
| Entrez ID | Symbol | Replicates | Species | Organ | Tissue | Adj P-value | Log2FC | Malignancy |
| 23383 | MAU2 | LZE4T | Human | Esophagus | ESCC | 4.59e-02 | 1.57e-01 | 0.0811 |
| 23383 | MAU2 | LZE5T | Human | Esophagus | ESCC | 1.83e-02 | 2.15e-01 | 0.0514 |
| 23383 | MAU2 | LZE7T | Human | Esophagus | ESCC | 1.59e-05 | 3.02e-01 | 0.0667 |
| 23383 | MAU2 | LZE20T | Human | Esophagus | ESCC | 6.42e-03 | 1.43e-01 | 0.0662 |
| 23383 | MAU2 | LZE24T | Human | Esophagus | ESCC | 4.71e-10 | 2.39e-01 | 0.0596 |
| 23383 | MAU2 | P1T-E | Human | Esophagus | ESCC | 4.40e-07 | 2.83e-01 | 0.0875 |
| 23383 | MAU2 | P2T-E | Human | Esophagus | ESCC | 3.71e-18 | 1.68e-01 | 0.1177 |
| 23383 | MAU2 | P4T-E | Human | Esophagus | ESCC | 9.67e-13 | 1.83e-01 | 0.1323 |
| 23383 | MAU2 | P5T-E | Human | Esophagus | ESCC | 1.09e-04 | 6.82e-02 | 0.1327 |
| 23383 | MAU2 | P8T-E | Human | Esophagus | ESCC | 2.59e-12 | 3.23e-01 | 0.0889 |
| 23383 | MAU2 | P9T-E | Human | Esophagus | ESCC | 3.43e-09 | 1.63e-01 | 0.1131 |
| 23383 | MAU2 | P10T-E | Human | Esophagus | ESCC | 3.00e-20 | 3.63e-01 | 0.116 |
| 23383 | MAU2 | P11T-E | Human | Esophagus | ESCC | 4.87e-09 | 2.84e-01 | 0.1426 |
| 23383 | MAU2 | P12T-E | Human | Esophagus | ESCC | 1.35e-11 | 2.34e-01 | 0.1122 |
| 23383 | MAU2 | P15T-E | Human | Esophagus | ESCC | 1.79e-12 | 2.19e-01 | 0.1149 |
| 23383 | MAU2 | P16T-E | Human | Esophagus | ESCC | 4.65e-10 | 1.83e-01 | 0.1153 |
| 23383 | MAU2 | P17T-E | Human | Esophagus | ESCC | 1.46e-06 | 2.04e-01 | 0.1278 |
| 23383 | MAU2 | P20T-E | Human | Esophagus | ESCC | 1.03e-09 | 1.97e-01 | 0.1124 |
| 23383 | MAU2 | P21T-E | Human | Esophagus | ESCC | 9.77e-15 | 1.86e-01 | 0.1617 |
| 23383 | MAU2 | P22T-E | Human | Esophagus | ESCC | 1.82e-07 | 1.21e-01 | 0.1236 |
| Page: 1 2 3 4 5 |
| Tissue | Expression Dynamics | Abbreviation |
| Esophagus | 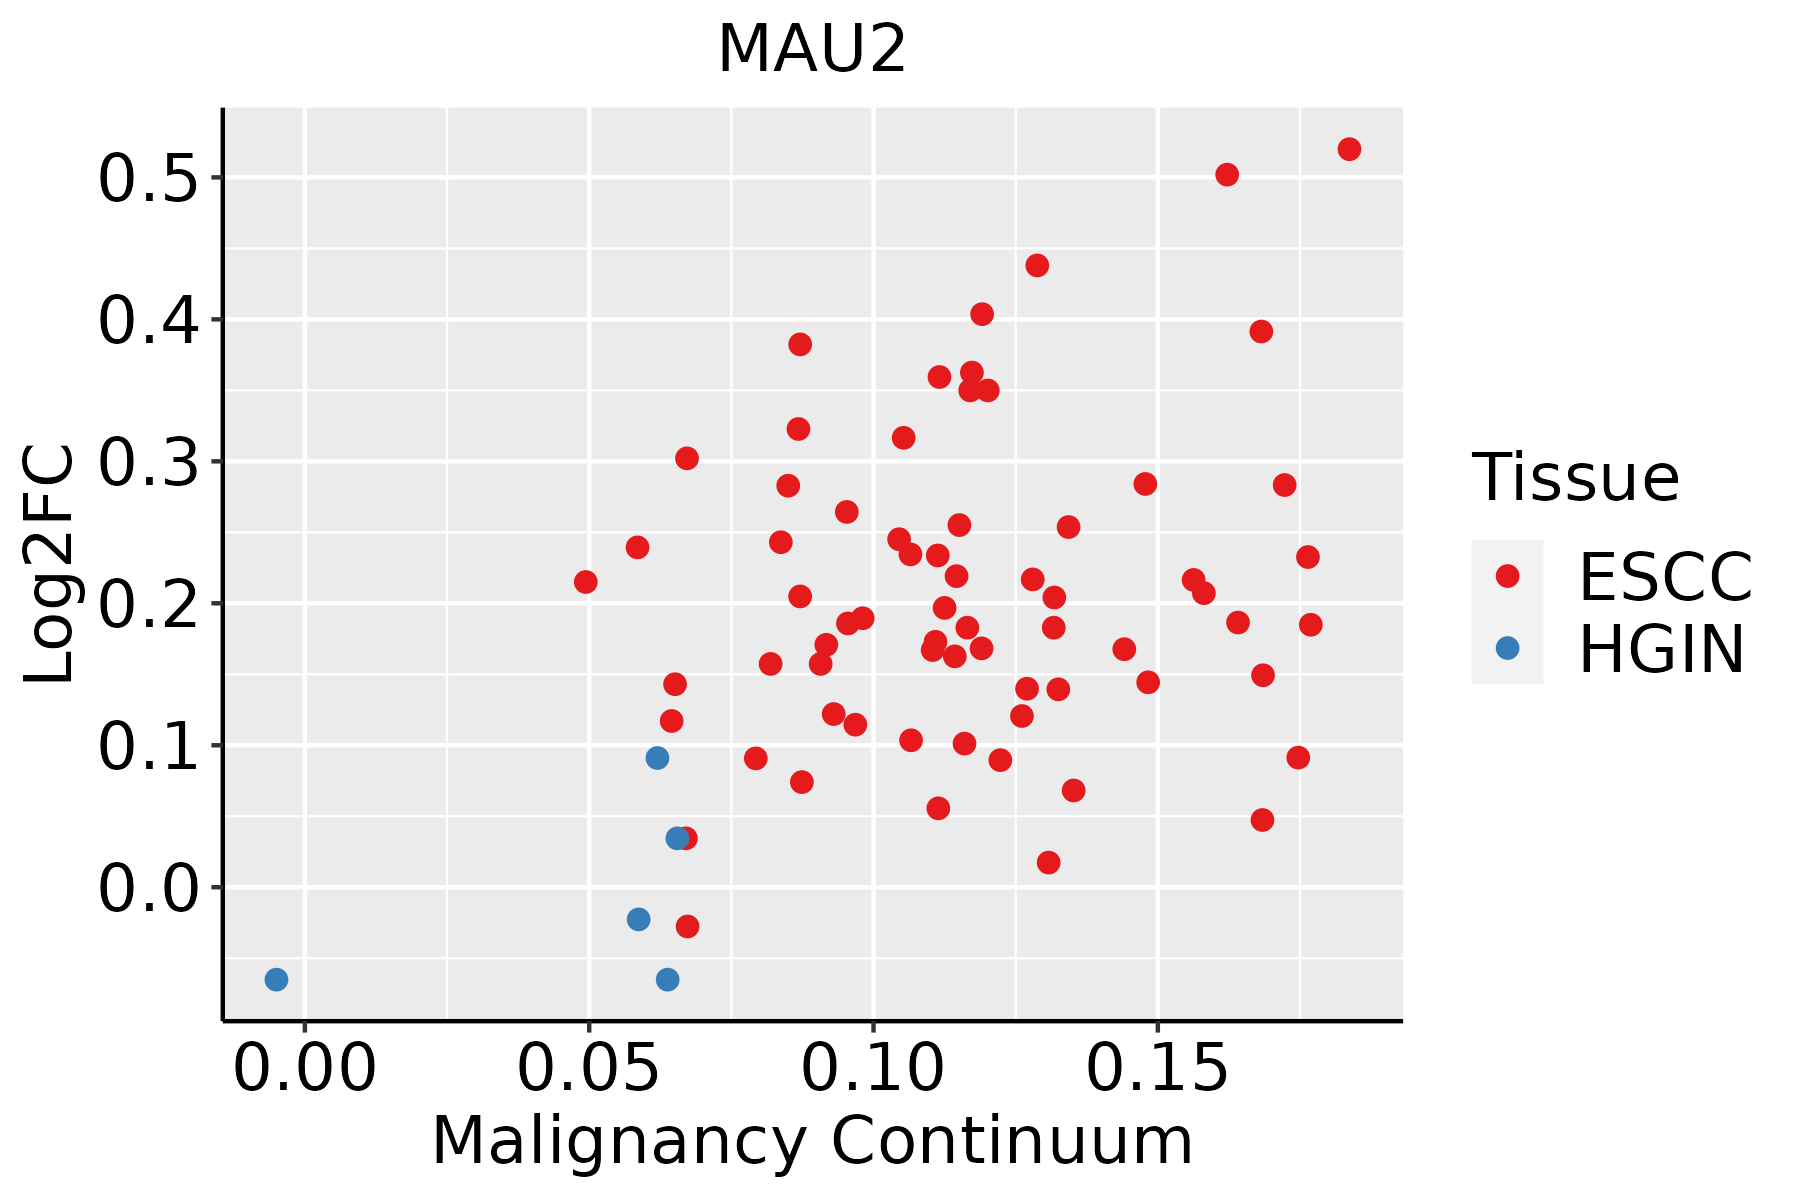 | ESCC: Esophageal squamous cell carcinoma |
| HGIN: High-grade intraepithelial neoplasias | ||
| LGIN: Low-grade intraepithelial neoplasias | ||
| Liver | 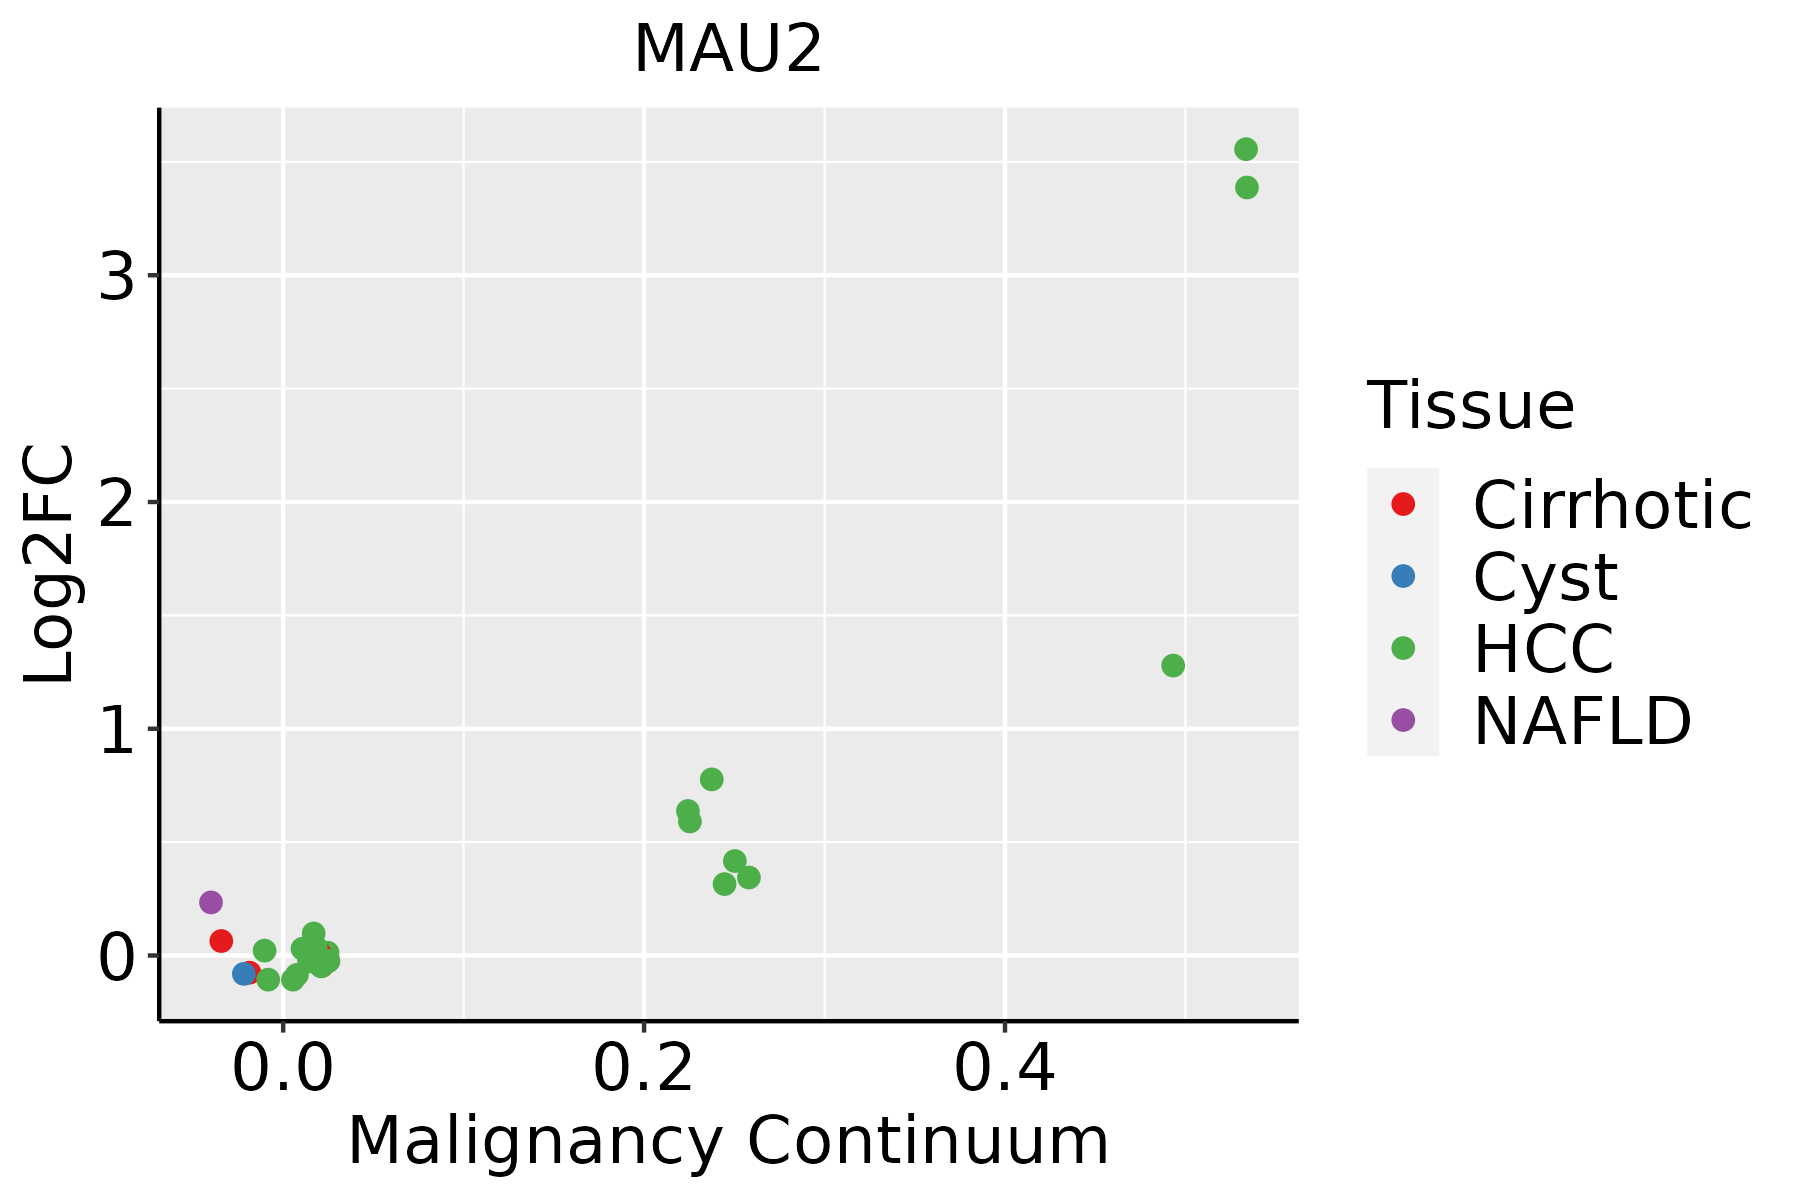 | HCC: Hepatocellular carcinoma |
| NAFLD: Non-alcoholic fatty liver disease | ||
| Thyroid | 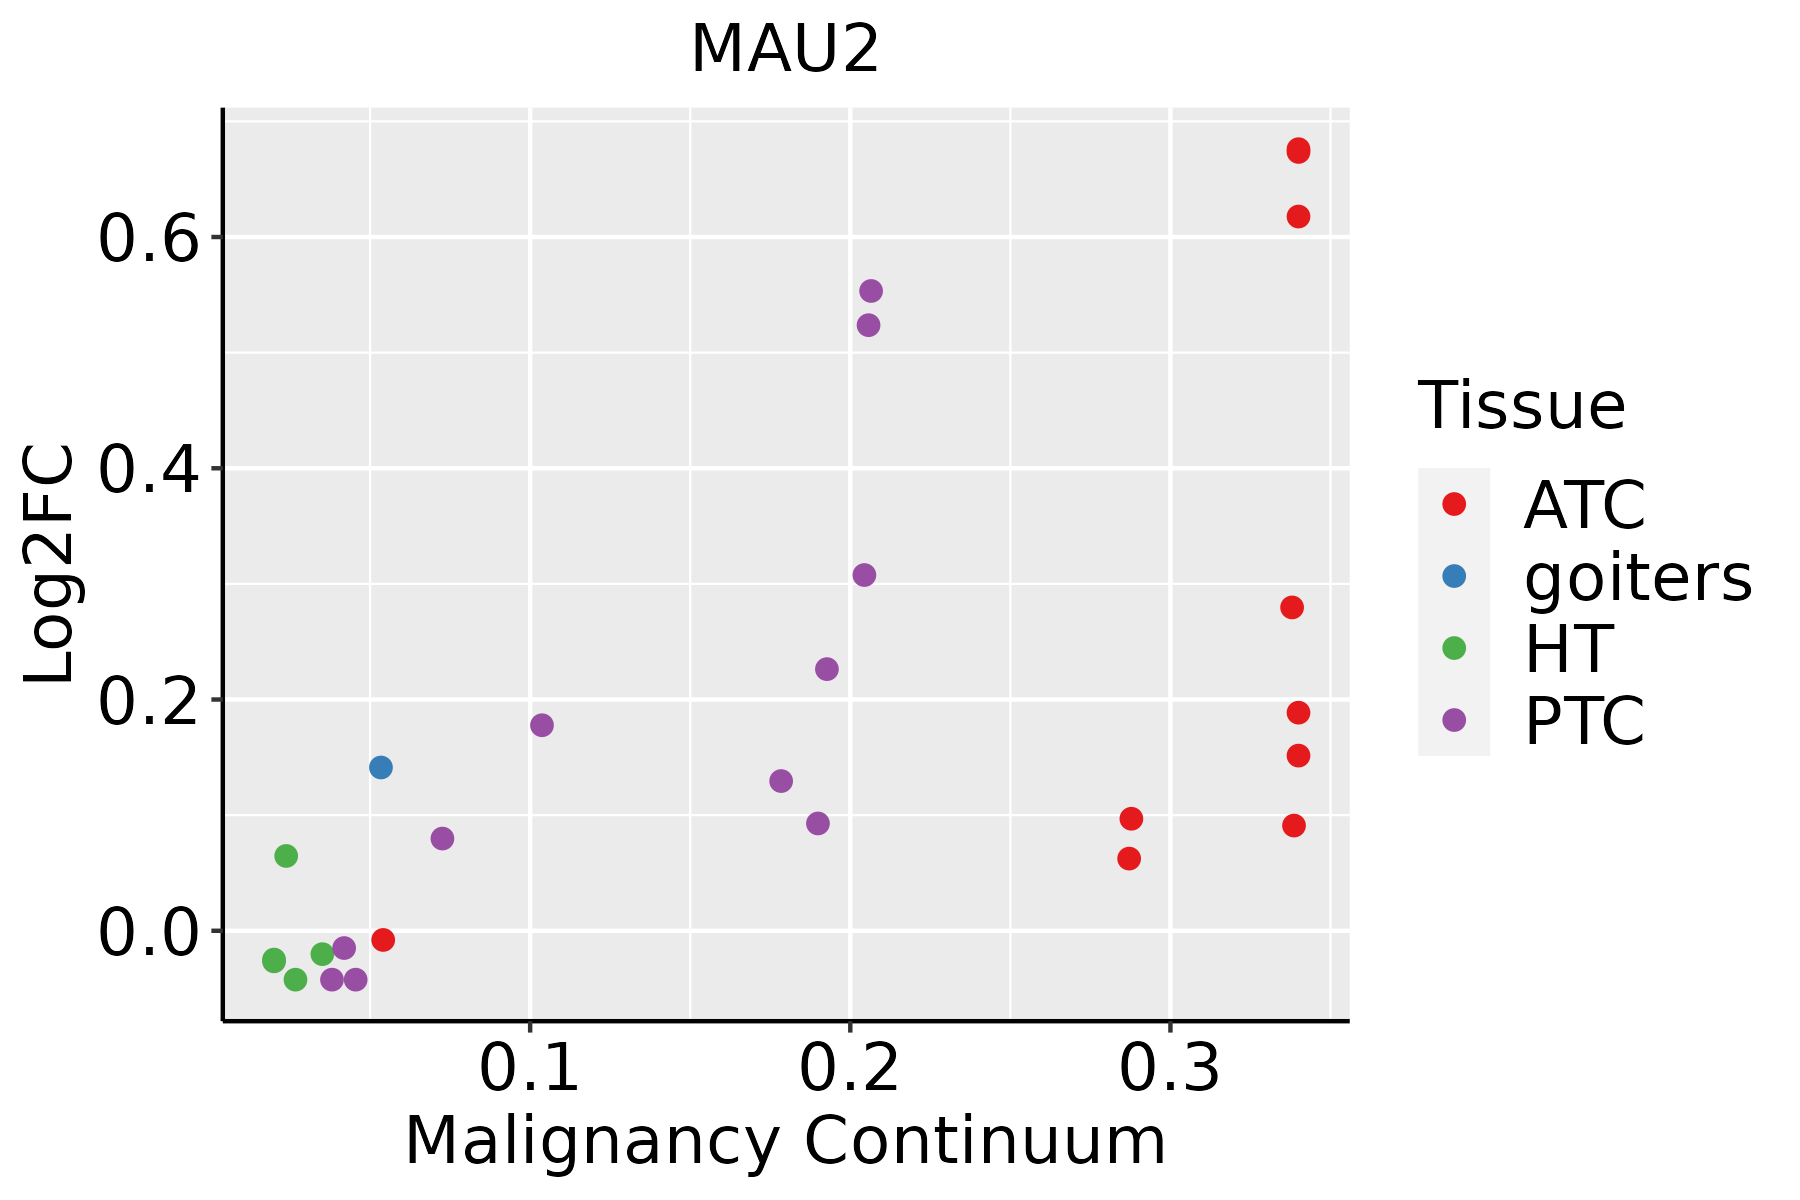 | ATC: Anaplastic thyroid cancer |
| HT: Hashimoto's thyroiditis | ||
| PTC: Papillary thyroid cancer |
| ∗log2FC in expression of this searched gene in stem-like cells from each diseased tissue sample relative to stem-like cells in normal samples in each tissue plotted against the malignancy continuum. Samples are colored based on if they are from different disease stage. |
Top |
Malignant transformation related pathway analysis |
| Find out the enriched GO biological processes and KEGG pathways involved in transition from healthy to precancer to cancer |
| Tissue | Disease Stage | Enriched GO biological Processes |
| Colorectum | AD |  |
| Colorectum | SER |  |
| Colorectum | MSS |  |
| Colorectum | MSI-H |  |
| Colorectum | FAP |  |
| ∗Top 15 enriched GO BP terms are showed in the bar plot of each disease state in each tissue. Each row represents a significant GO biological process which is colored according to the -log10(p.adjust). |
| Page: 1 2 3 4 5 6 7 8 9 |
| GO ID | Tissue | Disease Stage | Description | Gene Ratio | Bg Ratio | pvalue | p.adjust | Count |
| GO:014001414 | Esophagus | ESCC | mitotic nuclear division | 218/8552 | 287/18723 | 6.17e-26 | 1.78e-23 | 218 |
| GO:000007011 | Esophagus | ESCC | mitotic sister chromatid segregation | 138/8552 | 168/18723 | 1.37e-22 | 2.63e-20 | 138 |
| GO:00008194 | Esophagus | ESCC | sister chromatid segregation | 157/8552 | 202/18723 | 8.41e-21 | 1.33e-18 | 157 |
| GO:000705911 | Esophagus | ESCC | chromosome segregation | 238/8552 | 346/18723 | 1.72e-18 | 1.82e-16 | 238 |
| GO:00482853 | Esophagus | ESCC | organelle fission | 301/8552 | 488/18723 | 4.64e-13 | 2.12e-11 | 301 |
| GO:00988133 | Esophagus | ESCC | nuclear chromosome segregation | 187/8552 | 281/18723 | 1.00e-12 | 4.36e-11 | 187 |
| GO:00002802 | Esophagus | ESCC | nuclear division | 270/8552 | 439/18723 | 1.17e-11 | 4.24e-10 | 270 |
| GO:003450211 | Esophagus | ESCC | protein localization to chromosome | 70/8552 | 92/18723 | 2.54e-09 | 5.64e-08 | 70 |
| GO:00070648 | Esophagus | ESCC | mitotic sister chromatid cohesion | 23/8552 | 28/18723 | 8.23e-05 | 6.01e-04 | 23 |
| GO:00340867 | Esophagus | ESCC | maintenance of sister chromatid cohesion | 11/8552 | 12/18723 | 1.26e-03 | 6.06e-03 | 11 |
| GO:00340887 | Esophagus | ESCC | maintenance of mitotic sister chromatid cohesion | 11/8552 | 12/18723 | 1.26e-03 | 6.06e-03 | 11 |
| GO:00070627 | Esophagus | ESCC | sister chromatid cohesion | 40/8552 | 62/18723 | 2.14e-03 | 9.54e-03 | 40 |
| GO:0071168 | Esophagus | ESCC | protein localization to chromatin | 21/8552 | 31/18723 | 1.10e-02 | 3.70e-02 | 21 |
| GO:014001411 | Liver | HCC | mitotic nuclear division | 174/7958 | 287/18723 | 3.74e-10 | 1.23e-08 | 174 |
| GO:0000070 | Liver | HCC | mitotic sister chromatid segregation | 110/7958 | 168/18723 | 1.42e-09 | 4.25e-08 | 110 |
| GO:00008191 | Liver | HCC | sister chromatid segregation | 128/7958 | 202/18723 | 1.59e-09 | 4.73e-08 | 128 |
| GO:0007059 | Liver | HCC | chromosome segregation | 197/7958 | 346/18723 | 3.57e-08 | 7.87e-07 | 197 |
| GO:0098813 | Liver | HCC | nuclear chromosome segregation | 157/7958 | 281/18723 | 3.82e-06 | 4.95e-05 | 157 |
| GO:0048285 | Liver | HCC | organelle fission | 254/7958 | 488/18723 | 1.07e-05 | 1.23e-04 | 254 |
| GO:00345021 | Liver | HCC | protein localization to chromosome | 55/7958 | 92/18723 | 6.12e-04 | 3.82e-03 | 55 |
| Page: 1 2 3 |
| Pathway ID | Tissue | Disease Stage | Description | Gene Ratio | Bg Ratio | pvalue | p.adjust | qvalue | Count |
| hsa0411023 | Esophagus | ESCC | Cell cycle | 126/4205 | 157/8465 | 1.34e-15 | 5.60e-14 | 2.87e-14 | 126 |
| hsa0411033 | Esophagus | ESCC | Cell cycle | 126/4205 | 157/8465 | 1.34e-15 | 5.60e-14 | 2.87e-14 | 126 |
| hsa041102 | Liver | HCC | Cell cycle | 106/4020 | 157/8465 | 2.54e-07 | 3.04e-06 | 1.69e-06 | 106 |
| hsa041103 | Liver | HCC | Cell cycle | 106/4020 | 157/8465 | 2.54e-07 | 3.04e-06 | 1.69e-06 | 106 |
| Page: 1 |
Top |
Cell-cell communication analysis |
| Identification of potential cell-cell interactions between two cell types and their ligand-receptor pairs for different disease states |
| Ligand | Receptor | LRpair | Pathway | Tissue | Disease Stage |
| Page: 1 |
Top |
Single-cell gene regulatory network inference analysis |
| Find out the significant the regulons (TFs) and the target genes of each regulon across cell types for different disease states |
| TF | Cell Type | Tissue | Disease Stage | Target Gene | RSS | Regulon Activity |
| ∗The dot plots of a searched regulon are shown for all cell subpopulations in each disease state of each tissue based on the regulon specific score inferred using pySCENIC and by calculating the average expression. |
| Page: 1 |
Top |
Somatic mutation of malignant transformation related genes |
| Annotation of somatic variants for genes involved in malignant transformation |
| Hugo Symbol | Variant Class | Variant Classification | dbSNP RS | HGVSc | HGVSp | HGVSp Short | SWISSPROT | BIOTYPE | SIFT | PolyPhen | Tumor Sample Barcode | Tissue | Histology | Sex | Age | Stage | Therapy Types | Drugs | Outcome |
| MAU2 | insertion | Frame_Shift_Ins | novel | c.1286_1287insCC | p.Glu429AspfsTer59 | p.E429Dfs*59 | Q9Y6X3 | protein_coding | TCGA-BH-A0E2-01 | Breast | breast invasive carcinoma | Female | <65 | III/IV | Chemotherapy | doxorubicin | SD | ||
| MAU2 | insertion | Frame_Shift_Ins | novel | c.1287_1288insGCATATGCCTTGATGGCAGT | p.Gly430AlafsTer64 | p.G430Afs*64 | Q9Y6X3 | protein_coding | TCGA-BH-A0E2-01 | Breast | breast invasive carcinoma | Female | <65 | III/IV | Chemotherapy | doxorubicin | SD | ||
| MAU2 | SNV | Missense_Mutation | c.1758N>A | p.Asn586Lys | p.N586K | Q9Y6X3 | protein_coding | tolerated(0.68) | benign(0.022) | TCGA-C5-A7UE-01 | Cervix | cervical & endocervical cancer | Female | <65 | I/II | Chemotherapy | cisplatin | SD | |
| MAU2 | SNV | Missense_Mutation | c.1585G>A | p.Ala529Thr | p.A529T | Q9Y6X3 | protein_coding | deleterious(0) | probably_damaging(0.955) | TCGA-AA-3977-01 | Colorectum | colon adenocarcinoma | Male | >=65 | I/II | Unknown | Unknown | SD | |
| MAU2 | SNV | Missense_Mutation | c.252G>T | p.Gln84His | p.Q84H | Q9Y6X3 | protein_coding | tolerated(0.38) | benign(0.013) | TCGA-AA-A01P-01 | Colorectum | colon adenocarcinoma | Female | >=65 | III/IV | Unknown | Unknown | PD | |
| MAU2 | SNV | Missense_Mutation | novel | c.389N>C | p.Leu130Pro | p.L130P | Q9Y6X3 | protein_coding | deleterious(0) | probably_damaging(1) | TCGA-AD-6964-01 | Colorectum | colon adenocarcinoma | Male | <65 | III/IV | Chemotherapy | folfox | PD |
| MAU2 | SNV | Missense_Mutation | rs753815220 | c.1420N>T | p.Arg474Cys | p.R474C | Q9Y6X3 | protein_coding | deleterious(0) | probably_damaging(0.973) | TCGA-G4-6628-01 | Colorectum | colon adenocarcinoma | Male | >=65 | I/II | Unknown | Unknown | SD |
| MAU2 | SNV | Missense_Mutation | c.1726C>T | p.His576Tyr | p.H576Y | Q9Y6X3 | protein_coding | tolerated(0.09) | benign(0.244) | TCGA-NH-A50V-01 | Colorectum | colon adenocarcinoma | Male | >=65 | III/IV | Chemotherapy | fluorouracil | CR | |
| MAU2 | SNV | Missense_Mutation | rs748054579 | c.1211C>T | p.Thr404Met | p.T404M | Q9Y6X3 | protein_coding | tolerated(0.09) | possibly_damaging(0.671) | TCGA-A5-A0G1-01 | Endometrium | uterine corpus endometrioid carcinoma | Female | >=65 | I/II | Unknown | Unknown | SD |
| MAU2 | SNV | Missense_Mutation | novel | c.1104G>T | p.Gln368His | p.Q368H | Q9Y6X3 | protein_coding | tolerated(0.65) | benign(0.003) | TCGA-A5-A0G2-01 | Endometrium | uterine corpus endometrioid carcinoma | Female | <65 | III/IV | Unknown | Unknown | SD |
| Page: 1 2 3 4 5 |
Top |
Related drugs of malignant transformation related genes |
| Identification of chemicals and drugs interact with genes involved in malignant transfromation |
| (DGIdb 4.0) |
| Entrez ID | Symbol | Category | Interaction Types | Drug Claim Name | Drug Name | PMIDs |
| Page: 1 |

Copyright 2023-Present -The University of Texas Health Science Center at Houston |