
|
|||||
|
 | |
| |
| |
| |
| |
| |
|
Gene: MATR3 |
Gene summary for MATR3 |
| Gene information | Species | Human | Gene symbol | MATR3 | Gene ID | 9782 |
| Gene name | matrin 3 | |
| Gene Alias | ALS21 | |
| Cytomap | 5q31.2 | |
| Gene Type | protein-coding | GO ID | GO:0002218 | UniProtAcc | A0A0R4J2E8 |
Top |
Malignant transformation analysis |
| Identification of the aberrant gene expression in precancerous and cancerous lesions by comparing the gene expression of stem-like cells in diseased tissues with normal stem cells |
| Entrez ID | Symbol | Replicates | Species | Organ | Tissue | Adj P-value | Log2FC | Malignancy |
| 9782 | MATR3 | HTA11_3410_2000001011 | Human | Colorectum | AD | 3.67e-02 | -1.27e-01 | 0.0155 |
| 9782 | MATR3 | HTA11_347_2000001011 | Human | Colorectum | AD | 1.53e-02 | -1.27e-01 | -0.1954 |
| 9782 | MATR3 | HTA11_696_2000001011 | Human | Colorectum | AD | 4.07e-04 | -1.27e-01 | -0.1464 |
| 9782 | MATR3 | HTA11_866_2000001011 | Human | Colorectum | AD | 4.07e-04 | -1.27e-01 | -0.1001 |
| 9782 | MATR3 | HTA11_7696_3000711011 | Human | Colorectum | AD | 4.07e-04 | -1.27e-01 | 0.0674 |
| 9782 | MATR3 | HTA11_99999970781_79442 | Human | Colorectum | MSS | 2.45e-30 | 9.31e-01 | 0.294 |
| 9782 | MATR3 | HTA11_99999965062_69753 | Human | Colorectum | MSI-H | 8.78e-08 | 1.28e+00 | 0.3487 |
| 9782 | MATR3 | HTA11_99999965104_69814 | Human | Colorectum | MSS | 2.15e-15 | 8.35e-01 | 0.281 |
| 9782 | MATR3 | HTA11_99999971662_82457 | Human | Colorectum | MSS | 3.58e-11 | 5.17e-01 | 0.3859 |
| 9782 | MATR3 | A015-C-203 | Human | Colorectum | FAP | 1.92e-04 | -1.27e-01 | -0.1294 |
| 9782 | MATR3 | A001-C-108 | Human | Colorectum | FAP | 2.28e-02 | -9.92e-02 | -0.0272 |
| 9782 | MATR3 | A002-C-205 | Human | Colorectum | FAP | 1.15e-02 | -1.27e-01 | -0.1236 |
| 9782 | MATR3 | A015-C-104 | Human | Colorectum | FAP | 1.92e-04 | -1.15e-01 | -0.1899 |
| 9782 | MATR3 | A002-C-116 | Human | Colorectum | FAP | 1.94e-02 | -8.43e-02 | -0.0452 |
| 9782 | MATR3 | A018-E-020 | Human | Colorectum | FAP | 3.96e-02 | -1.27e-01 | -0.2034 |
| 9782 | MATR3 | LZE4T | Human | Esophagus | ESCC | 3.28e-06 | -4.83e-01 | 0.0811 |
| 9782 | MATR3 | LZE8T | Human | Esophagus | ESCC | 7.80e-05 | -5.37e-01 | 0.067 |
| 9782 | MATR3 | LZE20T | Human | Esophagus | ESCC | 3.16e-06 | -5.50e-01 | 0.0662 |
| 9782 | MATR3 | LZE22D1 | Human | Esophagus | HGIN | 1.12e-02 | -5.50e-01 | 0.0595 |
| 9782 | MATR3 | LZE24T | Human | Esophagus | ESCC | 6.60e-09 | -5.19e-01 | 0.0596 |
| Page: 1 2 3 4 5 6 7 |
| Tissue | Expression Dynamics | Abbreviation |
| Colorectum (GSE201348) |  | FAP: Familial adenomatous polyposis |
| CRC: Colorectal cancer | ||
| Colorectum (HTA11) |  | AD: Adenomas |
| SER: Sessile serrated lesions | ||
| MSI-H: Microsatellite-high colorectal cancer | ||
| MSS: Microsatellite stable colorectal cancer | ||
| Esophagus | 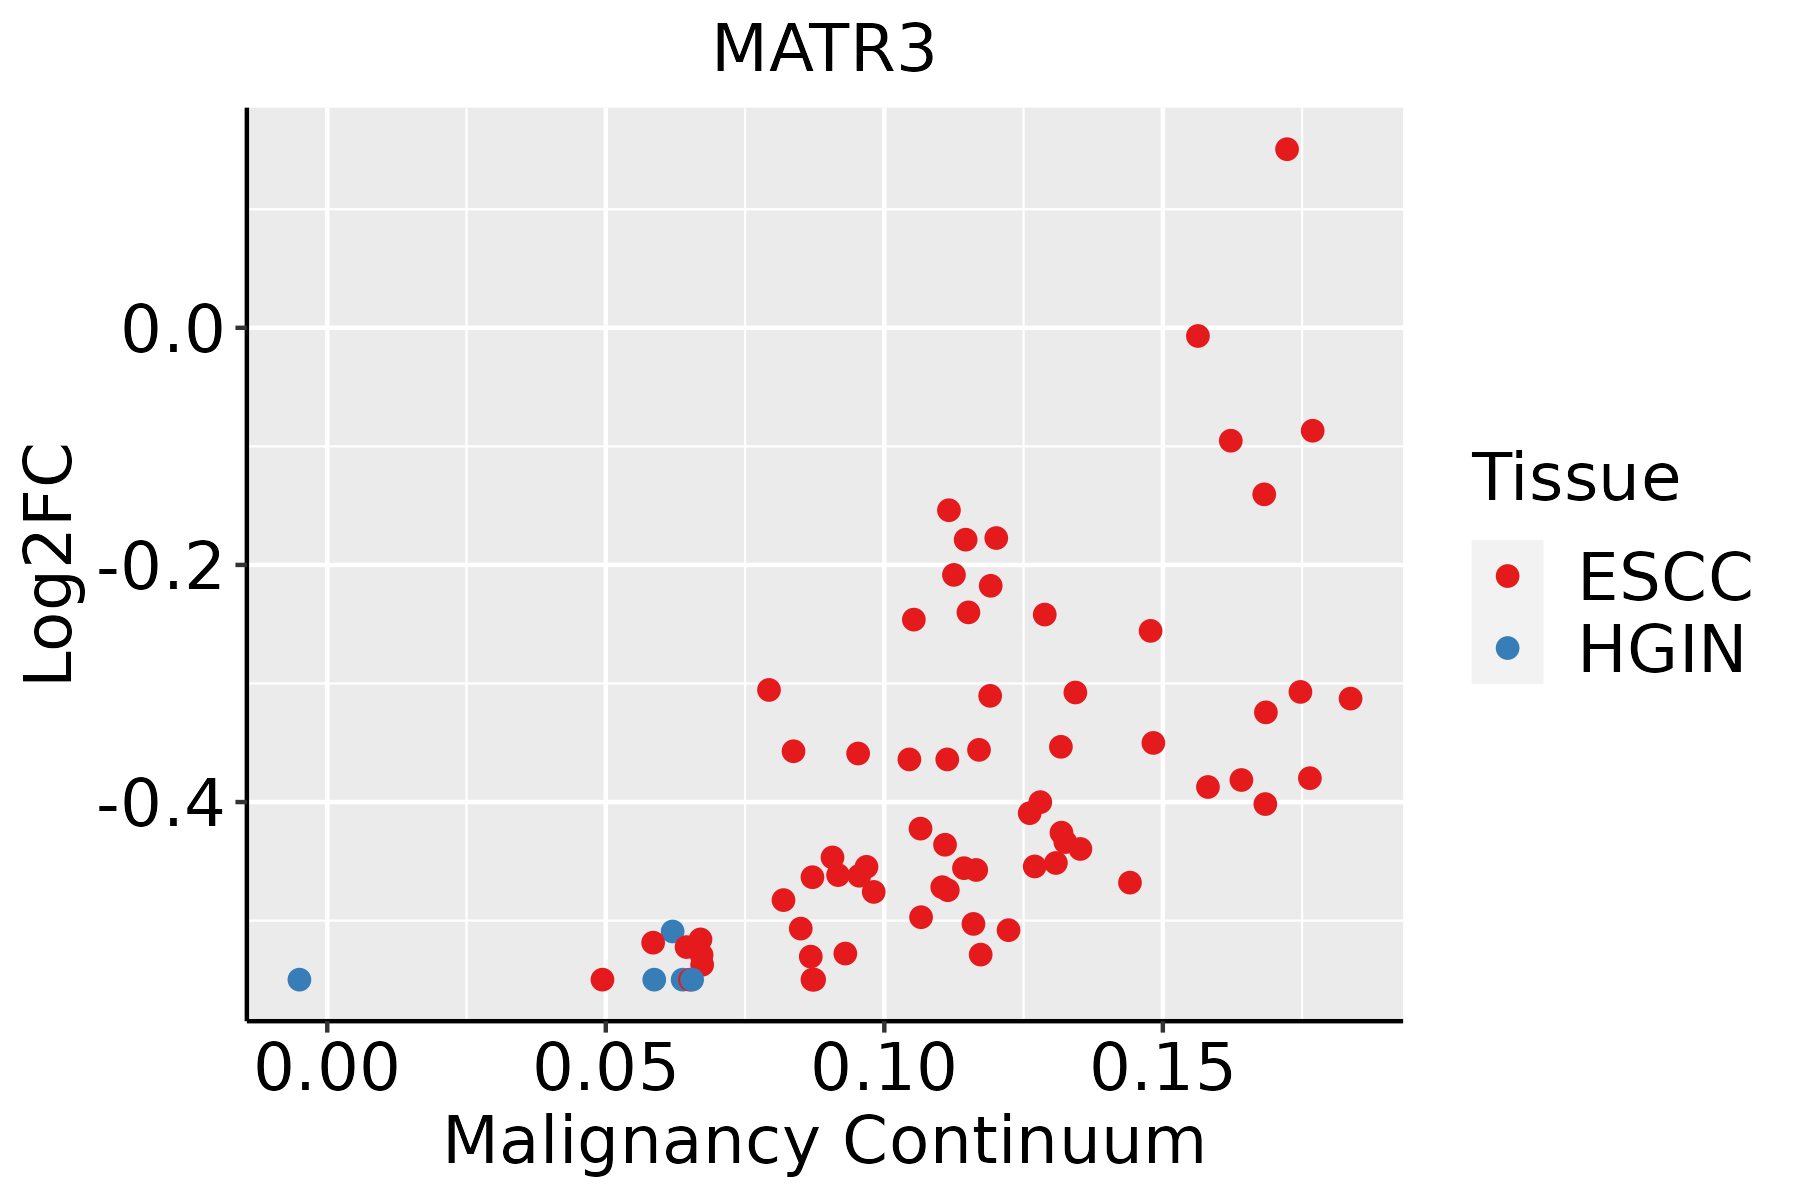 | ESCC: Esophageal squamous cell carcinoma |
| HGIN: High-grade intraepithelial neoplasias | ||
| LGIN: Low-grade intraepithelial neoplasias | ||
| Liver |  | HCC: Hepatocellular carcinoma |
| NAFLD: Non-alcoholic fatty liver disease | ||
| Prostate | 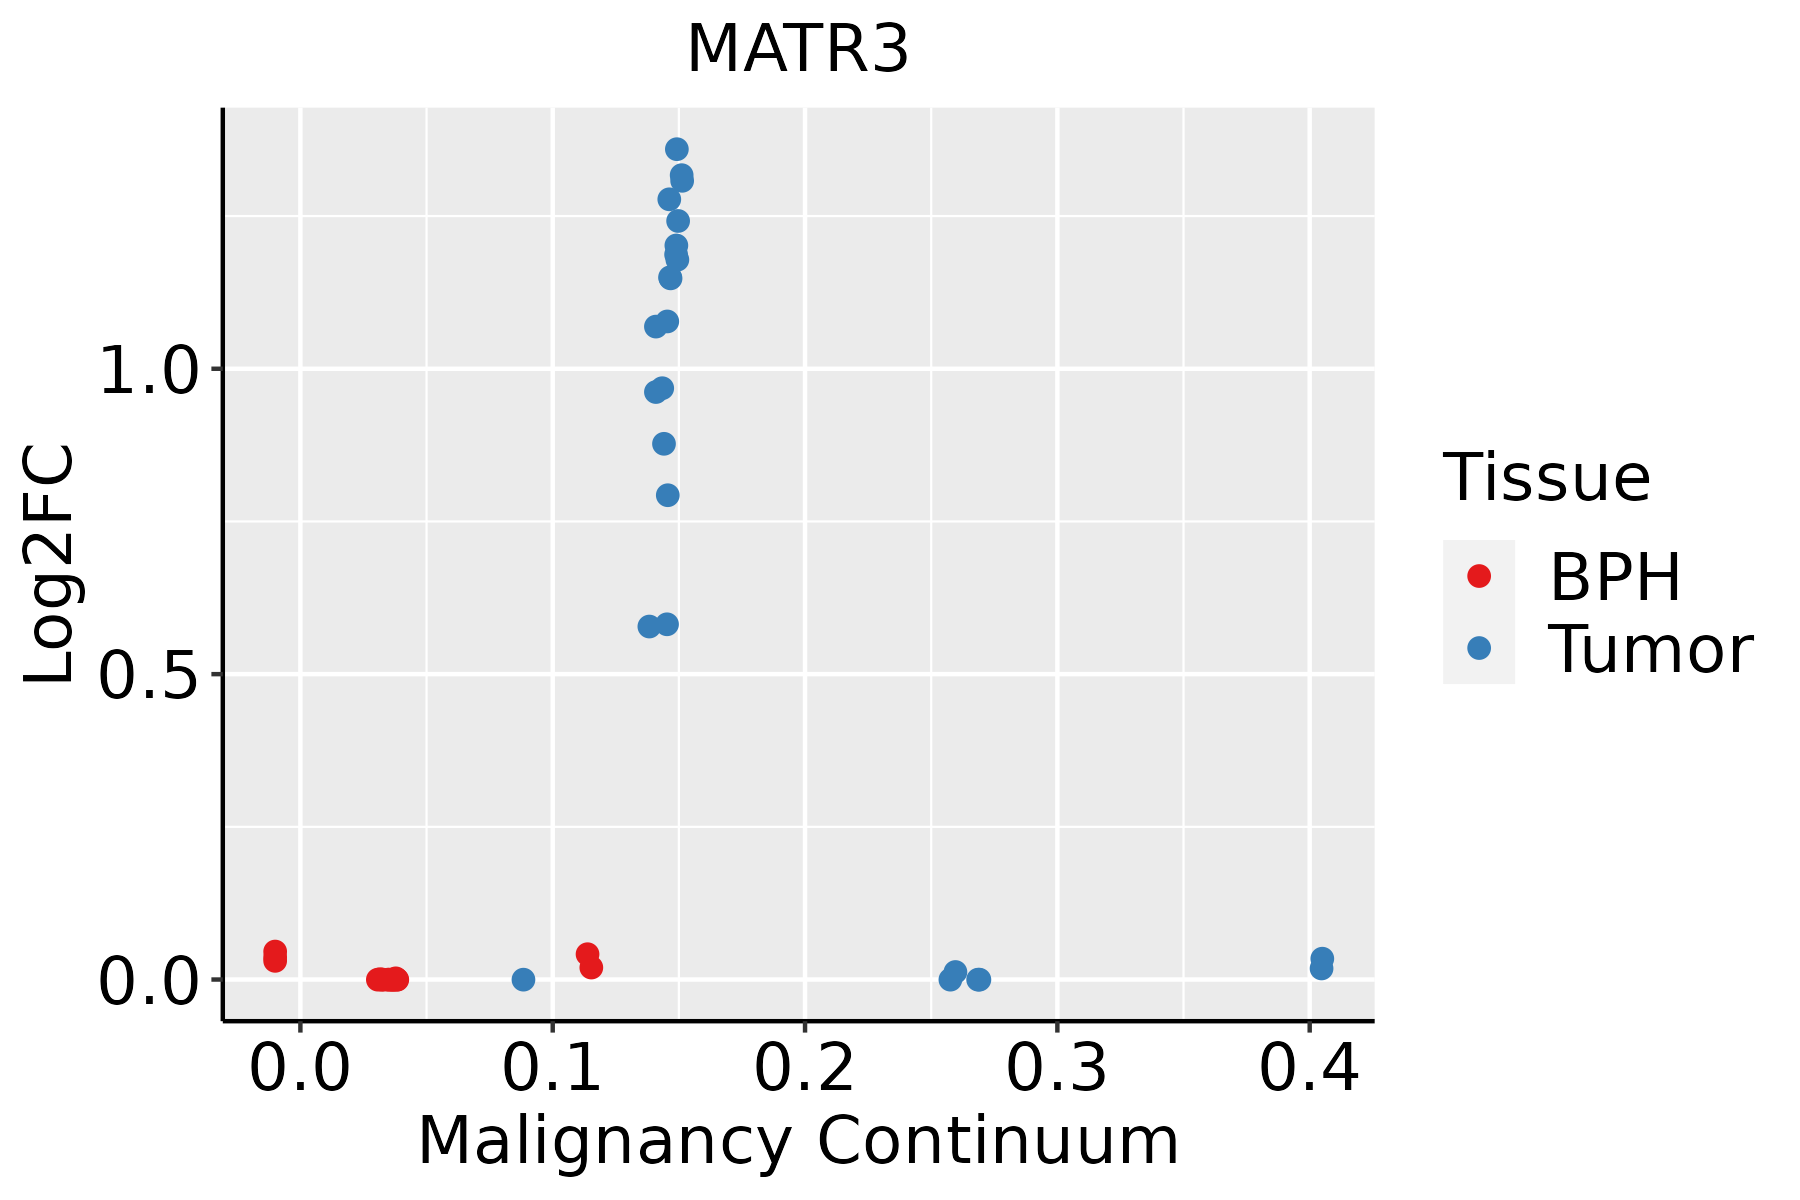 | BPH: Benign Prostatic Hyperplasia |
| Skin | 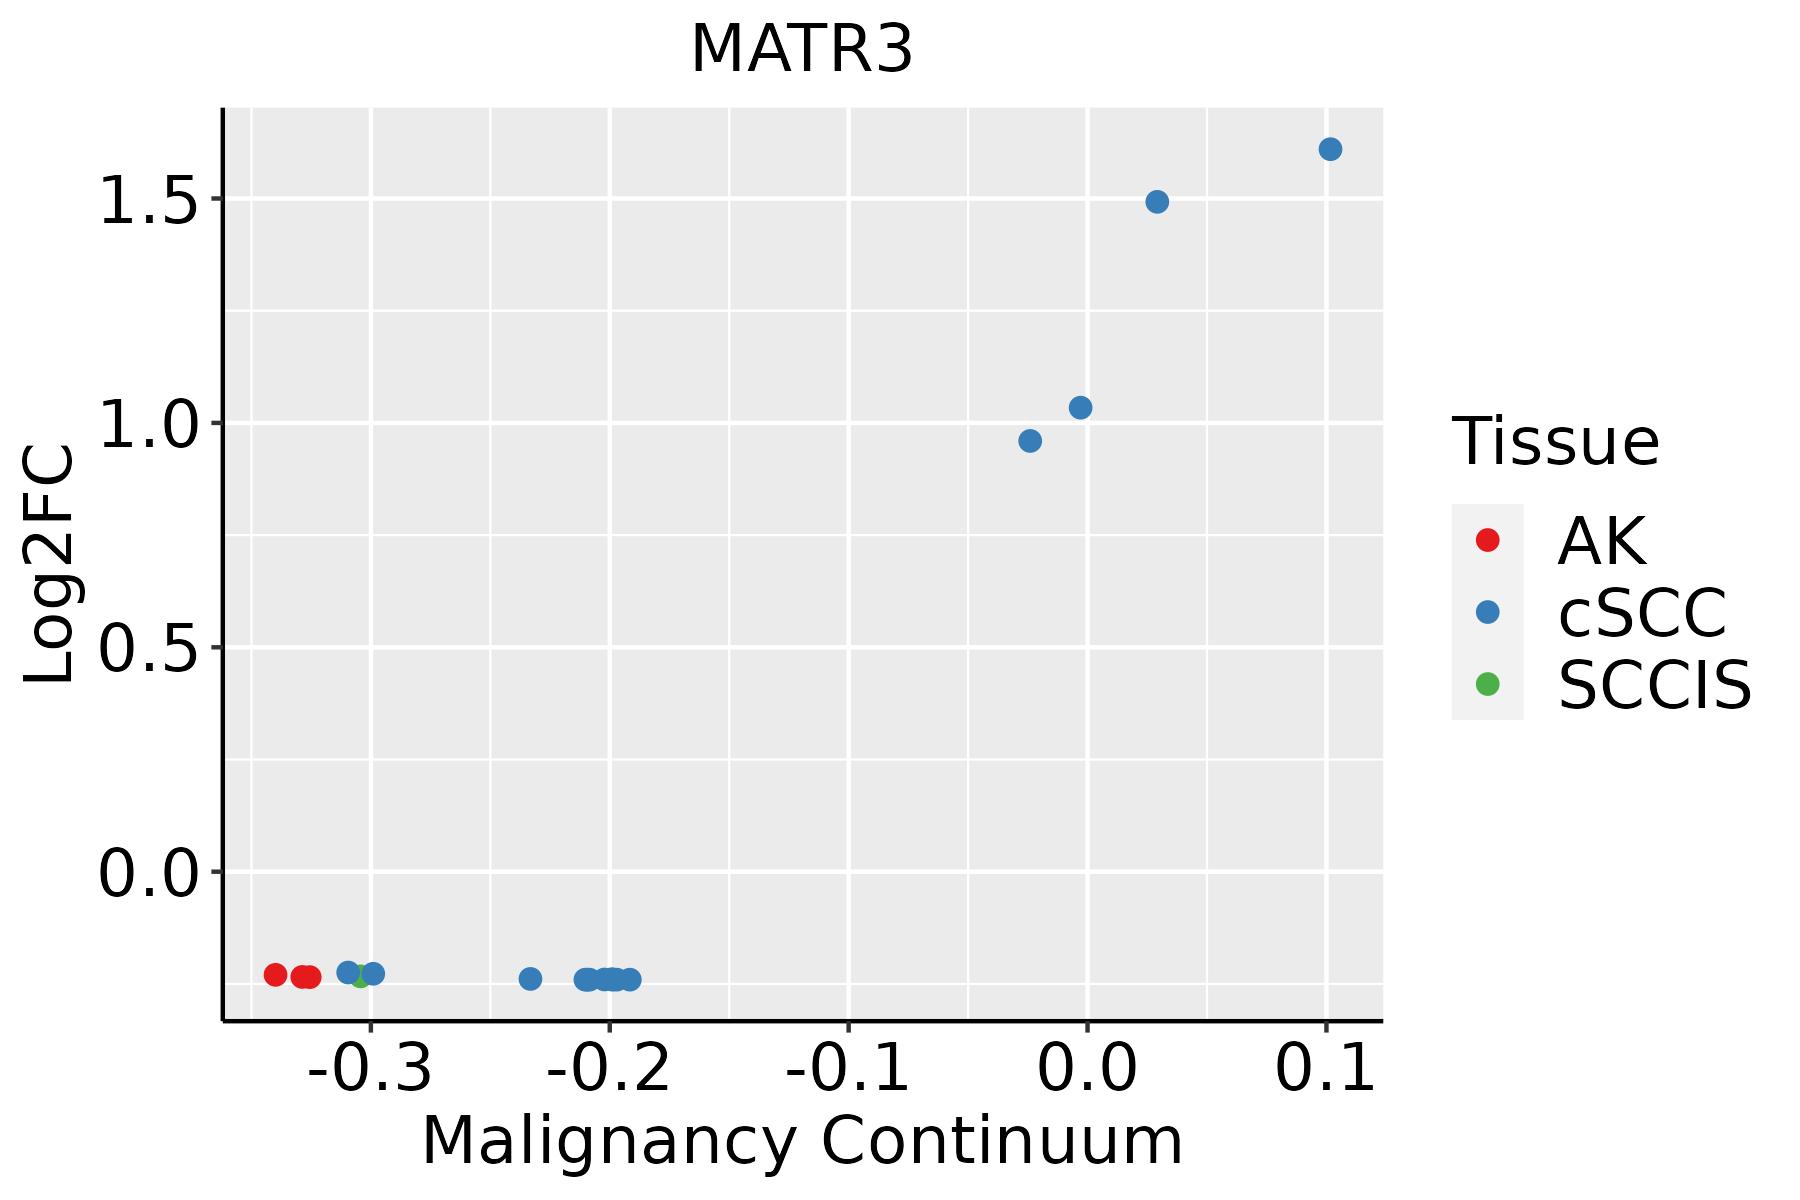 | AK: Actinic keratosis |
| cSCC: Cutaneous squamous cell carcinoma | ||
| SCCIS:squamous cell carcinoma in situ | ||
| Thyroid | 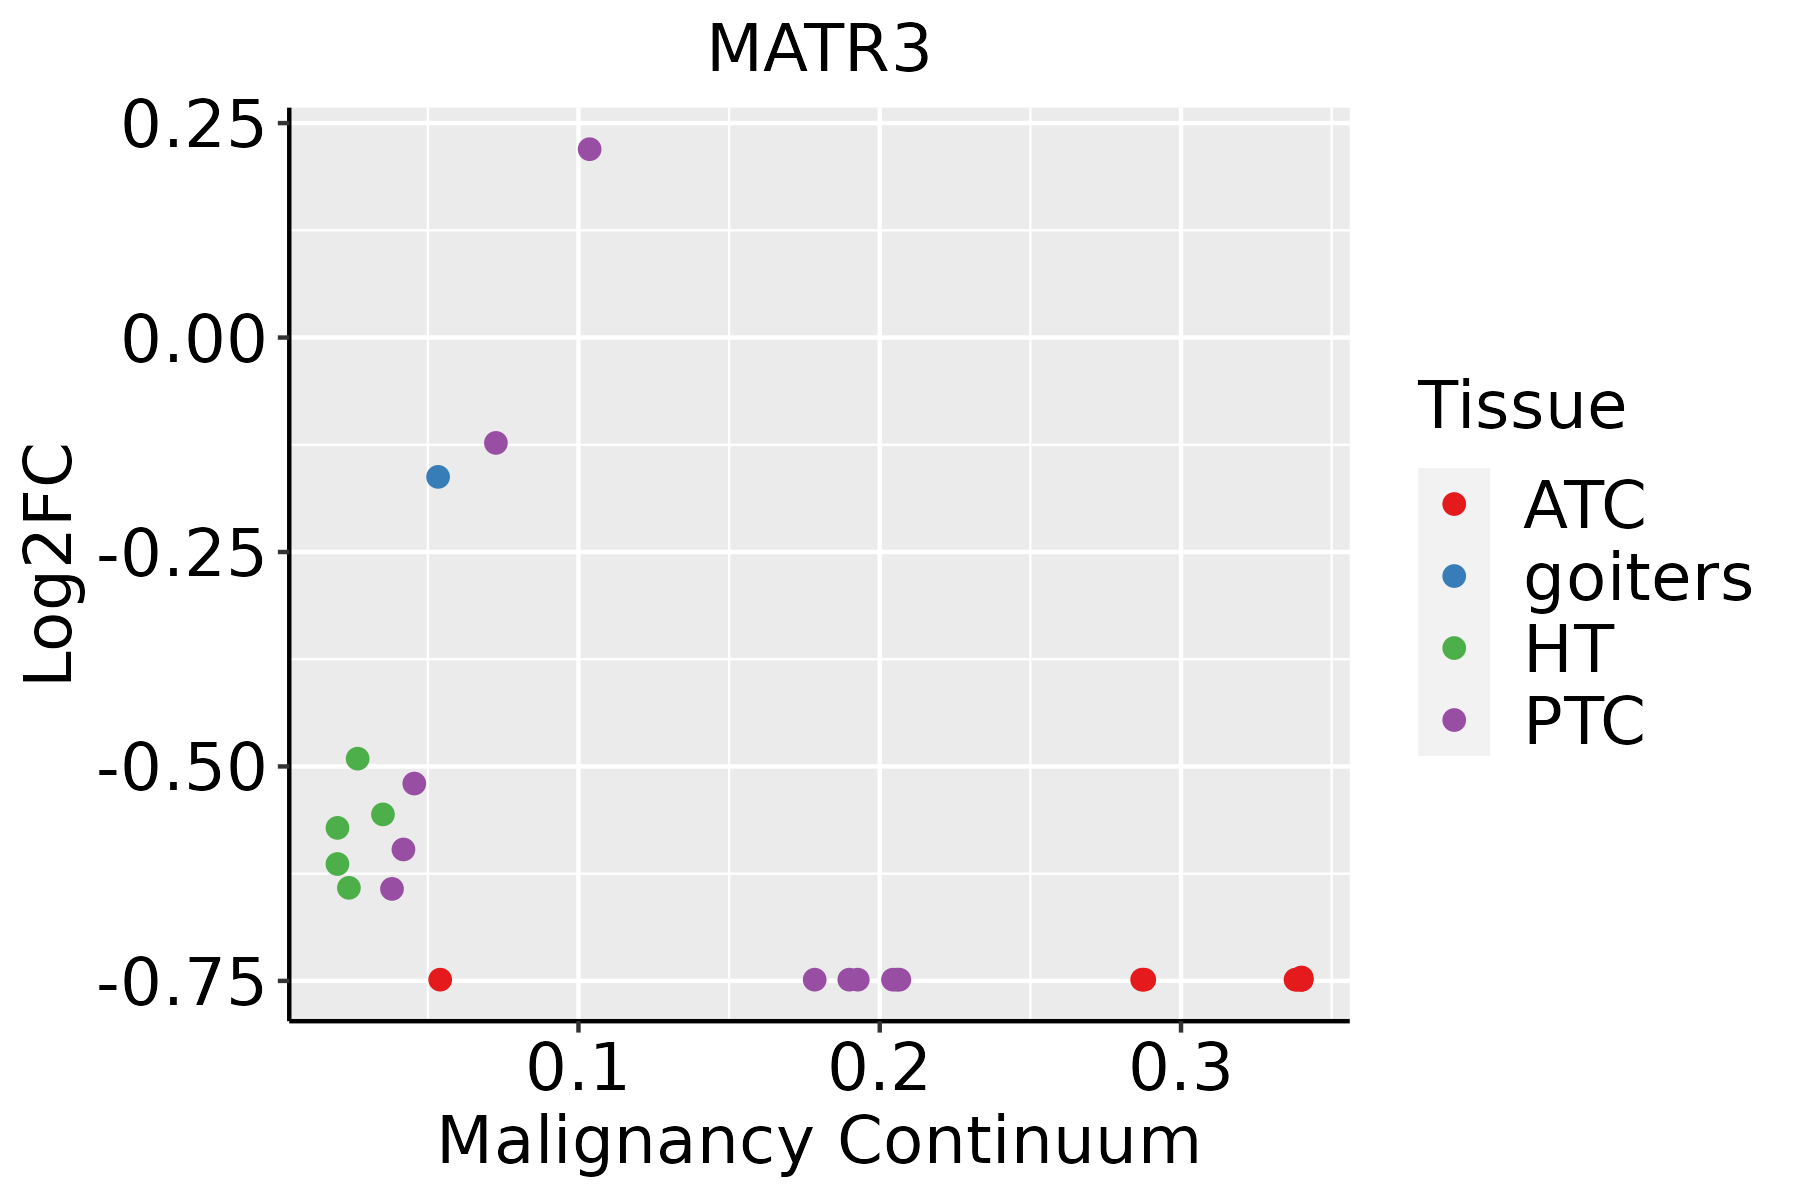 | ATC: Anaplastic thyroid cancer |
| HT: Hashimoto's thyroiditis | ||
| PTC: Papillary thyroid cancer |
| ∗log2FC in expression of this searched gene in stem-like cells from each diseased tissue sample relative to stem-like cells in normal samples in each tissue plotted against the malignancy continuum. Samples are colored based on if they are from different disease stage. |
Top |
Malignant transformation related pathway analysis |
| Find out the enriched GO biological processes and KEGG pathways involved in transition from healthy to precancer to cancer |
| Tissue | Disease Stage | Enriched GO biological Processes |
| Colorectum | AD |  |
| Colorectum | SER |  |
| Colorectum | MSS |  |
| Colorectum | MSI-H |  |
| Colorectum | FAP |  |
| ∗Top 15 enriched GO BP terms are showed in the bar plot of each disease state in each tissue. Each row represents a significant GO biological process which is colored according to the -log10(p.adjust). |
| Page: 1 2 3 4 5 6 7 8 9 |
| GO ID | Tissue | Disease Stage | Description | Gene Ratio | Bg Ratio | pvalue | p.adjust | Count |
| GO:0002831 | Colorectum | MSI-H | regulation of response to biotic stimulus | 39/1319 | 327/18723 | 8.79e-04 | 1.57e-02 | 39 |
| GO:0003279 | Colorectum | FAP | cardiac septum development | 25/2622 | 103/18723 | 3.64e-03 | 2.60e-02 | 25 |
| GO:0003281 | Colorectum | FAP | ventricular septum development | 18/2622 | 71/18723 | 7.82e-03 | 4.63e-02 | 18 |
| GO:0003205 | Colorectum | FAP | cardiac chamber development | 34/2622 | 161/18723 | 8.57e-03 | 4.96e-02 | 34 |
| GO:00028318 | Esophagus | ESCC | regulation of response to biotic stimulus | 191/8552 | 327/18723 | 2.12e-06 | 2.45e-05 | 191 |
| GO:00450885 | Esophagus | ESCC | regulation of innate immune response | 125/8552 | 218/18723 | 3.34e-04 | 1.96e-03 | 125 |
| GO:00031703 | Esophagus | ESCC | heart valve development | 39/8552 | 65/18723 | 1.41e-02 | 4.59e-02 | 39 |
| GO:00022185 | Esophagus | ESCC | activation of innate immune response | 32/8552 | 52/18723 | 1.55e-02 | 4.97e-02 | 32 |
| GO:00028312 | Liver | HCC | regulation of response to biotic stimulus | 173/7958 | 327/18723 | 8.55e-05 | 7.48e-04 | 173 |
| GO:00450881 | Liver | HCC | regulation of innate immune response | 113/7958 | 218/18723 | 3.27e-03 | 1.50e-02 | 113 |
| GO:0002218 | Liver | HCC | activation of innate immune response | 32/7958 | 52/18723 | 4.35e-03 | 1.89e-02 | 32 |
| GO:00031701 | Prostate | Tumor | heart valve development | 24/3246 | 65/18723 | 1.28e-04 | 1.19e-03 | 24 |
| GO:00032311 | Prostate | Tumor | cardiac ventricle development | 36/3246 | 123/18723 | 7.31e-04 | 5.08e-03 | 36 |
| GO:000328111 | Prostate | Tumor | ventricular septum development | 23/3246 | 71/18723 | 1.47e-03 | 9.08e-03 | 23 |
| GO:000320511 | Prostate | Tumor | cardiac chamber development | 43/3246 | 161/18723 | 1.86e-03 | 1.09e-02 | 43 |
| GO:000327911 | Prostate | Tumor | cardiac septum development | 29/3246 | 103/18723 | 4.26e-03 | 2.13e-02 | 29 |
| GO:00028316 | Prostate | Tumor | regulation of response to biotic stimulus | 74/3246 | 327/18723 | 8.03e-03 | 3.54e-02 | 74 |
| GO:00321038 | Skin | AK | positive regulation of response to external stimulus | 74/1910 | 427/18723 | 3.63e-06 | 9.07e-05 | 74 |
| GO:00028319 | Skin | AK | regulation of response to biotic stimulus | 53/1910 | 327/18723 | 4.63e-04 | 4.31e-03 | 53 |
| GO:00032313 | Skin | AK | cardiac ventricle development | 25/1910 | 123/18723 | 5.89e-04 | 5.21e-03 | 25 |
| Page: 1 2 3 |
| Pathway ID | Tissue | Disease Stage | Description | Gene Ratio | Bg Ratio | pvalue | p.adjust | qvalue | Count |
| hsa05014 | Colorectum | AD | Amyotrophic lateral sclerosis | 164/2092 | 364/8465 | 4.28e-18 | 1.27e-16 | 8.09e-17 | 164 |
| hsa050141 | Colorectum | AD | Amyotrophic lateral sclerosis | 164/2092 | 364/8465 | 4.28e-18 | 1.27e-16 | 8.09e-17 | 164 |
| hsa050144 | Colorectum | MSS | Amyotrophic lateral sclerosis | 156/1875 | 364/8465 | 1.43e-19 | 4.62e-18 | 2.83e-18 | 156 |
| hsa050145 | Colorectum | MSS | Amyotrophic lateral sclerosis | 156/1875 | 364/8465 | 1.43e-19 | 4.62e-18 | 2.83e-18 | 156 |
| hsa050146 | Colorectum | MSI-H | Amyotrophic lateral sclerosis | 95/797 | 364/8465 | 2.31e-21 | 1.50e-19 | 1.26e-19 | 95 |
| hsa050147 | Colorectum | MSI-H | Amyotrophic lateral sclerosis | 95/797 | 364/8465 | 2.31e-21 | 1.50e-19 | 1.26e-19 | 95 |
| hsa050148 | Colorectum | FAP | Amyotrophic lateral sclerosis | 91/1404 | 364/8465 | 1.84e-05 | 2.36e-04 | 1.44e-04 | 91 |
| hsa050149 | Colorectum | FAP | Amyotrophic lateral sclerosis | 91/1404 | 364/8465 | 1.84e-05 | 2.36e-04 | 1.44e-04 | 91 |
| hsa0501430 | Esophagus | HGIN | Amyotrophic lateral sclerosis | 140/1383 | 364/8465 | 2.13e-25 | 1.16e-23 | 9.19e-24 | 140 |
| hsa05014113 | Esophagus | HGIN | Amyotrophic lateral sclerosis | 140/1383 | 364/8465 | 2.13e-25 | 1.16e-23 | 9.19e-24 | 140 |
| hsa05014210 | Esophagus | ESCC | Amyotrophic lateral sclerosis | 266/4205 | 364/8465 | 1.31e-20 | 2.20e-18 | 1.13e-18 | 266 |
| hsa0501438 | Esophagus | ESCC | Amyotrophic lateral sclerosis | 266/4205 | 364/8465 | 1.31e-20 | 2.20e-18 | 1.13e-18 | 266 |
| hsa0501422 | Liver | HCC | Amyotrophic lateral sclerosis | 252/4020 | 364/8465 | 8.85e-18 | 7.41e-16 | 4.12e-16 | 252 |
| hsa0501432 | Liver | HCC | Amyotrophic lateral sclerosis | 252/4020 | 364/8465 | 8.85e-18 | 7.41e-16 | 4.12e-16 | 252 |
| hsa0501427 | Prostate | Tumor | Amyotrophic lateral sclerosis | 155/1791 | 364/8465 | 3.41e-21 | 1.13e-19 | 6.99e-20 | 155 |
| hsa0501436 | Prostate | Tumor | Amyotrophic lateral sclerosis | 155/1791 | 364/8465 | 3.41e-21 | 1.13e-19 | 6.99e-20 | 155 |
| Page: 1 |
Top |
Cell-cell communication analysis |
| Identification of potential cell-cell interactions between two cell types and their ligand-receptor pairs for different disease states |
| Ligand | Receptor | LRpair | Pathway | Tissue | Disease Stage |
| Page: 1 |
Top |
Single-cell gene regulatory network inference analysis |
| Find out the significant the regulons (TFs) and the target genes of each regulon across cell types for different disease states |
| TF | Cell Type | Tissue | Disease Stage | Target Gene | RSS | Regulon Activity |
| ∗The dot plots of a searched regulon are shown for all cell subpopulations in each disease state of each tissue based on the regulon specific score inferred using pySCENIC and by calculating the average expression. |
| Page: 1 |
Top |
Somatic mutation of malignant transformation related genes |
| Annotation of somatic variants for genes involved in malignant transformation |
| Hugo Symbol | Variant Class | Variant Classification | dbSNP RS | HGVSc | HGVSp | HGVSp Short | SWISSPROT | BIOTYPE | SIFT | PolyPhen | Tumor Sample Barcode | Tissue | Histology | Sex | Age | Stage | Therapy Types | Drugs | Outcome |
| MATR3 | SNV | Missense_Mutation | c.1885G>A | p.Glu629Lys | p.E629K | protein_coding | tolerated(0.07) | benign(0) | TCGA-E2-A1B1-01 | Breast | breast invasive carcinoma | Female | <65 | I/II | Other, specify in notesbiphosphonate | zoledronic | SD | ||
| MATR3 | SNV | Missense_Mutation | novel | c.325N>G | p.Ser109Gly | p.S109G | protein_coding | deleterious(0.03) | benign(0.025) | TCGA-E2-A1LH-01 | Breast | breast invasive carcinoma | Female | <65 | I/II | Chemotherapy | adriamycin | SD | |
| MATR3 | insertion | Frame_Shift_Ins | novel | c.887_888insGTGGC | p.Cys296TrpfsTer118 | p.C296Wfs*118 | protein_coding | TCGA-BH-A0HA-01 | Breast | breast invasive carcinoma | Female | <65 | I/II | Unknown | Unknown | SD | |||
| MATR3 | SNV | Missense_Mutation | c.1238N>G | p.Tyr413Cys | p.Y413C | protein_coding | tolerated(0.17) | benign(0.431) | TCGA-C5-A7CJ-01 | Cervix | cervical & endocervical cancer | Female | <65 | I/II | Chemotherapy | cisplatin | SD | ||
| MATR3 | SNV | Missense_Mutation | novel | c.554N>C | p.Arg185Thr | p.R185T | protein_coding | deleterious(0.01) | probably_damaging(0.91) | TCGA-JW-A5VL-01 | Cervix | cervical & endocervical cancer | Female | <65 | I/II | Unknown | Unknown | SD | |
| MATR3 | SNV | Missense_Mutation | novel | c.994N>A | p.Asp332Asn | p.D332N | protein_coding | tolerated(0.4) | probably_damaging(0.956) | TCGA-VS-A952-01 | Cervix | cervical & endocervical cancer | Female | >=65 | I/II | Unknown | Unknown | SD | |
| MATR3 | SNV | Missense_Mutation | c.361N>A | p.Asp121Asn | p.D121N | protein_coding | deleterious(0) | probably_damaging(0.977) | TCGA-AA-3510-01 | Colorectum | colon adenocarcinoma | Male | >=65 | I/II | Unknown | Unknown | SD | ||
| MATR3 | SNV | Missense_Mutation | novel | c.814G>A | p.Ala272Thr | p.A272T | protein_coding | tolerated(0.18) | benign(0.351) | TCGA-AA-3950-01 | Colorectum | colon adenocarcinoma | Female | >=65 | I/II | Unknown | Unknown | SD | |
| MATR3 | SNV | Missense_Mutation | novel | c.2248N>G | p.Asn750Asp | p.N750D | protein_coding | tolerated(0.78) | benign(0) | TCGA-AA-3968-01 | Colorectum | colon adenocarcinoma | Female | <65 | I/II | Unknown | Unknown | SD | |
| MATR3 | SNV | Missense_Mutation | c.786G>T | p.Glu262Asp | p.E262D | protein_coding | tolerated(0.41) | possibly_damaging(0.899) | TCGA-AA-3977-01 | Colorectum | colon adenocarcinoma | Male | >=65 | I/II | Unknown | Unknown | SD |
| Page: 1 2 3 4 5 6 7 |
Top |
Related drugs of malignant transformation related genes |
| Identification of chemicals and drugs interact with genes involved in malignant transfromation |
| (DGIdb 4.0) |
| Entrez ID | Symbol | Category | Interaction Types | Drug Claim Name | Drug Name | PMIDs |
| Page: 1 |

Copyright 2023-Present -The University of Texas Health Science Center at Houston |