
|
|||||
|
 | |
| |
| |
| |
| |
| |
|
Gene: MAT2B |
Gene summary for MAT2B |
| Gene information | Species | Human | Gene symbol | MAT2B | Gene ID | 27430 |
| Gene name | methionine adenosyltransferase 2B | |
| Gene Alias | MAT-II | |
| Cytomap | 5q34 | |
| Gene Type | protein-coding | GO ID | GO:0006556 | UniProtAcc | A0A140VJP2 |
Top |
Malignant transformation analysis |
| Identification of the aberrant gene expression in precancerous and cancerous lesions by comparing the gene expression of stem-like cells in diseased tissues with normal stem cells |
| Entrez ID | Symbol | Replicates | Species | Organ | Tissue | Adj P-value | Log2FC | Malignancy |
| 27430 | MAT2B | HTA11_78_2000001011 | Human | Colorectum | AD | 8.03e-09 | 4.37e-01 | -0.1088 |
| 27430 | MAT2B | HTA11_347_2000001011 | Human | Colorectum | AD | 1.13e-10 | 3.81e-01 | -0.1954 |
| 27430 | MAT2B | HTA11_866_3004761011 | Human | Colorectum | AD | 1.23e-02 | 2.55e-01 | 0.096 |
| 27430 | MAT2B | HTA11_6801_2000001011 | Human | Colorectum | SER | 2.67e-06 | 6.46e-01 | 0.0171 |
| 27430 | MAT2B | HTA11_99999970781_79442 | Human | Colorectum | MSS | 2.13e-11 | 3.84e-01 | 0.294 |
| 27430 | MAT2B | HTA11_99999971662_82457 | Human | Colorectum | MSS | 9.22e-06 | 2.68e-01 | 0.3859 |
| 27430 | MAT2B | LZE4T | Human | Esophagus | ESCC | 2.36e-17 | 3.07e-01 | 0.0811 |
| 27430 | MAT2B | LZE5T | Human | Esophagus | ESCC | 2.92e-04 | 2.27e-01 | 0.0514 |
| 27430 | MAT2B | LZE7T | Human | Esophagus | ESCC | 1.04e-03 | 4.07e-01 | 0.0667 |
| 27430 | MAT2B | LZE8T | Human | Esophagus | ESCC | 1.26e-07 | 5.93e-01 | 0.067 |
| 27430 | MAT2B | LZE20T | Human | Esophagus | ESCC | 3.70e-07 | 2.43e-01 | 0.0662 |
| 27430 | MAT2B | LZE24T | Human | Esophagus | ESCC | 4.63e-28 | 1.04e+00 | 0.0596 |
| 27430 | MAT2B | LZE22D3 | Human | Esophagus | HGIN | 3.02e-02 | 4.77e-01 | 0.0653 |
| 27430 | MAT2B | LZE21T | Human | Esophagus | ESCC | 2.22e-02 | 3.08e-01 | 0.0655 |
| 27430 | MAT2B | LZE6T | Human | Esophagus | ESCC | 3.97e-10 | 7.43e-01 | 0.0845 |
| 27430 | MAT2B | P1T-E | Human | Esophagus | ESCC | 1.94e-05 | 3.01e-01 | 0.0875 |
| 27430 | MAT2B | P2T-E | Human | Esophagus | ESCC | 1.13e-39 | 7.53e-01 | 0.1177 |
| 27430 | MAT2B | P4T-E | Human | Esophagus | ESCC | 6.10e-22 | 7.23e-01 | 0.1323 |
| 27430 | MAT2B | P5T-E | Human | Esophagus | ESCC | 2.84e-25 | 5.47e-01 | 0.1327 |
| 27430 | MAT2B | P8T-E | Human | Esophagus | ESCC | 2.59e-24 | 5.12e-01 | 0.0889 |
| Page: 1 2 3 4 5 6 |
| Tissue | Expression Dynamics | Abbreviation |
| Colorectum (GSE201348) |  | FAP: Familial adenomatous polyposis |
| CRC: Colorectal cancer | ||
| Colorectum (HTA11) | 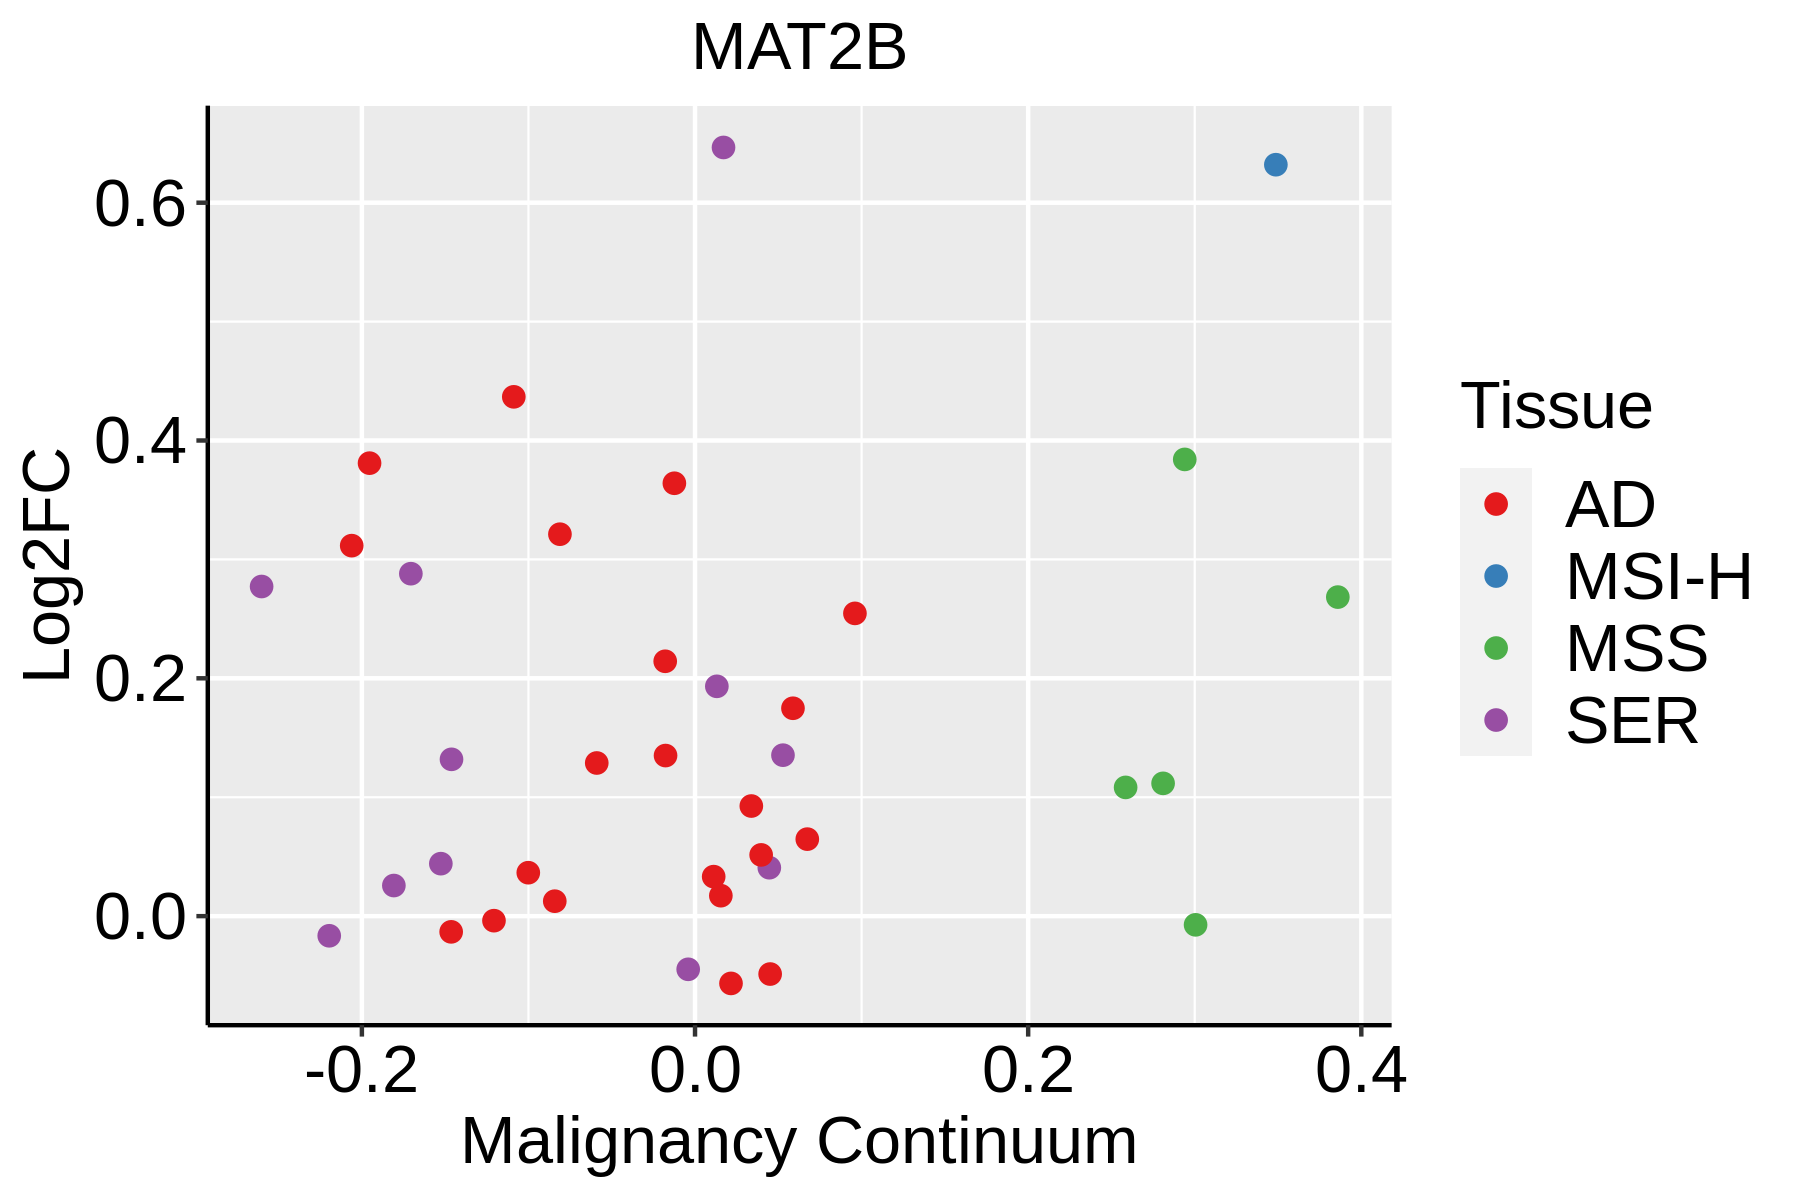 | AD: Adenomas |
| SER: Sessile serrated lesions | ||
| MSI-H: Microsatellite-high colorectal cancer | ||
| MSS: Microsatellite stable colorectal cancer | ||
| Esophagus | 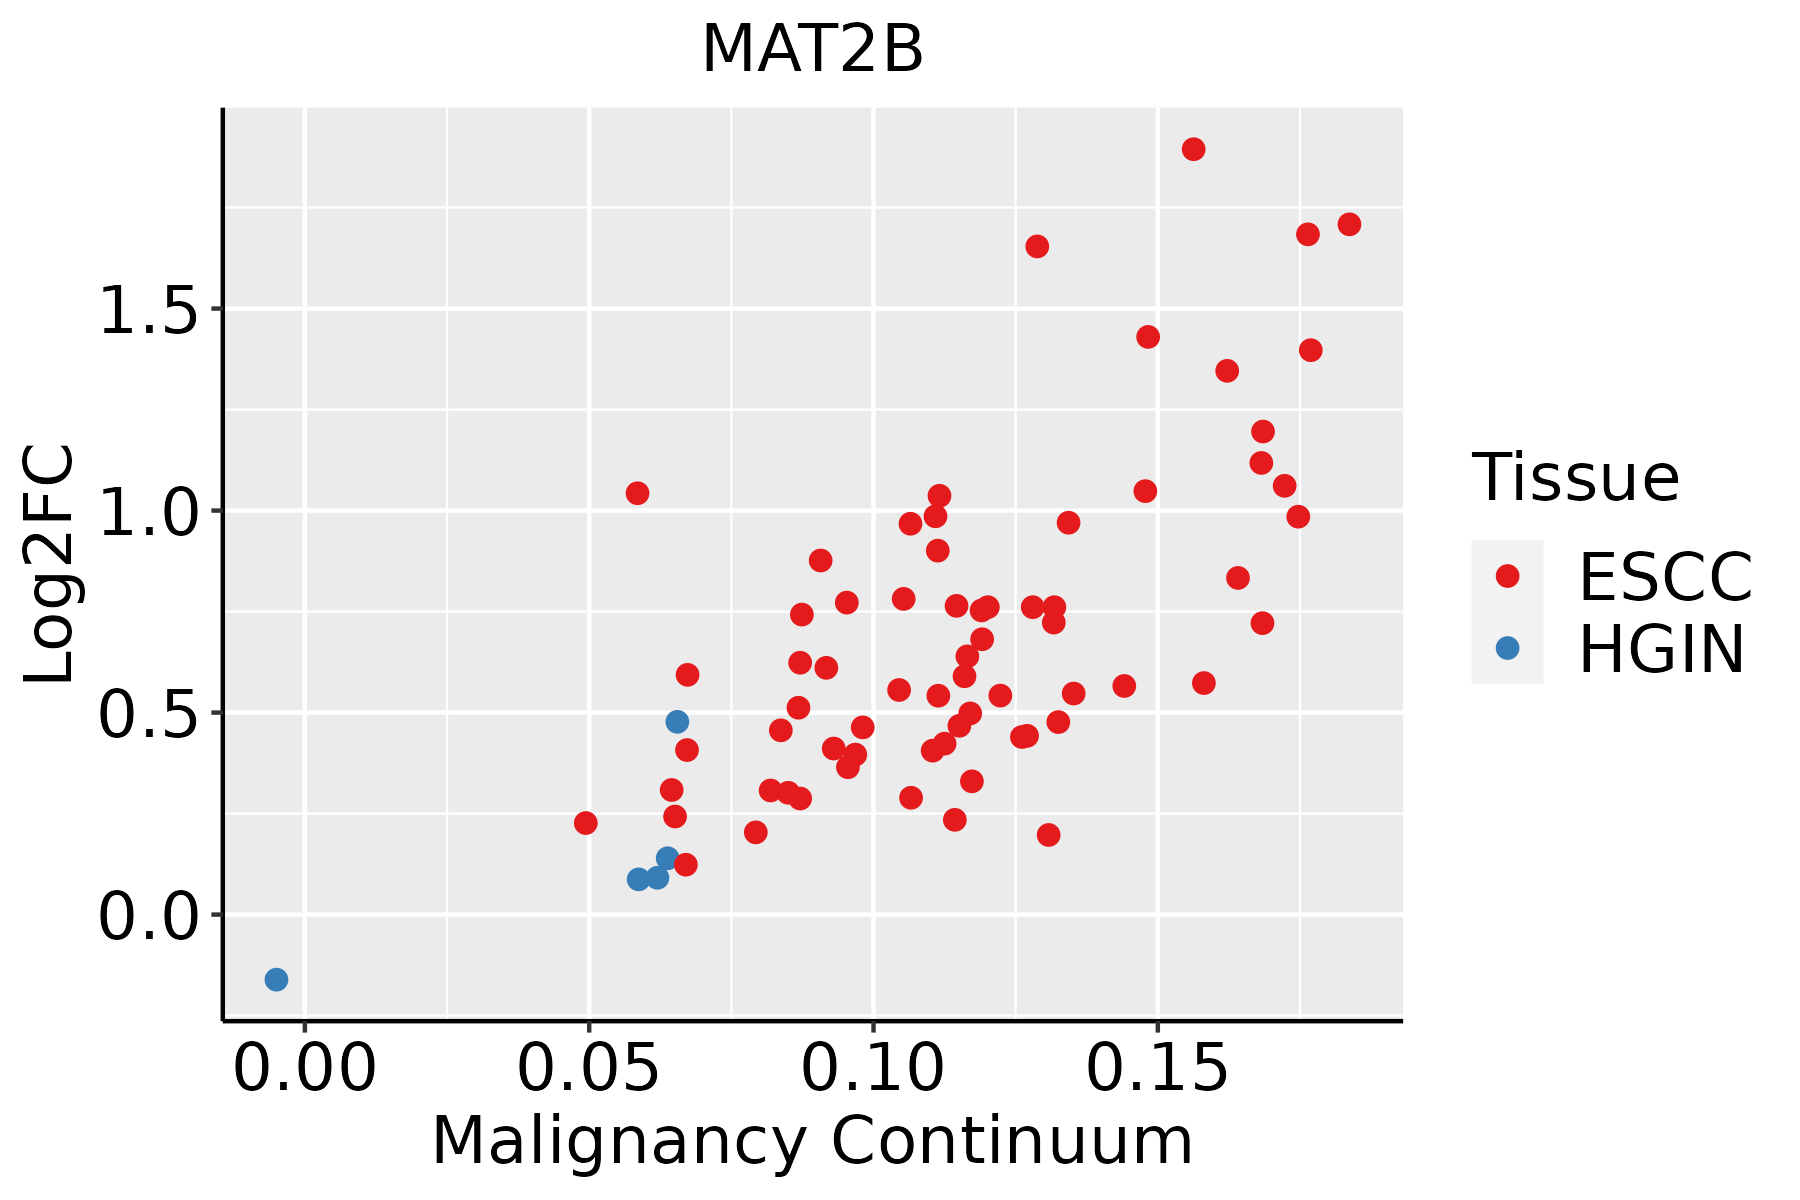 | ESCC: Esophageal squamous cell carcinoma |
| HGIN: High-grade intraepithelial neoplasias | ||
| LGIN: Low-grade intraepithelial neoplasias | ||
| Liver |  | HCC: Hepatocellular carcinoma |
| NAFLD: Non-alcoholic fatty liver disease | ||
| Oral Cavity | 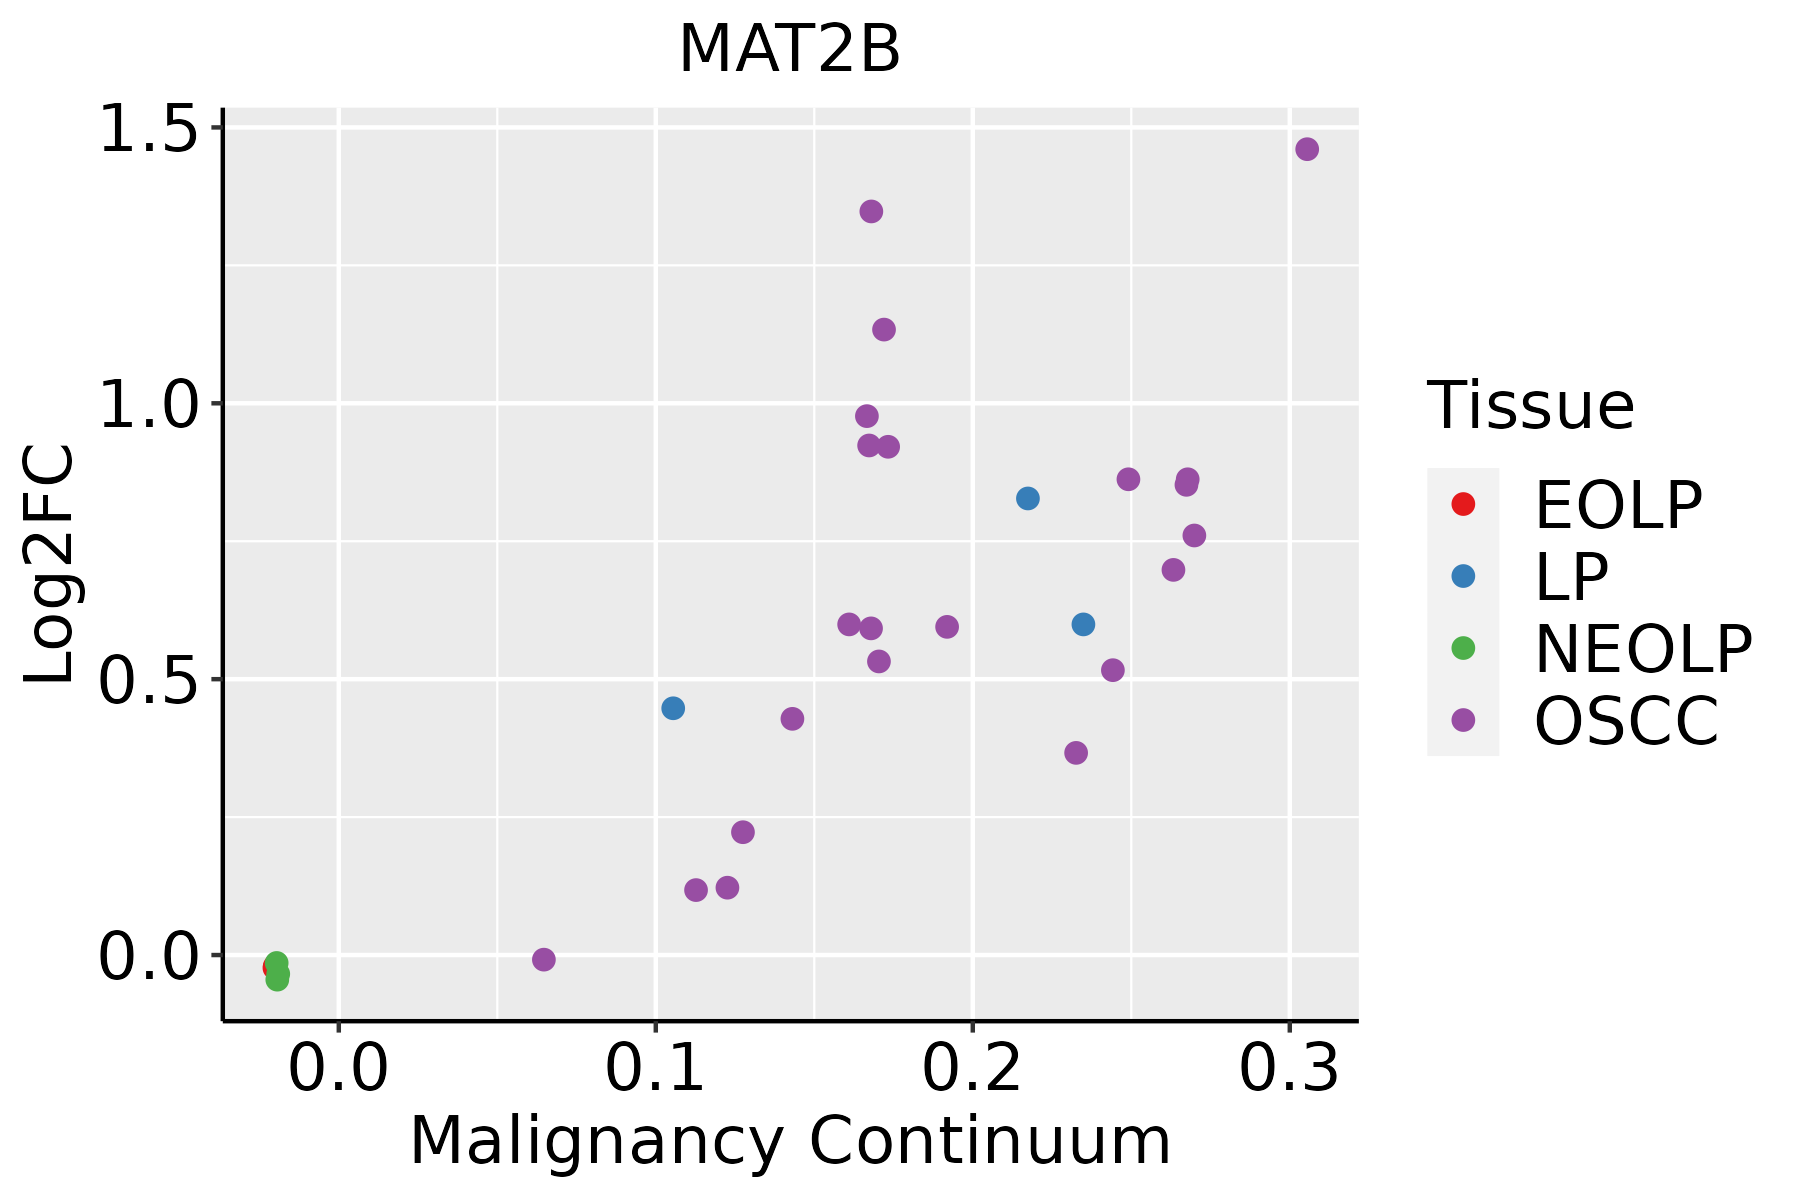 | EOLP: Erosive Oral lichen planus |
| LP: leukoplakia | ||
| NEOLP: Non-erosive oral lichen planus | ||
| OSCC: Oral squamous cell carcinoma | ||
| Skin | 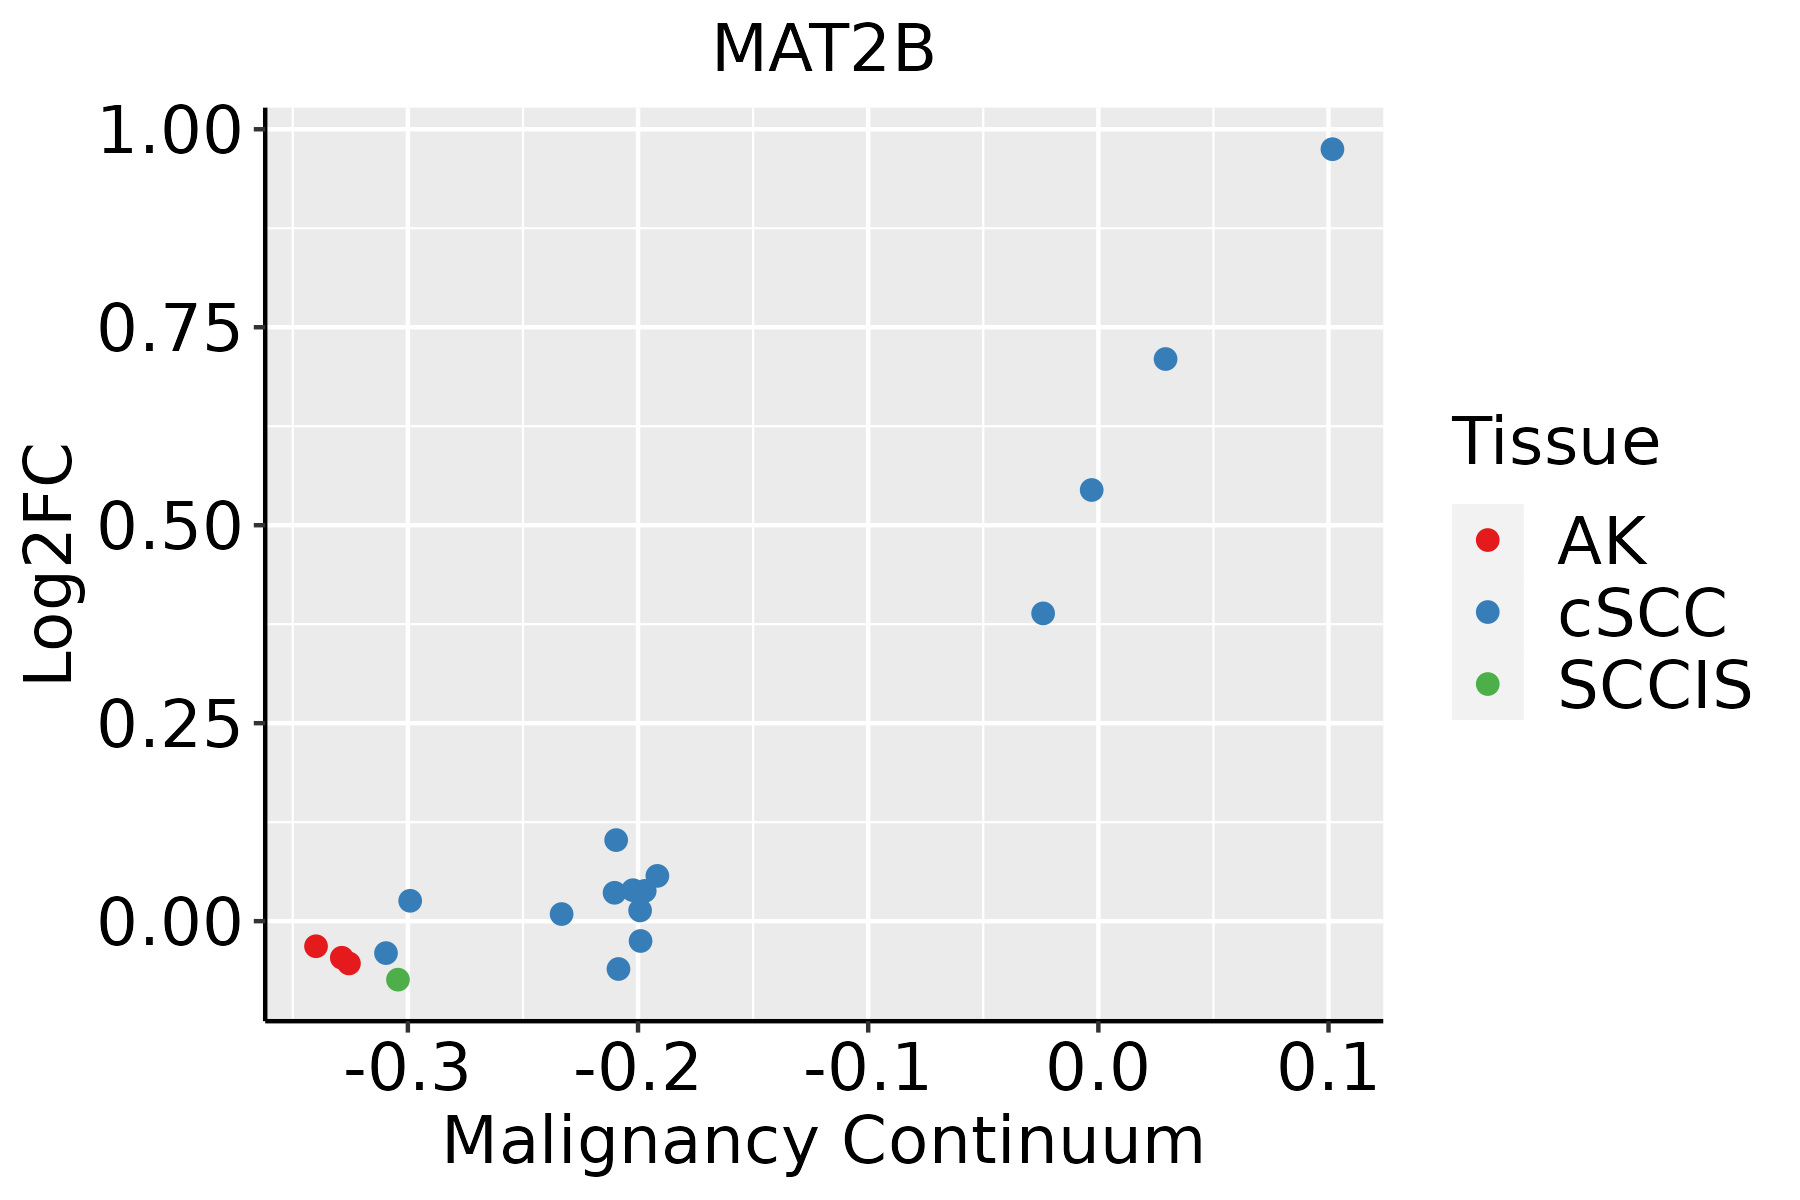 | AK: Actinic keratosis |
| cSCC: Cutaneous squamous cell carcinoma | ||
| SCCIS:squamous cell carcinoma in situ |
| ∗log2FC in expression of this searched gene in stem-like cells from each diseased tissue sample relative to stem-like cells in normal samples in each tissue plotted against the malignancy continuum. Samples are colored based on if they are from different disease stage. |
Top |
Malignant transformation related pathway analysis |
| Find out the enriched GO biological processes and KEGG pathways involved in transition from healthy to precancer to cancer |
| Tissue | Disease Stage | Enriched GO biological Processes |
| Colorectum | AD |  |
| Colorectum | SER |  |
| Colorectum | MSS |  |
| Colorectum | MSI-H |  |
| Colorectum | FAP |  |
| ∗Top 15 enriched GO BP terms are showed in the bar plot of each disease state in each tissue. Each row represents a significant GO biological process which is colored according to the -log10(p.adjust). |
| Page: 1 2 3 4 5 6 7 8 9 |
| GO ID | Tissue | Disease Stage | Description | Gene Ratio | Bg Ratio | pvalue | p.adjust | Count |
| GO:0006790 | Colorectum | AD | sulfur compound metabolic process | 101/3918 | 339/18723 | 6.46e-05 | 1.07e-03 | 101 |
| GO:0006730 | Colorectum | AD | one-carbon metabolic process | 18/3918 | 40/18723 | 5.36e-04 | 5.74e-03 | 18 |
| GO:00067301 | Colorectum | SER | one-carbon metabolic process | 15/2897 | 40/18723 | 5.71e-04 | 7.86e-03 | 15 |
| GO:00067901 | Colorectum | SER | sulfur compound metabolic process | 73/2897 | 339/18723 | 1.75e-03 | 1.81e-02 | 73 |
| GO:00067902 | Colorectum | MSS | sulfur compound metabolic process | 85/3467 | 339/18723 | 1.52e-03 | 1.39e-02 | 85 |
| GO:00067302 | Colorectum | MSS | one-carbon metabolic process | 15/3467 | 40/18723 | 3.72e-03 | 2.73e-02 | 15 |
| GO:00067906 | Esophagus | ESCC | sulfur compound metabolic process | 201/8552 | 339/18723 | 2.64e-07 | 3.94e-06 | 201 |
| GO:00442725 | Esophagus | ESCC | sulfur compound biosynthetic process | 96/8552 | 148/18723 | 1.86e-06 | 2.16e-05 | 96 |
| GO:000679011 | Liver | Cirrhotic | sulfur compound metabolic process | 129/4634 | 339/18723 | 3.06e-08 | 1.04e-06 | 129 |
| GO:00442721 | Liver | Cirrhotic | sulfur compound biosynthetic process | 58/4634 | 148/18723 | 6.93e-05 | 7.83e-04 | 58 |
| GO:00067303 | Liver | Cirrhotic | one-carbon metabolic process | 17/4634 | 40/18723 | 1.04e-02 | 4.61e-02 | 17 |
| GO:000679021 | Liver | HCC | sulfur compound metabolic process | 212/7958 | 339/18723 | 5.60e-14 | 3.39e-12 | 212 |
| GO:00442722 | Liver | HCC | sulfur compound biosynthetic process | 95/7958 | 148/18723 | 7.89e-08 | 1.58e-06 | 95 |
| GO:0046500 | Liver | HCC | S-adenosylmethionine metabolic process | 13/7958 | 15/18723 | 5.67e-04 | 3.61e-03 | 13 |
| GO:00442724 | Oral cavity | OSCC | sulfur compound biosynthetic process | 82/7305 | 148/18723 | 3.71e-05 | 3.31e-04 | 82 |
| GO:00067905 | Oral cavity | OSCC | sulfur compound metabolic process | 168/7305 | 339/18723 | 4.50e-05 | 3.84e-04 | 168 |
| GO:000679012 | Oral cavity | LP | sulfur compound metabolic process | 106/4623 | 339/18723 | 3.36e-03 | 2.25e-02 | 106 |
| GO:00067304 | Skin | cSCC | one-carbon metabolic process | 18/4864 | 40/18723 | 7.10e-03 | 3.40e-02 | 18 |
| Page: 1 |
| Pathway ID | Tissue | Disease Stage | Description | Gene Ratio | Bg Ratio | pvalue | p.adjust | qvalue | Count |
| hsa01230 | Colorectum | AD | Biosynthesis of amino acids | 28/2092 | 75/8465 | 9.99e-03 | 3.89e-02 | 2.48e-02 | 28 |
| hsa012301 | Colorectum | AD | Biosynthesis of amino acids | 28/2092 | 75/8465 | 9.99e-03 | 3.89e-02 | 2.48e-02 | 28 |
| hsa012405 | Esophagus | ESCC | Biosynthesis of cofactors | 97/4205 | 153/8465 | 3.88e-04 | 1.35e-03 | 6.94e-04 | 97 |
| hsa0123023 | Esophagus | ESCC | Biosynthesis of amino acids | 49/4205 | 75/8465 | 4.35e-03 | 1.12e-02 | 5.74e-03 | 49 |
| hsa0124012 | Esophagus | ESCC | Biosynthesis of cofactors | 97/4205 | 153/8465 | 3.88e-04 | 1.35e-03 | 6.94e-04 | 97 |
| hsa0123033 | Esophagus | ESCC | Biosynthesis of amino acids | 49/4205 | 75/8465 | 4.35e-03 | 1.12e-02 | 5.74e-03 | 49 |
| hsa01240 | Liver | Cirrhotic | Biosynthesis of cofactors | 66/2530 | 153/8465 | 3.11e-04 | 1.99e-03 | 1.23e-03 | 66 |
| hsa00270 | Liver | Cirrhotic | Cysteine and methionine metabolism | 27/2530 | 52/8465 | 6.98e-04 | 4.15e-03 | 2.56e-03 | 27 |
| hsa012304 | Liver | Cirrhotic | Biosynthesis of amino acids | 35/2530 | 75/8465 | 1.54e-03 | 7.83e-03 | 4.83e-03 | 35 |
| hsa012401 | Liver | Cirrhotic | Biosynthesis of cofactors | 66/2530 | 153/8465 | 3.11e-04 | 1.99e-03 | 1.23e-03 | 66 |
| hsa002701 | Liver | Cirrhotic | Cysteine and methionine metabolism | 27/2530 | 52/8465 | 6.98e-04 | 4.15e-03 | 2.56e-03 | 27 |
| hsa0123011 | Liver | Cirrhotic | Biosynthesis of amino acids | 35/2530 | 75/8465 | 1.54e-03 | 7.83e-03 | 4.83e-03 | 35 |
| hsa012402 | Liver | HCC | Biosynthesis of cofactors | 103/4020 | 153/8465 | 4.67e-07 | 5.05e-06 | 2.81e-06 | 103 |
| hsa0123021 | Liver | HCC | Biosynthesis of amino acids | 53/4020 | 75/8465 | 3.79e-05 | 2.11e-04 | 1.18e-04 | 53 |
| hsa002702 | Liver | HCC | Cysteine and methionine metabolism | 35/4020 | 52/8465 | 3.03e-03 | 9.94e-03 | 5.53e-03 | 35 |
| hsa012403 | Liver | HCC | Biosynthesis of cofactors | 103/4020 | 153/8465 | 4.67e-07 | 5.05e-06 | 2.81e-06 | 103 |
| hsa0123031 | Liver | HCC | Biosynthesis of amino acids | 53/4020 | 75/8465 | 3.79e-05 | 2.11e-04 | 1.18e-04 | 53 |
| hsa002703 | Liver | HCC | Cysteine and methionine metabolism | 35/4020 | 52/8465 | 3.03e-03 | 9.94e-03 | 5.53e-03 | 35 |
| hsa012404 | Oral cavity | OSCC | Biosynthesis of cofactors | 88/3704 | 153/8465 | 3.84e-04 | 1.20e-03 | 6.12e-04 | 88 |
| hsa012305 | Oral cavity | OSCC | Biosynthesis of amino acids | 45/3704 | 75/8465 | 3.27e-03 | 8.23e-03 | 4.19e-03 | 45 |
| Page: 1 2 |
Top |
Cell-cell communication analysis |
| Identification of potential cell-cell interactions between two cell types and their ligand-receptor pairs for different disease states |
| Ligand | Receptor | LRpair | Pathway | Tissue | Disease Stage |
| Page: 1 |
Top |
Single-cell gene regulatory network inference analysis |
| Find out the significant the regulons (TFs) and the target genes of each regulon across cell types for different disease states |
| TF | Cell Type | Tissue | Disease Stage | Target Gene | RSS | Regulon Activity |
| ∗The dot plots of a searched regulon are shown for all cell subpopulations in each disease state of each tissue based on the regulon specific score inferred using pySCENIC and by calculating the average expression. |
| Page: 1 |
Top |
Somatic mutation of malignant transformation related genes |
| Annotation of somatic variants for genes involved in malignant transformation |
| Hugo Symbol | Variant Class | Variant Classification | dbSNP RS | HGVSc | HGVSp | HGVSp Short | SWISSPROT | BIOTYPE | SIFT | PolyPhen | Tumor Sample Barcode | Tissue | Histology | Sex | Age | Stage | Therapy Types | Drugs | Outcome |
| MAT2B | SNV | Missense_Mutation | rs768283411 | c.935N>A | p.Arg312Gln | p.R312Q | Q9NZL9 | protein_coding | tolerated(0.21) | benign(0.031) | TCGA-AN-A046-01 | Breast | breast invasive carcinoma | Female | >=65 | I/II | Unknown | Unknown | SD |
| MAT2B | SNV | Missense_Mutation | c.535N>T | p.Val179Phe | p.V179F | Q9NZL9 | protein_coding | deleterious(0) | probably_damaging(0.972) | TCGA-AN-A0XR-01 | Breast | breast invasive carcinoma | Female | <65 | III/IV | Unknown | Unknown | SD | |
| MAT2B | insertion | In_Frame_Ins | novel | c.614_615insAGTAGTCCTCCT | p.Gln205_Phe206insValValLeuLeu | p.Q205_F206insVVLL | Q9NZL9 | protein_coding | TCGA-AN-A0FX-01 | Breast | breast invasive carcinoma | Female | <65 | I/II | Unknown | Unknown | SD | ||
| MAT2B | SNV | Missense_Mutation | rs147499303 | c.866N>A | p.Arg289His | p.R289H | Q9NZL9 | protein_coding | deleterious(0) | probably_damaging(1) | TCGA-5M-AAT5-01 | Colorectum | colon adenocarcinoma | Unknown | Unknown | I/II | Unknown | Unknown | Unknown |
| MAT2B | SNV | Missense_Mutation | novel | c.767T>C | p.Met256Thr | p.M256T | Q9NZL9 | protein_coding | deleterious(0) | possibly_damaging(0.86) | TCGA-5M-AAT6-01 | Colorectum | colon adenocarcinoma | Female | <65 | III/IV | Unknown | Unknown | PD |
| MAT2B | SNV | Missense_Mutation | rs768283411 | c.935G>A | p.Arg312Gln | p.R312Q | Q9NZL9 | protein_coding | tolerated(0.21) | benign(0.031) | TCGA-A6-6141-01 | Colorectum | colon adenocarcinoma | Male | <65 | I/II | Chemotherapy | 5-fu | SD |
| MAT2B | SNV | Missense_Mutation | c.587C>T | p.Ala196Val | p.A196V | Q9NZL9 | protein_coding | tolerated(0.06) | possibly_damaging(0.879) | TCGA-AA-3492-01 | Colorectum | colon adenocarcinoma | Female | >=65 | I/II | Unknown | Unknown | SD | |
| MAT2B | SNV | Missense_Mutation | rs768283411 | c.935N>A | p.Arg312Gln | p.R312Q | Q9NZL9 | protein_coding | tolerated(0.21) | benign(0.031) | TCGA-AA-3984-01 | Colorectum | colon adenocarcinoma | Female | <65 | I/II | Unknown | Unknown | SD |
| MAT2B | SNV | Missense_Mutation | c.803N>T | p.Ala268Val | p.A268V | Q9NZL9 | protein_coding | tolerated(0.5) | benign(0.071) | TCGA-AY-6197-01 | Colorectum | colon adenocarcinoma | Male | <65 | I/II | Unknown | Unknown | SD | |
| MAT2B | SNV | Missense_Mutation | rs768283411 | c.935N>A | p.Arg312Gln | p.R312Q | Q9NZL9 | protein_coding | tolerated(0.21) | benign(0.031) | TCGA-AZ-4315-01 | Colorectum | colon adenocarcinoma | Male | <65 | I/II | Unknown | Unknown | SD |
| Page: 1 2 3 4 5 |
Top |
Related drugs of malignant transformation related genes |
| Identification of chemicals and drugs interact with genes involved in malignant transfromation |
| (DGIdb 4.0) |
| Entrez ID | Symbol | Category | Interaction Types | Drug Claim Name | Drug Name | PMIDs |
| Page: 1 |

Copyright 2023-Present -The University of Texas Health Science Center at Houston |