
|
|||||
|
 | |
| |
| |
| |
| |
| |
|
Gene: MAT2A |
Gene summary for MAT2A |
| Gene information | Species | Human | Gene symbol | MAT2A | Gene ID | 4144 |
| Gene name | methionine adenosyltransferase 2A | |
| Gene Alias | MATA2 | |
| Cytomap | 2p11.2 | |
| Gene Type | protein-coding | GO ID | GO:0006556 | UniProtAcc | A0A140VJP5 |
Top |
Malignant transformation analysis |
| Identification of the aberrant gene expression in precancerous and cancerous lesions by comparing the gene expression of stem-like cells in diseased tissues with normal stem cells |
| Entrez ID | Symbol | Replicates | Species | Organ | Tissue | Adj P-value | Log2FC | Malignancy |
| 4144 | MAT2A | LZE4T | Human | Esophagus | ESCC | 6.97e-07 | 9.88e-02 | 0.0811 |
| 4144 | MAT2A | LZE8T | Human | Esophagus | ESCC | 2.41e-08 | -1.29e-02 | 0.067 |
| 4144 | MAT2A | LZE20T | Human | Esophagus | ESCC | 3.71e-02 | -3.41e-01 | 0.0662 |
| 4144 | MAT2A | LZE22D1 | Human | Esophagus | HGIN | 2.39e-03 | -3.93e-01 | 0.0595 |
| 4144 | MAT2A | LZE24T | Human | Esophagus | ESCC | 2.20e-02 | 3.86e-01 | 0.0596 |
| 4144 | MAT2A | P1T-E | Human | Esophagus | ESCC | 1.73e-02 | 6.44e-01 | 0.0875 |
| 4144 | MAT2A | P2T-E | Human | Esophagus | ESCC | 1.50e-20 | 7.32e-01 | 0.1177 |
| 4144 | MAT2A | P4T-E | Human | Esophagus | ESCC | 7.60e-08 | 2.07e-01 | 0.1323 |
| 4144 | MAT2A | P5T-E | Human | Esophagus | ESCC | 7.77e-11 | 2.37e-01 | 0.1327 |
| 4144 | MAT2A | P8T-E | Human | Esophagus | ESCC | 2.49e-20 | 1.58e-01 | 0.0889 |
| 4144 | MAT2A | P9T-E | Human | Esophagus | ESCC | 4.87e-15 | -1.42e-01 | 0.1131 |
| 4144 | MAT2A | P10T-E | Human | Esophagus | ESCC | 7.90e-09 | 2.69e-01 | 0.116 |
| 4144 | MAT2A | P11T-E | Human | Esophagus | ESCC | 2.09e-10 | 9.60e-01 | 0.1426 |
| 4144 | MAT2A | P12T-E | Human | Esophagus | ESCC | 5.72e-20 | 6.93e-01 | 0.1122 |
| 4144 | MAT2A | P15T-E | Human | Esophagus | ESCC | 2.38e-12 | 5.63e-01 | 0.1149 |
| 4144 | MAT2A | P16T-E | Human | Esophagus | ESCC | 1.31e-11 | 4.31e-01 | 0.1153 |
| 4144 | MAT2A | P20T-E | Human | Esophagus | ESCC | 3.49e-12 | 7.42e-01 | 0.1124 |
| 4144 | MAT2A | P21T-E | Human | Esophagus | ESCC | 6.96e-13 | 1.95e-01 | 0.1617 |
| 4144 | MAT2A | P22T-E | Human | Esophagus | ESCC | 5.04e-14 | 2.70e-01 | 0.1236 |
| 4144 | MAT2A | P23T-E | Human | Esophagus | ESCC | 1.62e-16 | 8.09e-01 | 0.108 |
| Page: 1 2 3 4 5 6 7 |
| Tissue | Expression Dynamics | Abbreviation |
| Esophagus | 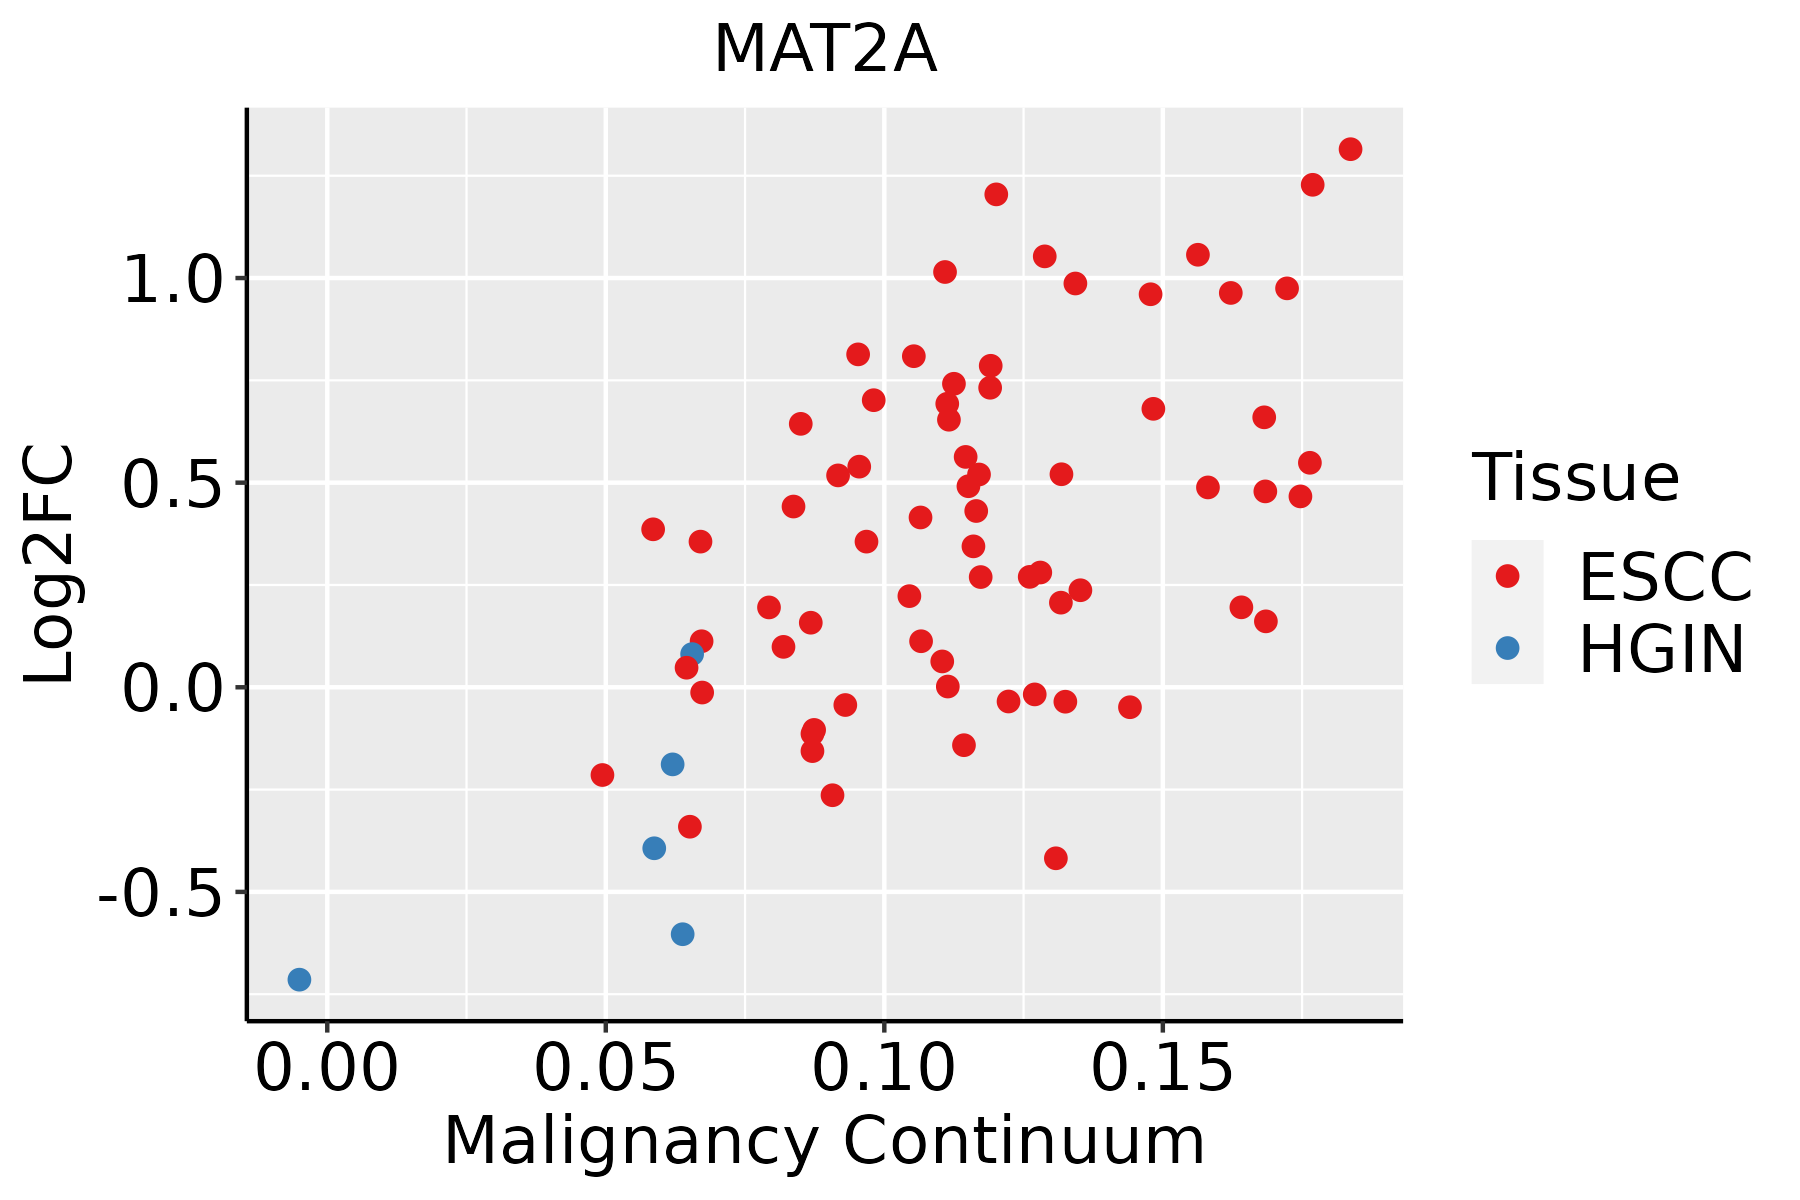 | ESCC: Esophageal squamous cell carcinoma |
| HGIN: High-grade intraepithelial neoplasias | ||
| LGIN: Low-grade intraepithelial neoplasias | ||
| Liver | 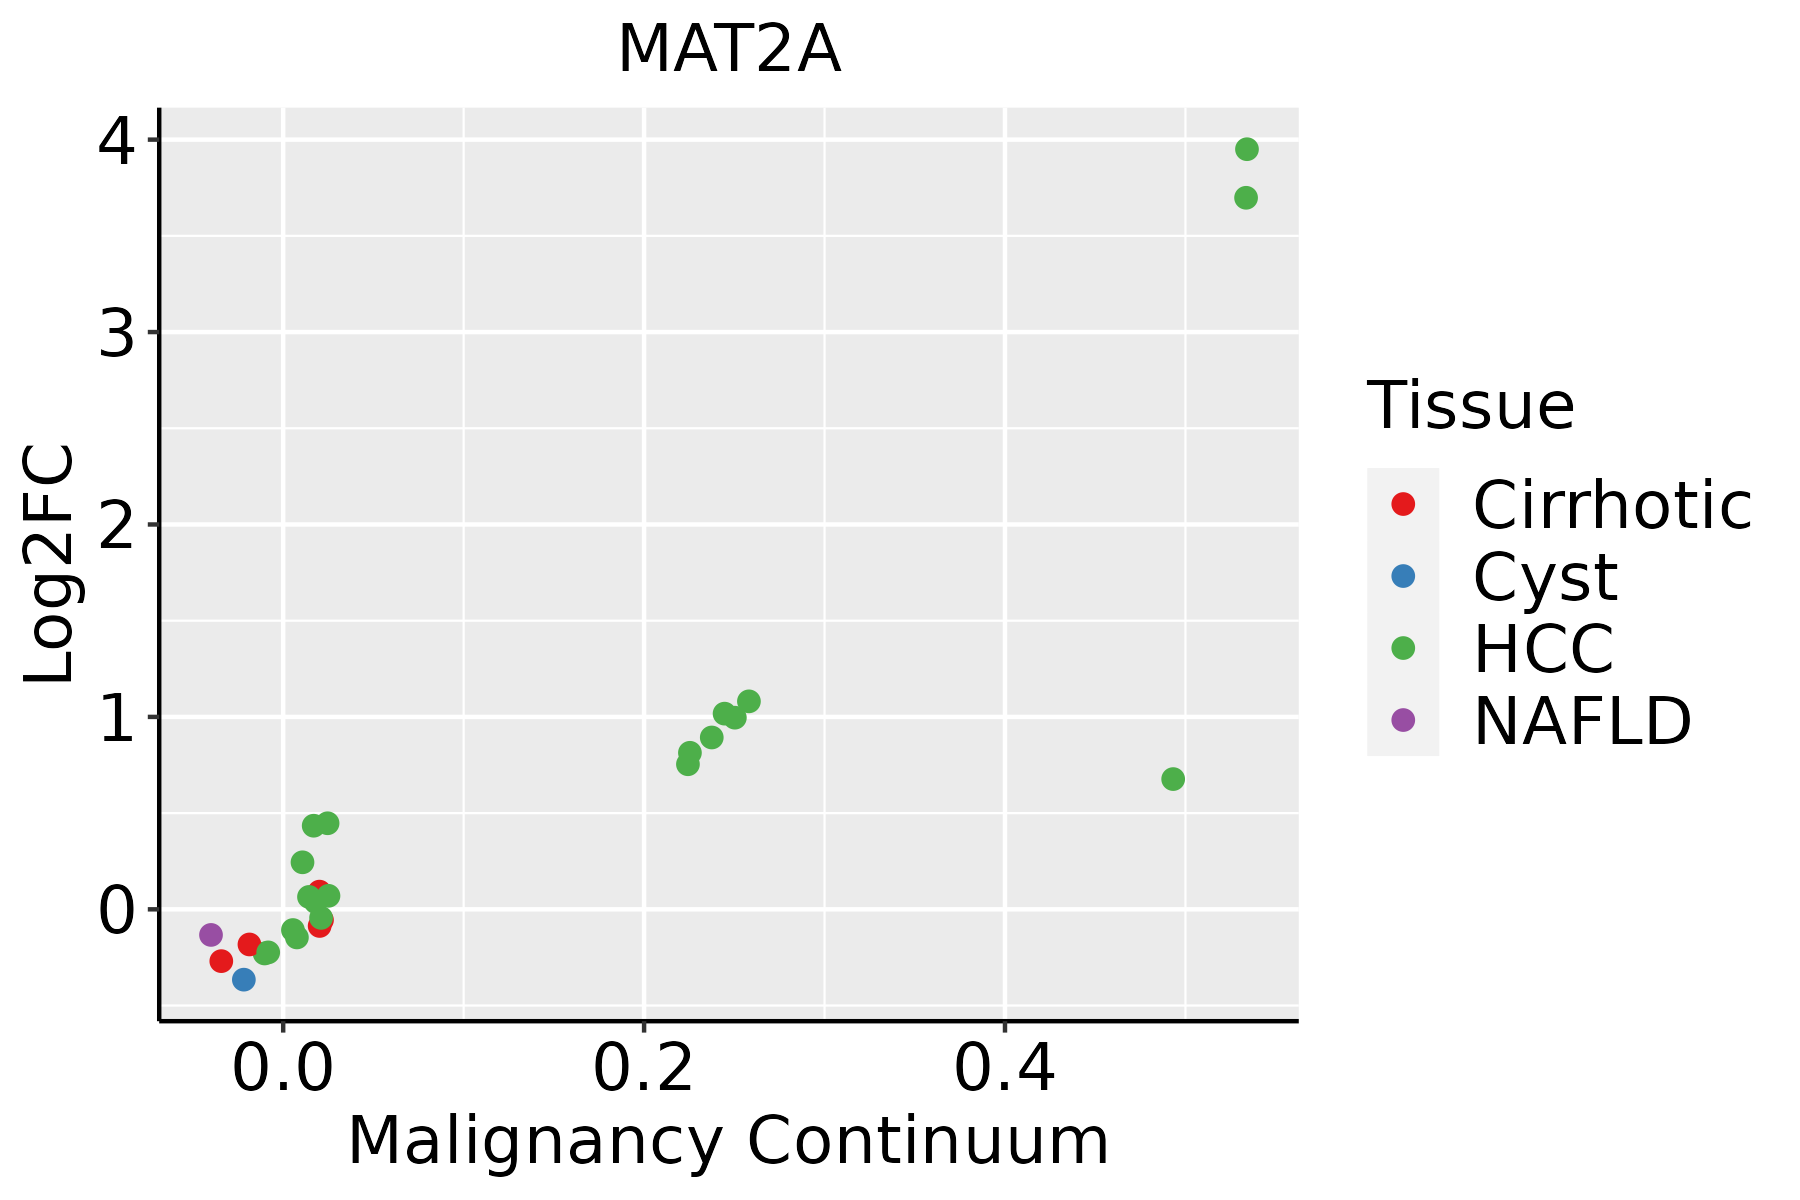 | HCC: Hepatocellular carcinoma |
| NAFLD: Non-alcoholic fatty liver disease | ||
| Oral Cavity | 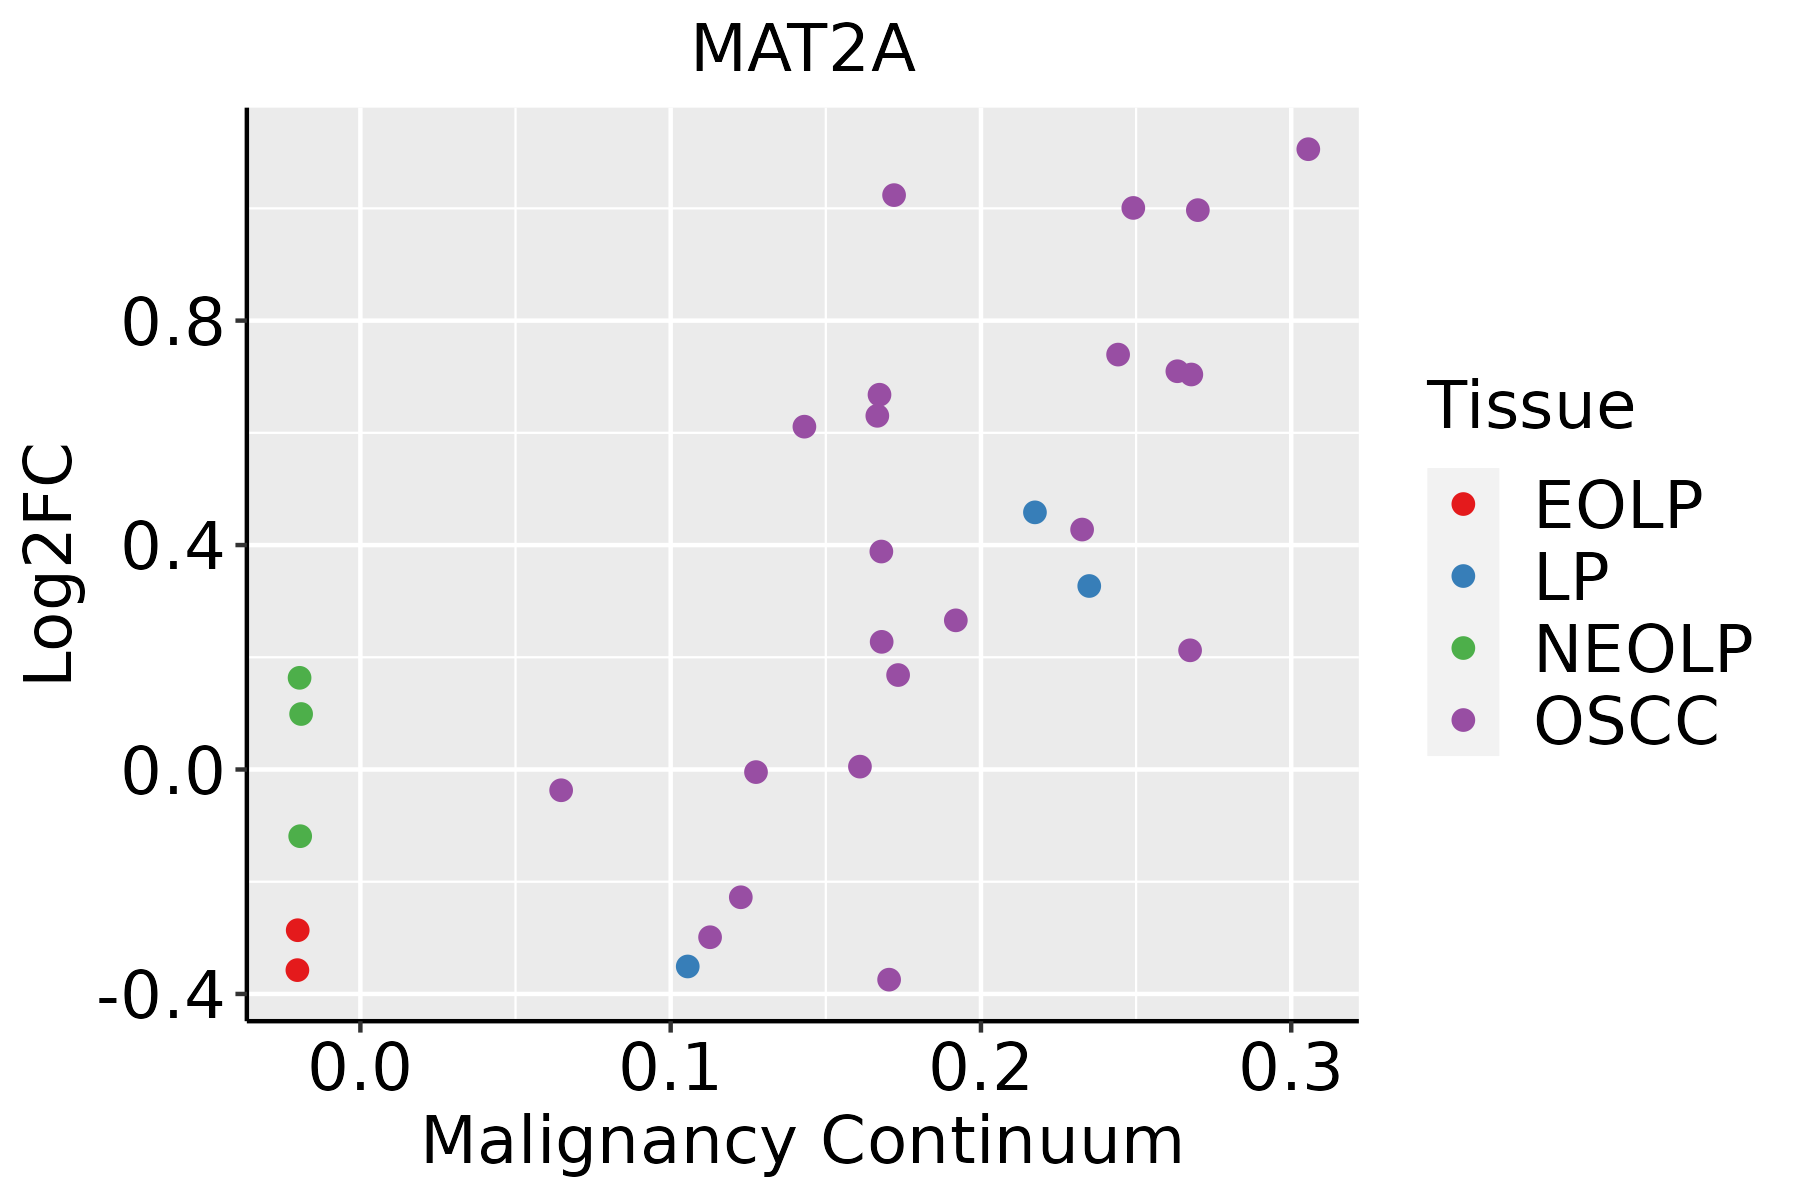 | EOLP: Erosive Oral lichen planus |
| LP: leukoplakia | ||
| NEOLP: Non-erosive oral lichen planus | ||
| OSCC: Oral squamous cell carcinoma | ||
| Prostate |  | BPH: Benign Prostatic Hyperplasia |
| Skin | 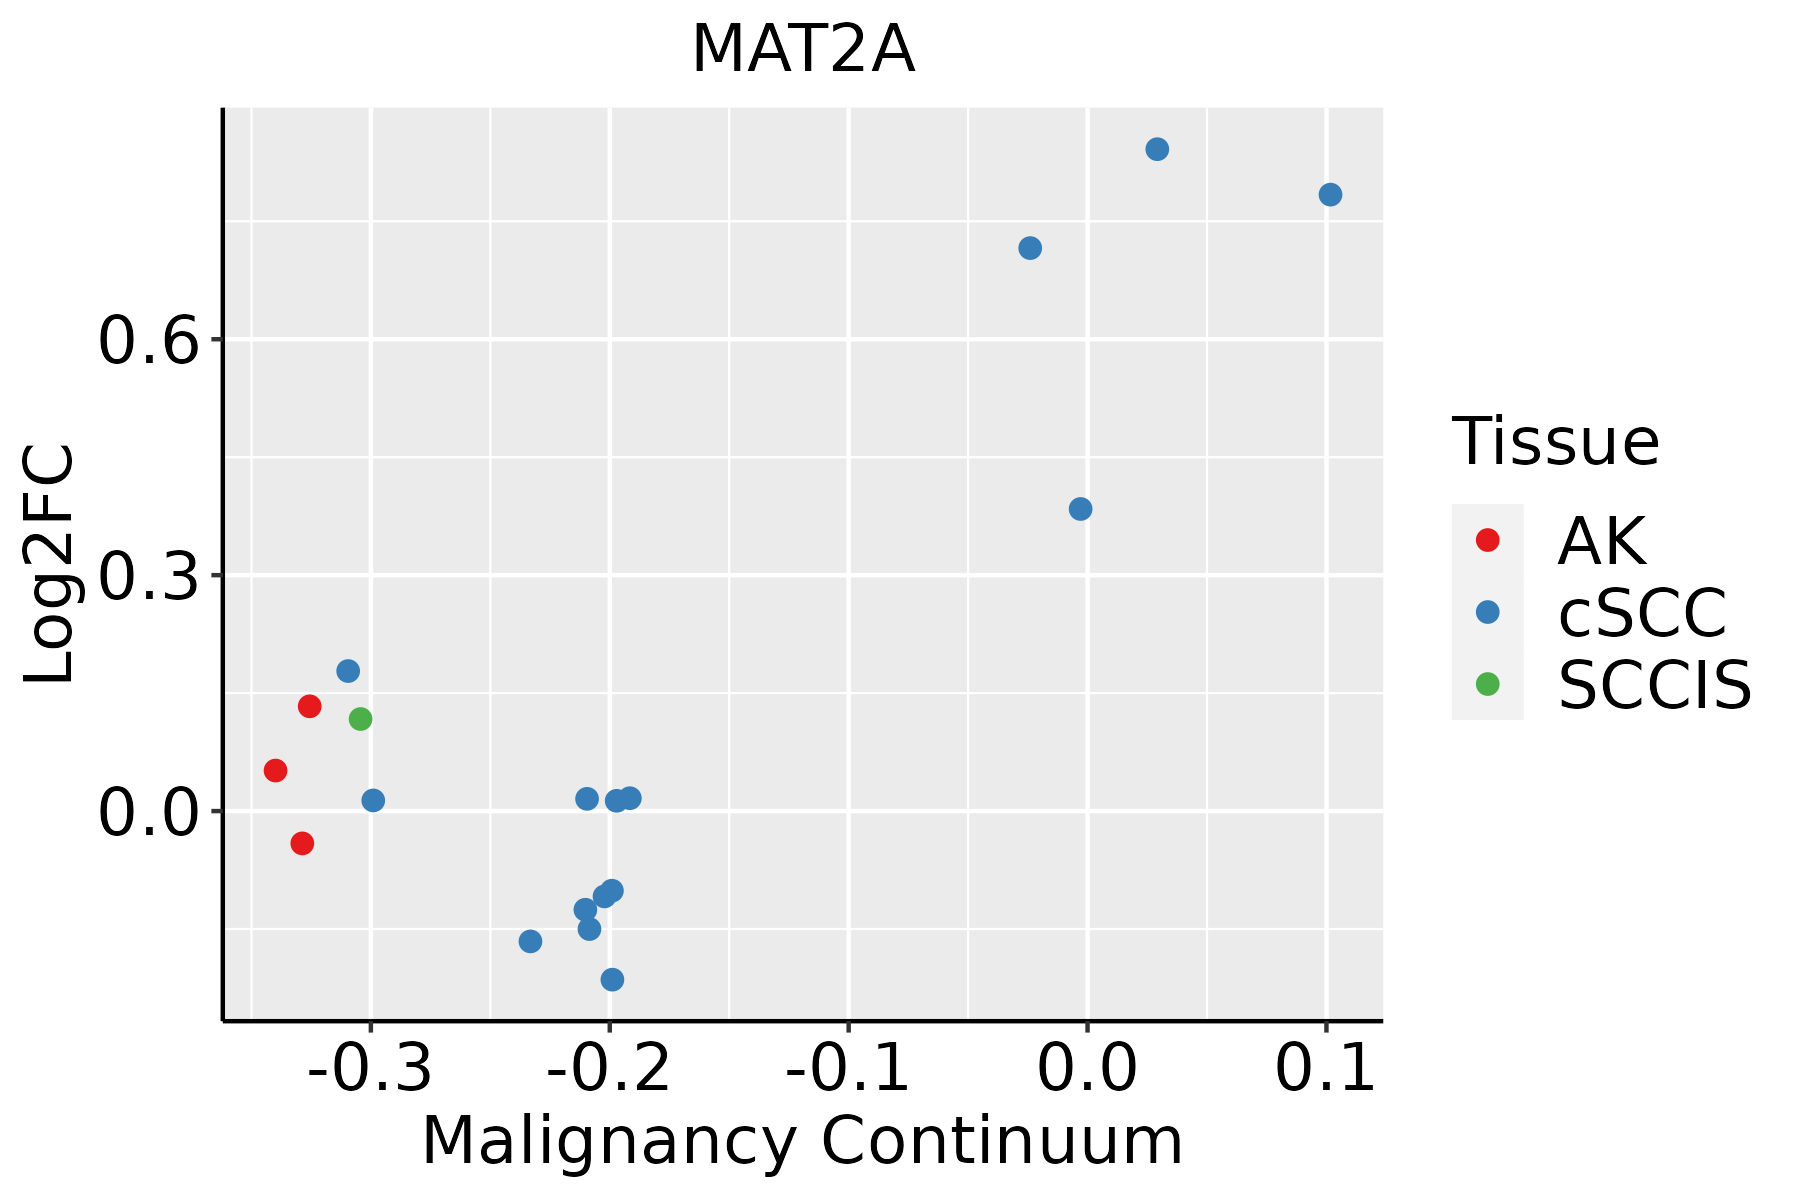 | AK: Actinic keratosis |
| cSCC: Cutaneous squamous cell carcinoma | ||
| SCCIS:squamous cell carcinoma in situ | ||
| Thyroid |  | ATC: Anaplastic thyroid cancer |
| HT: Hashimoto's thyroiditis | ||
| PTC: Papillary thyroid cancer |
| ∗log2FC in expression of this searched gene in stem-like cells from each diseased tissue sample relative to stem-like cells in normal samples in each tissue plotted against the malignancy continuum. Samples are colored based on if they are from different disease stage. |
Top |
Malignant transformation related pathway analysis |
| Find out the enriched GO biological processes and KEGG pathways involved in transition from healthy to precancer to cancer |
| Tissue | Disease Stage | Enriched GO biological Processes |
| Colorectum | AD |  |
| Colorectum | SER |  |
| Colorectum | MSS |  |
| Colorectum | MSI-H |  |
| Colorectum | FAP |  |
| ∗Top 15 enriched GO BP terms are showed in the bar plot of each disease state in each tissue. Each row represents a significant GO biological process which is colored according to the -log10(p.adjust). |
| Page: 1 2 3 4 5 6 7 8 9 |
| GO ID | Tissue | Disease Stage | Description | Gene Ratio | Bg Ratio | pvalue | p.adjust | Count |
| GO:19908308 | Esophagus | HGIN | cellular response to leukemia inhibitory factor | 23/2587 | 94/18723 | 3.92e-03 | 3.54e-02 | 23 |
| GO:19908238 | Esophagus | HGIN | response to leukemia inhibitory factor | 23/2587 | 95/18723 | 4.51e-03 | 3.93e-02 | 23 |
| GO:00067906 | Esophagus | ESCC | sulfur compound metabolic process | 201/8552 | 339/18723 | 2.64e-07 | 3.94e-06 | 201 |
| GO:00442725 | Esophagus | ESCC | sulfur compound biosynthetic process | 96/8552 | 148/18723 | 1.86e-06 | 2.16e-05 | 96 |
| GO:199082316 | Esophagus | ESCC | response to leukemia inhibitory factor | 60/8552 | 95/18723 | 4.41e-04 | 2.48e-03 | 60 |
| GO:199083015 | Esophagus | ESCC | cellular response to leukemia inhibitory factor | 59/8552 | 94/18723 | 6.19e-04 | 3.32e-03 | 59 |
| GO:00512592 | Esophagus | ESCC | protein complex oligomerization | 130/8552 | 238/18723 | 3.29e-03 | 1.36e-02 | 130 |
| GO:000679011 | Liver | Cirrhotic | sulfur compound metabolic process | 129/4634 | 339/18723 | 3.06e-08 | 1.04e-06 | 129 |
| GO:00442721 | Liver | Cirrhotic | sulfur compound biosynthetic process | 58/4634 | 148/18723 | 6.93e-05 | 7.83e-04 | 58 |
| GO:00067303 | Liver | Cirrhotic | one-carbon metabolic process | 17/4634 | 40/18723 | 1.04e-02 | 4.61e-02 | 17 |
| GO:000679021 | Liver | HCC | sulfur compound metabolic process | 212/7958 | 339/18723 | 5.60e-14 | 3.39e-12 | 212 |
| GO:00442722 | Liver | HCC | sulfur compound biosynthetic process | 95/7958 | 148/18723 | 7.89e-08 | 1.58e-06 | 95 |
| GO:0046500 | Liver | HCC | S-adenosylmethionine metabolic process | 13/7958 | 15/18723 | 5.67e-04 | 3.61e-03 | 13 |
| GO:0051291 | Liver | HCC | protein heterooligomerization | 17/7958 | 25/18723 | 8.94e-03 | 3.45e-02 | 17 |
| GO:19908237 | Oral cavity | OSCC | response to leukemia inhibitory factor | 58/7305 | 95/18723 | 1.10e-05 | 1.14e-04 | 58 |
| GO:19908307 | Oral cavity | OSCC | cellular response to leukemia inhibitory factor | 57/7305 | 94/18723 | 1.75e-05 | 1.71e-04 | 57 |
| GO:00442724 | Oral cavity | OSCC | sulfur compound biosynthetic process | 82/7305 | 148/18723 | 3.71e-05 | 3.31e-04 | 82 |
| GO:00067905 | Oral cavity | OSCC | sulfur compound metabolic process | 168/7305 | 339/18723 | 4.50e-05 | 3.84e-04 | 168 |
| GO:0051259 | Oral cavity | OSCC | protein complex oligomerization | 121/7305 | 238/18723 | 1.29e-04 | 9.21e-04 | 121 |
| GO:199082315 | Oral cavity | EOLP | response to leukemia inhibitory factor | 26/2218 | 95/18723 | 2.91e-05 | 4.20e-04 | 26 |
| Page: 1 2 |
| Pathway ID | Tissue | Disease Stage | Description | Gene Ratio | Bg Ratio | pvalue | p.adjust | qvalue | Count |
| hsa012306 | Esophagus | HGIN | Biosynthesis of amino acids | 21/1383 | 75/8465 | 7.38e-03 | 4.63e-02 | 3.68e-02 | 21 |
| hsa0123013 | Esophagus | HGIN | Biosynthesis of amino acids | 21/1383 | 75/8465 | 7.38e-03 | 4.63e-02 | 3.68e-02 | 21 |
| hsa012405 | Esophagus | ESCC | Biosynthesis of cofactors | 97/4205 | 153/8465 | 3.88e-04 | 1.35e-03 | 6.94e-04 | 97 |
| hsa0123023 | Esophagus | ESCC | Biosynthesis of amino acids | 49/4205 | 75/8465 | 4.35e-03 | 1.12e-02 | 5.74e-03 | 49 |
| hsa0124012 | Esophagus | ESCC | Biosynthesis of cofactors | 97/4205 | 153/8465 | 3.88e-04 | 1.35e-03 | 6.94e-04 | 97 |
| hsa0123033 | Esophagus | ESCC | Biosynthesis of amino acids | 49/4205 | 75/8465 | 4.35e-03 | 1.12e-02 | 5.74e-03 | 49 |
| hsa01240 | Liver | Cirrhotic | Biosynthesis of cofactors | 66/2530 | 153/8465 | 3.11e-04 | 1.99e-03 | 1.23e-03 | 66 |
| hsa00270 | Liver | Cirrhotic | Cysteine and methionine metabolism | 27/2530 | 52/8465 | 6.98e-04 | 4.15e-03 | 2.56e-03 | 27 |
| hsa012304 | Liver | Cirrhotic | Biosynthesis of amino acids | 35/2530 | 75/8465 | 1.54e-03 | 7.83e-03 | 4.83e-03 | 35 |
| hsa012401 | Liver | Cirrhotic | Biosynthesis of cofactors | 66/2530 | 153/8465 | 3.11e-04 | 1.99e-03 | 1.23e-03 | 66 |
| hsa002701 | Liver | Cirrhotic | Cysteine and methionine metabolism | 27/2530 | 52/8465 | 6.98e-04 | 4.15e-03 | 2.56e-03 | 27 |
| hsa0123011 | Liver | Cirrhotic | Biosynthesis of amino acids | 35/2530 | 75/8465 | 1.54e-03 | 7.83e-03 | 4.83e-03 | 35 |
| hsa012402 | Liver | HCC | Biosynthesis of cofactors | 103/4020 | 153/8465 | 4.67e-07 | 5.05e-06 | 2.81e-06 | 103 |
| hsa0123021 | Liver | HCC | Biosynthesis of amino acids | 53/4020 | 75/8465 | 3.79e-05 | 2.11e-04 | 1.18e-04 | 53 |
| hsa002702 | Liver | HCC | Cysteine and methionine metabolism | 35/4020 | 52/8465 | 3.03e-03 | 9.94e-03 | 5.53e-03 | 35 |
| hsa012403 | Liver | HCC | Biosynthesis of cofactors | 103/4020 | 153/8465 | 4.67e-07 | 5.05e-06 | 2.81e-06 | 103 |
| hsa0123031 | Liver | HCC | Biosynthesis of amino acids | 53/4020 | 75/8465 | 3.79e-05 | 2.11e-04 | 1.18e-04 | 53 |
| hsa002703 | Liver | HCC | Cysteine and methionine metabolism | 35/4020 | 52/8465 | 3.03e-03 | 9.94e-03 | 5.53e-03 | 35 |
| hsa012404 | Oral cavity | OSCC | Biosynthesis of cofactors | 88/3704 | 153/8465 | 3.84e-04 | 1.20e-03 | 6.12e-04 | 88 |
| hsa012305 | Oral cavity | OSCC | Biosynthesis of amino acids | 45/3704 | 75/8465 | 3.27e-03 | 8.23e-03 | 4.19e-03 | 45 |
| Page: 1 2 |
Top |
Cell-cell communication analysis |
| Identification of potential cell-cell interactions between two cell types and their ligand-receptor pairs for different disease states |
| Ligand | Receptor | LRpair | Pathway | Tissue | Disease Stage |
| Page: 1 |
Top |
Single-cell gene regulatory network inference analysis |
| Find out the significant the regulons (TFs) and the target genes of each regulon across cell types for different disease states |
| TF | Cell Type | Tissue | Disease Stage | Target Gene | RSS | Regulon Activity |
| ∗The dot plots of a searched regulon are shown for all cell subpopulations in each disease state of each tissue based on the regulon specific score inferred using pySCENIC and by calculating the average expression. |
| Page: 1 |
Top |
Somatic mutation of malignant transformation related genes |
| Annotation of somatic variants for genes involved in malignant transformation |
| Hugo Symbol | Variant Class | Variant Classification | dbSNP RS | HGVSc | HGVSp | HGVSp Short | SWISSPROT | BIOTYPE | SIFT | PolyPhen | Tumor Sample Barcode | Tissue | Histology | Sex | Age | Stage | Therapy Types | Drugs | Outcome |
| MAT2A | SNV | Missense_Mutation | c.115N>C | p.Asp39His | p.D39H | P31153 | protein_coding | deleterious(0) | probably_damaging(1) | TCGA-AC-A23H-01 | Breast | breast invasive carcinoma | Female | >=65 | I/II | Unknown | Unknown | PD | |
| MAT2A | SNV | Missense_Mutation | novel | c.148N>T | p.Pro50Ser | p.P50S | P31153 | protein_coding | deleterious(0.01) | possibly_damaging(0.666) | TCGA-AC-A5XS-01 | Breast | breast invasive carcinoma | Female | >=65 | I/II | Hormone Therapy | femara | SD |
| MAT2A | SNV | Missense_Mutation | c.251N>C | p.Arg84Pro | p.R84P | P31153 | protein_coding | deleterious(0) | probably_damaging(0.999) | TCGA-AR-A0TS-01 | Breast | breast invasive carcinoma | Female | <65 | I/II | Chemotherapy | doxorubicin | SD | |
| MAT2A | SNV | Missense_Mutation | c.943N>G | p.Leu315Val | p.L315V | P31153 | protein_coding | deleterious(0.01) | probably_damaging(0.98) | TCGA-E9-A1RG-01 | Breast | breast invasive carcinoma | Female | <65 | III/IV | Hormone Therapy | tamoxiphen | SD | |
| MAT2A | insertion | Frame_Shift_Ins | novel | c.210_211insGGTGATCCACCTTGGCCGCCCAAAGTGCTGGG | p.Ile71GlyfsTer49 | p.I71Gfs*49 | P31153 | protein_coding | TCGA-A8-A09X-01 | Breast | breast invasive carcinoma | Female | <65 | III/IV | Unknown | Unknown | SD | ||
| MAT2A | SNV | Missense_Mutation | c.1112N>C | p.Tyr371Ser | p.Y371S | P31153 | protein_coding | deleterious(0) | probably_damaging(0.998) | TCGA-JX-A3Q0-01 | Cervix | cervical & endocervical cancer | Female | <65 | III/IV | Unknown | Unknown | SD | |
| MAT2A | SNV | Missense_Mutation | c.1067N>A | p.Arg356His | p.R356H | P31153 | protein_coding | deleterious(0.01) | probably_damaging(0.995) | TCGA-A6-2684-01 | Colorectum | colon adenocarcinoma | Female | >=65 | I/II | Unknown | Unknown | PD | |
| MAT2A | SNV | Missense_Mutation | c.416N>C | p.Phe139Ser | p.F139S | P31153 | protein_coding | deleterious(0) | probably_damaging(0.994) | TCGA-G4-6588-01 | Colorectum | colon adenocarcinoma | Female | <65 | I/II | Unknown | Unknown | SD | |
| MAT2A | SNV | Missense_Mutation | novel | c.683N>G | p.Lys228Arg | p.K228R | P31153 | protein_coding | tolerated(0.14) | benign(0.005) | TCGA-F5-6814-01 | Colorectum | rectum adenocarcinoma | Male | <65 | I/II | Unknown | Unknown | SD |
| MAT2A | SNV | Missense_Mutation | novel | c.875N>A | p.Arg292His | p.R292H | P31153 | protein_coding | deleterious(0) | probably_damaging(0.998) | TCGA-A5-A0G1-01 | Endometrium | uterine corpus endometrioid carcinoma | Female | >=65 | I/II | Unknown | Unknown | SD |
| Page: 1 2 3 |
Top |
Related drugs of malignant transformation related genes |
| Identification of chemicals and drugs interact with genes involved in malignant transfromation |
| (DGIdb 4.0) |
| Entrez ID | Symbol | Category | Interaction Types | Drug Claim Name | Drug Name | PMIDs |
| 4144 | MAT2A | ENZYME | AG-270 |
| Page: 1 |

Copyright 2023-Present -The University of Texas Health Science Center at Houston |