
|
|||||
|
 | |
| |
| |
| |
| |
| |
|
Gene: MARVELD2 |
Gene summary for MARVELD2 |
| Gene information | Species | Human | Gene symbol | MARVELD2 | Gene ID | 153562 |
| Gene name | MARVEL domain containing 2 | |
| Gene Alias | DFNB49 | |
| Cytomap | 5q13.2 | |
| Gene Type | protein-coding | GO ID | GO:0001885 | UniProtAcc | Q8N4S9 |
Top |
Malignant transformation analysis |
| Identification of the aberrant gene expression in precancerous and cancerous lesions by comparing the gene expression of stem-like cells in diseased tissues with normal stem cells |
| Entrez ID | Symbol | Replicates | Species | Organ | Tissue | Adj P-value | Log2FC | Malignancy |
| 153562 | MARVELD2 | HTA11_1938_2000001011 | Human | Colorectum | AD | 1.29e-02 | 3.33e-01 | -0.0811 |
| 153562 | MARVELD2 | HTA11_78_2000001011 | Human | Colorectum | AD | 2.60e-06 | 4.23e-01 | -0.1088 |
| 153562 | MARVELD2 | HTA11_347_2000001011 | Human | Colorectum | AD | 4.30e-17 | 4.93e-01 | -0.1954 |
| 153562 | MARVELD2 | HTA11_99999971662_82457 | Human | Colorectum | MSS | 2.18e-02 | 3.37e-01 | 0.3859 |
| 153562 | MARVELD2 | A002-C-116 | Human | Colorectum | FAP | 3.65e-02 | -3.86e-02 | -0.0452 |
| 153562 | MARVELD2 | LZE8T | Human | Esophagus | ESCC | 3.00e-02 | 1.65e-01 | 0.067 |
| 153562 | MARVELD2 | LZE20T | Human | Esophagus | ESCC | 3.01e-02 | 1.62e-01 | 0.0662 |
| 153562 | MARVELD2 | LZE24T | Human | Esophagus | ESCC | 4.55e-13 | 4.26e-01 | 0.0596 |
| 153562 | MARVELD2 | LZE21T | Human | Esophagus | ESCC | 1.16e-02 | 1.71e-01 | 0.0655 |
| 153562 | MARVELD2 | P1T-E | Human | Esophagus | ESCC | 4.93e-05 | 3.13e-01 | 0.0875 |
| 153562 | MARVELD2 | P2T-E | Human | Esophagus | ESCC | 5.65e-31 | 4.48e-01 | 0.1177 |
| 153562 | MARVELD2 | P4T-E | Human | Esophagus | ESCC | 1.07e-04 | 2.25e-01 | 0.1323 |
| 153562 | MARVELD2 | P5T-E | Human | Esophagus | ESCC | 9.42e-06 | 4.83e-02 | 0.1327 |
| 153562 | MARVELD2 | P8T-E | Human | Esophagus | ESCC | 6.56e-15 | 2.97e-01 | 0.0889 |
| 153562 | MARVELD2 | P9T-E | Human | Esophagus | ESCC | 1.35e-06 | 1.14e-01 | 0.1131 |
| 153562 | MARVELD2 | P10T-E | Human | Esophagus | ESCC | 1.79e-05 | 9.94e-02 | 0.116 |
| 153562 | MARVELD2 | P11T-E | Human | Esophagus | ESCC | 8.16e-07 | 4.05e-01 | 0.1426 |
| 153562 | MARVELD2 | P12T-E | Human | Esophagus | ESCC | 3.93e-18 | 4.04e-01 | 0.1122 |
| 153562 | MARVELD2 | P15T-E | Human | Esophagus | ESCC | 6.18e-11 | 3.11e-01 | 0.1149 |
| 153562 | MARVELD2 | P16T-E | Human | Esophagus | ESCC | 4.39e-23 | 1.56e-01 | 0.1153 |
| Page: 1 2 3 4 5 |
| Tissue | Expression Dynamics | Abbreviation |
| Colorectum (GSE201348) |  | FAP: Familial adenomatous polyposis |
| CRC: Colorectal cancer | ||
| Colorectum (HTA11) |  | AD: Adenomas |
| SER: Sessile serrated lesions | ||
| MSI-H: Microsatellite-high colorectal cancer | ||
| MSS: Microsatellite stable colorectal cancer | ||
| Esophagus |  | ESCC: Esophageal squamous cell carcinoma |
| HGIN: High-grade intraepithelial neoplasias | ||
| LGIN: Low-grade intraepithelial neoplasias | ||
| Liver | 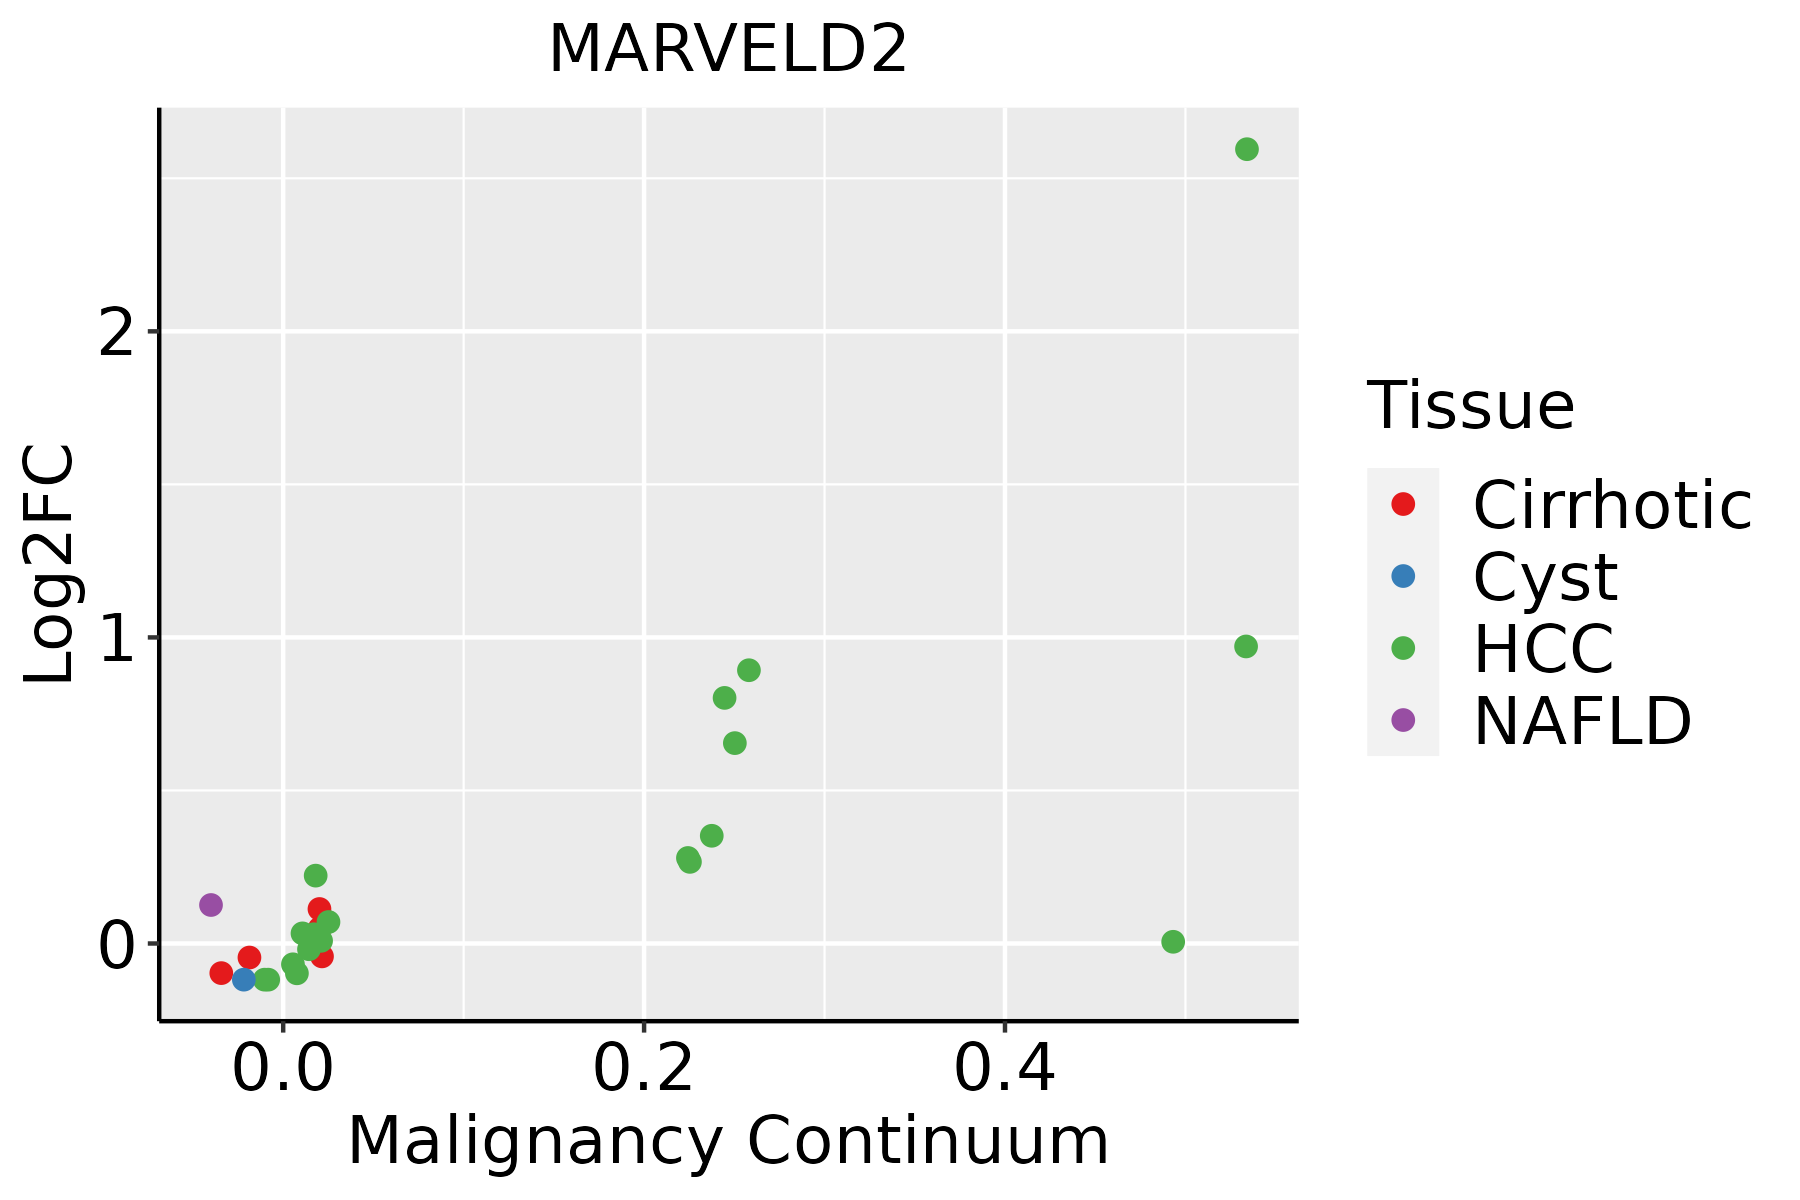 | HCC: Hepatocellular carcinoma |
| NAFLD: Non-alcoholic fatty liver disease | ||
| Oral Cavity | 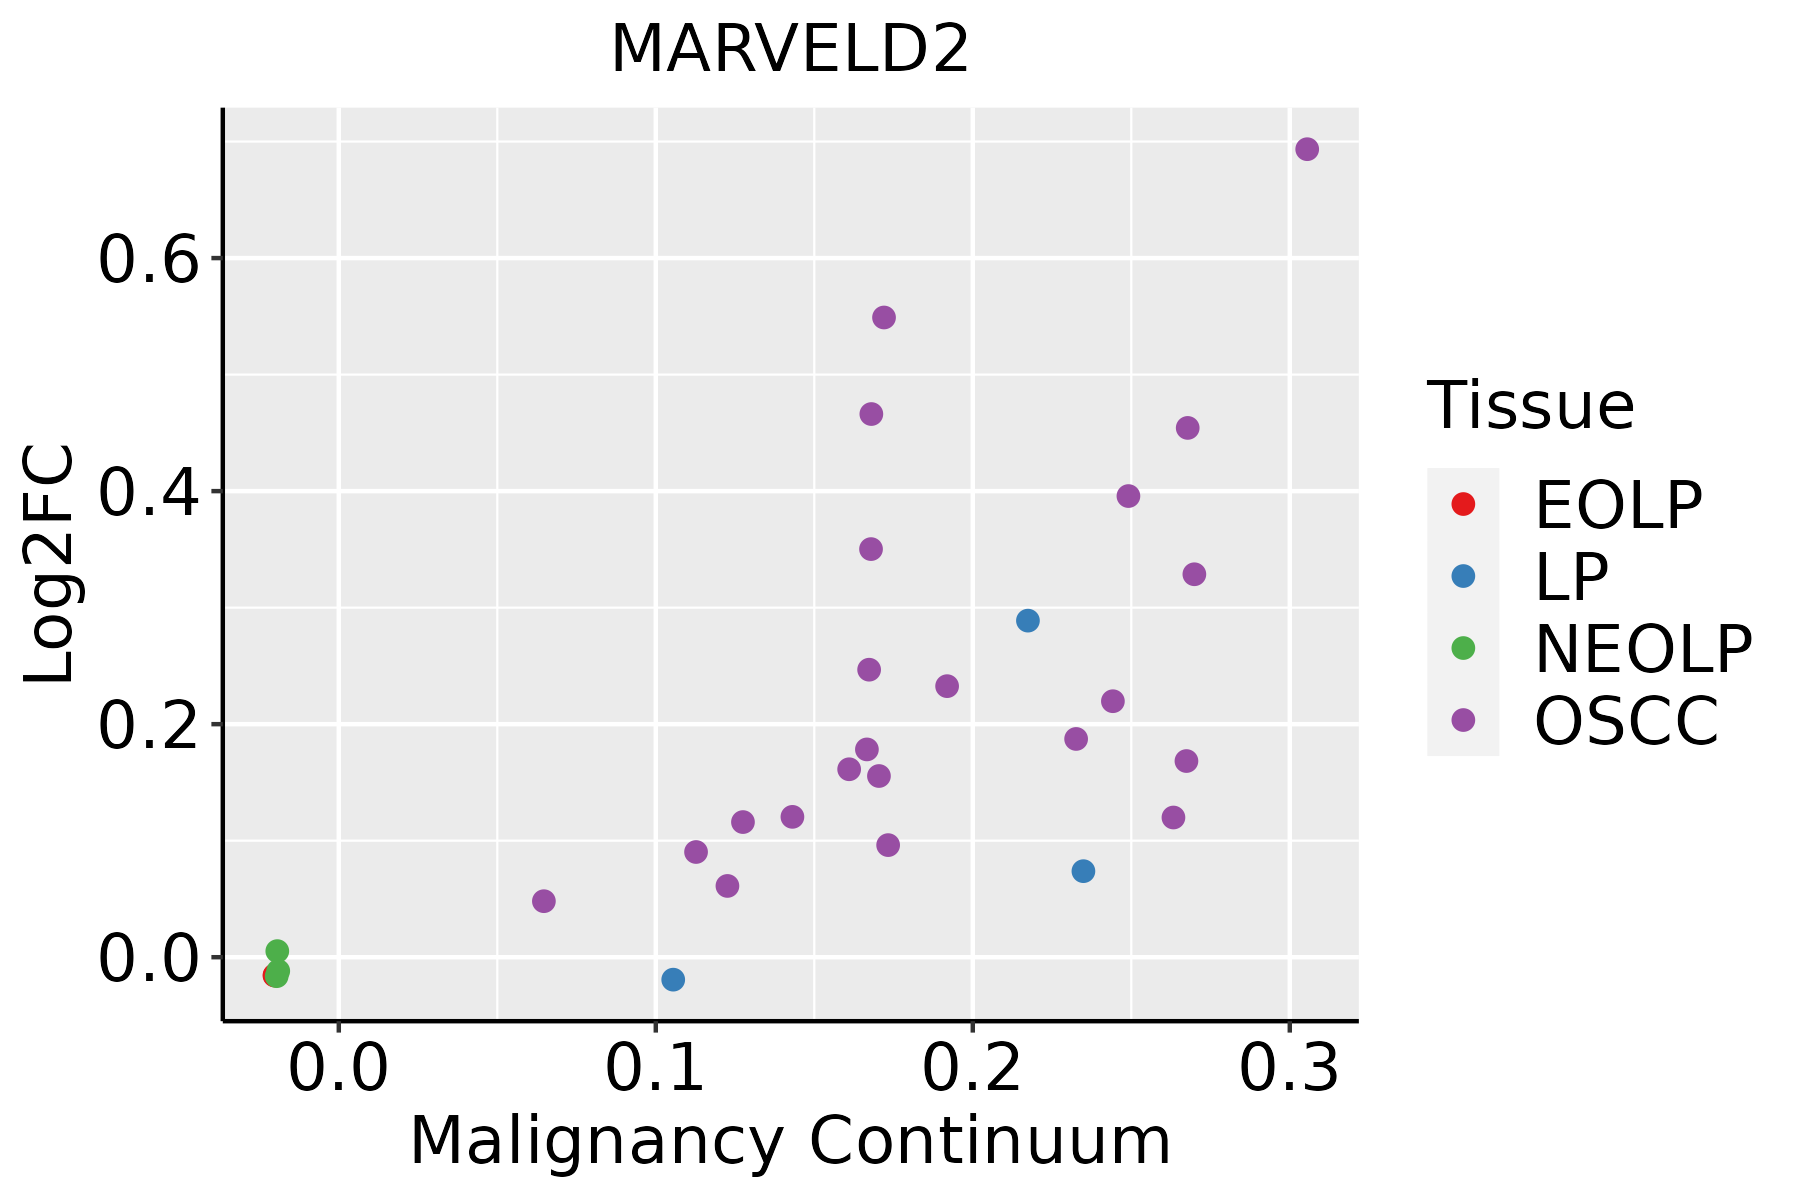 | EOLP: Erosive Oral lichen planus |
| LP: leukoplakia | ||
| NEOLP: Non-erosive oral lichen planus | ||
| OSCC: Oral squamous cell carcinoma |
| ∗log2FC in expression of this searched gene in stem-like cells from each diseased tissue sample relative to stem-like cells in normal samples in each tissue plotted against the malignancy continuum. Samples are colored based on if they are from different disease stage. |
Top |
Malignant transformation related pathway analysis |
| Find out the enriched GO biological processes and KEGG pathways involved in transition from healthy to precancer to cancer |
| Tissue | Disease Stage | Enriched GO biological Processes |
| Colorectum | AD |  |
| Colorectum | SER |  |
| Colorectum | MSS |  |
| Colorectum | MSI-H |  |
| Colorectum | FAP |  |
| ∗Top 15 enriched GO BP terms are showed in the bar plot of each disease state in each tissue. Each row represents a significant GO biological process which is colored according to the -log10(p.adjust). |
| Page: 1 2 3 4 5 6 7 8 9 |
| GO ID | Tissue | Disease Stage | Description | Gene Ratio | Bg Ratio | pvalue | p.adjust | Count |
| GO:0002064 | Colorectum | AD | epithelial cell development | 89/3918 | 220/18723 | 2.98e-11 | 3.52e-09 | 89 |
| GO:0045216 | Colorectum | AD | cell-cell junction organization | 80/3918 | 200/18723 | 5.57e-10 | 4.58e-08 | 80 |
| GO:0034329 | Colorectum | AD | cell junction assembly | 136/3918 | 420/18723 | 2.02e-08 | 1.15e-06 | 136 |
| GO:0007043 | Colorectum | AD | cell-cell junction assembly | 57/3918 | 146/18723 | 4.18e-07 | 1.61e-05 | 57 |
| GO:0043297 | Colorectum | AD | apical junction assembly | 34/3918 | 78/18723 | 5.31e-06 | 1.37e-04 | 34 |
| GO:0061028 | Colorectum | AD | establishment of endothelial barrier | 23/3918 | 46/18723 | 1.14e-05 | 2.57e-04 | 23 |
| GO:0120193 | Colorectum | AD | tight junction organization | 33/3918 | 80/18723 | 2.93e-05 | 5.42e-04 | 33 |
| GO:0120192 | Colorectum | AD | tight junction assembly | 31/3918 | 74/18723 | 3.53e-05 | 6.43e-04 | 31 |
| GO:0070830 | Colorectum | AD | bicellular tight junction assembly | 28/3918 | 70/18723 | 2.15e-04 | 2.83e-03 | 28 |
| GO:0001885 | Colorectum | AD | endothelial cell development | 26/3918 | 64/18723 | 2.67e-04 | 3.29e-03 | 26 |
| GO:0003158 | Colorectum | AD | endothelium development | 44/3918 | 136/18723 | 1.20e-03 | 1.07e-02 | 44 |
| GO:0045446 | Colorectum | AD | endothelial cell differentiation | 39/3918 | 118/18723 | 1.42e-03 | 1.22e-02 | 39 |
| GO:00020642 | Colorectum | MSS | epithelial cell development | 81/3467 | 220/18723 | 1.02e-10 | 1.06e-08 | 81 |
| GO:00452162 | Colorectum | MSS | cell-cell junction organization | 69/3467 | 200/18723 | 5.07e-08 | 2.70e-06 | 69 |
| GO:00343292 | Colorectum | MSS | cell junction assembly | 120/3467 | 420/18723 | 2.51e-07 | 1.07e-05 | 120 |
| GO:00070432 | Colorectum | MSS | cell-cell junction assembly | 50/3467 | 146/18723 | 4.24e-06 | 1.21e-04 | 50 |
| GO:00610282 | Colorectum | MSS | establishment of endothelial barrier | 20/3467 | 46/18723 | 8.26e-05 | 1.35e-03 | 20 |
| GO:00432972 | Colorectum | MSS | apical junction assembly | 28/3467 | 78/18723 | 2.12e-04 | 2.95e-03 | 28 |
| GO:01201932 | Colorectum | MSS | tight junction organization | 27/3467 | 80/18723 | 8.31e-04 | 8.68e-03 | 27 |
| GO:01201922 | Colorectum | MSS | tight junction assembly | 25/3467 | 74/18723 | 1.25e-03 | 1.20e-02 | 25 |
| Page: 1 2 3 |
| Pathway ID | Tissue | Disease Stage | Description | Gene Ratio | Bg Ratio | pvalue | p.adjust | qvalue | Count |
| hsa04530 | Colorectum | AD | Tight junction | 76/2092 | 169/8465 | 5.49e-09 | 9.69e-08 | 6.18e-08 | 76 |
| hsa045301 | Colorectum | AD | Tight junction | 76/2092 | 169/8465 | 5.49e-09 | 9.69e-08 | 6.18e-08 | 76 |
| hsa045304 | Colorectum | MSS | Tight junction | 66/1875 | 169/8465 | 4.10e-07 | 6.25e-06 | 3.83e-06 | 66 |
| hsa045305 | Colorectum | MSS | Tight junction | 66/1875 | 169/8465 | 4.10e-07 | 6.25e-06 | 3.83e-06 | 66 |
| hsa045308 | Colorectum | FAP | Tight junction | 60/1404 | 169/8465 | 1.40e-09 | 9.33e-08 | 5.67e-08 | 60 |
| hsa045309 | Colorectum | FAP | Tight junction | 60/1404 | 169/8465 | 1.40e-09 | 9.33e-08 | 5.67e-08 | 60 |
| hsa04530211 | Esophagus | ESCC | Tight junction | 105/4205 | 169/8465 | 6.73e-04 | 2.23e-03 | 1.14e-03 | 105 |
| hsa04530310 | Esophagus | ESCC | Tight junction | 105/4205 | 169/8465 | 6.73e-04 | 2.23e-03 | 1.14e-03 | 105 |
| hsa0453042 | Liver | HCC | Tight junction | 110/4020 | 169/8465 | 2.45e-06 | 2.28e-05 | 1.27e-05 | 110 |
| hsa0453052 | Liver | HCC | Tight junction | 110/4020 | 169/8465 | 2.45e-06 | 2.28e-05 | 1.27e-05 | 110 |
| hsa0453030 | Oral cavity | OSCC | Tight junction | 102/3704 | 169/8465 | 8.68e-06 | 3.93e-05 | 2.00e-05 | 102 |
| hsa04530114 | Oral cavity | OSCC | Tight junction | 102/3704 | 169/8465 | 8.68e-06 | 3.93e-05 | 2.00e-05 | 102 |
| Page: 1 |
Top |
Cell-cell communication analysis |
| Identification of potential cell-cell interactions between two cell types and their ligand-receptor pairs for different disease states |
| Ligand | Receptor | LRpair | Pathway | Tissue | Disease Stage |
| Page: 1 |
Top |
Single-cell gene regulatory network inference analysis |
| Find out the significant the regulons (TFs) and the target genes of each regulon across cell types for different disease states |
| TF | Cell Type | Tissue | Disease Stage | Target Gene | RSS | Regulon Activity |
| ∗The dot plots of a searched regulon are shown for all cell subpopulations in each disease state of each tissue based on the regulon specific score inferred using pySCENIC and by calculating the average expression. |
| Page: 1 |
Top |
Somatic mutation of malignant transformation related genes |
| Annotation of somatic variants for genes involved in malignant transformation |
| Hugo Symbol | Variant Class | Variant Classification | dbSNP RS | HGVSc | HGVSp | HGVSp Short | SWISSPROT | BIOTYPE | SIFT | PolyPhen | Tumor Sample Barcode | Tissue | Histology | Sex | Age | Stage | Therapy Types | Drugs | Outcome |
| MARVELD2 | SNV | Missense_Mutation | c.1418C>G | p.Ser473Cys | p.S473C | Q8N4S9 | protein_coding | deleterious(0.01) | probably_damaging(0.937) | TCGA-D8-A1J9-01 | Breast | breast invasive carcinoma | Female | <65 | I/II | Unknown | Unknown | SD | |
| MARVELD2 | insertion | Frame_Shift_Ins | novel | c.997_998insGCTTAGTAAAAGTGCATTTTCTA | p.Val333GlyfsTer13 | p.V333Gfs*13 | Q8N4S9 | protein_coding | TCGA-AN-A0FL-01 | Breast | breast invasive carcinoma | Female | <65 | I/II | Unknown | Unknown | SD | ||
| MARVELD2 | SNV | Missense_Mutation | rs774571921 | c.1369C>T | p.Arg457Cys | p.R457C | Q8N4S9 | protein_coding | deleterious(0) | probably_damaging(0.983) | TCGA-2W-A8YY-01 | Cervix | cervical & endocervical cancer | Female | <65 | I/II | Chemotherapy | cisplatin | CR |
| MARVELD2 | SNV | Missense_Mutation | c.1470N>C | p.Met490Ile | p.M490I | Q8N4S9 | protein_coding | tolerated(0.1) | benign(0.181) | TCGA-JW-A5VL-01 | Cervix | cervical & endocervical cancer | Female | <65 | I/II | Unknown | Unknown | SD | |
| MARVELD2 | SNV | Missense_Mutation | c.238C>T | p.Arg80Cys | p.R80C | Q8N4S9 | protein_coding | deleterious(0) | probably_damaging(0.984) | TCGA-AA-3852-01 | Colorectum | colon adenocarcinoma | Male | >=65 | I/II | Unknown | Unknown | PD | |
| MARVELD2 | SNV | Missense_Mutation | novel | c.614N>G | p.Ala205Gly | p.A205G | Q8N4S9 | protein_coding | tolerated(0.41) | possibly_damaging(0.572) | TCGA-AU-6004-01 | Colorectum | colon adenocarcinoma | Female | >=65 | I/II | Unknown | Unknown | SD |
| MARVELD2 | SNV | Missense_Mutation | c.1625N>T | p.Arg542Ile | p.R542I | Q8N4S9 | protein_coding | deleterious(0) | possibly_damaging(0.685) | TCGA-AZ-4315-01 | Colorectum | colon adenocarcinoma | Male | <65 | I/II | Unknown | Unknown | SD | |
| MARVELD2 | SNV | Missense_Mutation | novel | c.322T>C | p.Tyr108His | p.Y108H | Q8N4S9 | protein_coding | tolerated(0.33) | benign(0.011) | TCGA-AZ-6598-01 | Colorectum | colon adenocarcinoma | Female | >=65 | I/II | Unknown | Unknown | SD |
| MARVELD2 | SNV | Missense_Mutation | rs752573907 | c.383N>T | p.Ser128Leu | p.S128L | Q8N4S9 | protein_coding | tolerated(0.22) | benign(0.278) | TCGA-G4-6309-01 | Colorectum | colon adenocarcinoma | Female | <65 | III/IV | Chemotherapy | xeloda | PD |
| MARVELD2 | SNV | Missense_Mutation | novel | c.261N>T | p.Lys87Asn | p.K87N | Q8N4S9 | protein_coding | deleterious(0) | probably_damaging(0.998) | TCGA-F5-6814-01 | Colorectum | rectum adenocarcinoma | Male | <65 | I/II | Unknown | Unknown | SD |
| Page: 1 2 3 4 5 6 |
Top |
Related drugs of malignant transformation related genes |
| Identification of chemicals and drugs interact with genes involved in malignant transfromation |
| (DGIdb 4.0) |
| Entrez ID | Symbol | Category | Interaction Types | Drug Claim Name | Drug Name | PMIDs |
| Page: 1 |

Copyright 2023-Present -The University of Texas Health Science Center at Houston |