
|
|||||
|
 | |
| |
| |
| |
| |
| |
|
Gene: MARS2 |
Gene summary for MARS2 |
| Gene information | Species | Human | Gene symbol | MARS2 | Gene ID | 92935 |
| Gene name | methionyl-tRNA synthetase 2, mitochondrial | |
| Gene Alias | COXPD25 | |
| Cytomap | 2q33.1 | |
| Gene Type | protein-coding | GO ID | GO:0006082 | UniProtAcc | Q96GW9 |
Top |
Malignant transformation analysis |
| Identification of the aberrant gene expression in precancerous and cancerous lesions by comparing the gene expression of stem-like cells in diseased tissues with normal stem cells |
| Entrez ID | Symbol | Replicates | Species | Organ | Tissue | Adj P-value | Log2FC | Malignancy |
| 92935 | MARS2 | LZE24T | Human | Esophagus | ESCC | 3.24e-07 | 9.80e-02 | 0.0596 |
| 92935 | MARS2 | P4T-E | Human | Esophagus | ESCC | 5.38e-08 | 1.17e-01 | 0.1323 |
| 92935 | MARS2 | P5T-E | Human | Esophagus | ESCC | 2.41e-04 | -2.95e-03 | 0.1327 |
| 92935 | MARS2 | P10T-E | Human | Esophagus | ESCC | 5.31e-09 | 3.49e-02 | 0.116 |
| 92935 | MARS2 | P12T-E | Human | Esophagus | ESCC | 1.12e-05 | 1.79e-01 | 0.1122 |
| 92935 | MARS2 | P15T-E | Human | Esophagus | ESCC | 1.21e-09 | 1.30e-01 | 0.1149 |
| 92935 | MARS2 | P16T-E | Human | Esophagus | ESCC | 6.29e-13 | 1.27e-01 | 0.1153 |
| 92935 | MARS2 | P20T-E | Human | Esophagus | ESCC | 3.27e-05 | 7.99e-02 | 0.1124 |
| 92935 | MARS2 | P21T-E | Human | Esophagus | ESCC | 2.09e-04 | 2.80e-02 | 0.1617 |
| 92935 | MARS2 | P22T-E | Human | Esophagus | ESCC | 3.77e-02 | -5.29e-03 | 0.1236 |
| 92935 | MARS2 | P23T-E | Human | Esophagus | ESCC | 1.86e-21 | 5.42e-01 | 0.108 |
| 92935 | MARS2 | P24T-E | Human | Esophagus | ESCC | 5.82e-04 | 3.30e-02 | 0.1287 |
| 92935 | MARS2 | P26T-E | Human | Esophagus | ESCC | 8.63e-05 | 1.23e-01 | 0.1276 |
| 92935 | MARS2 | P27T-E | Human | Esophagus | ESCC | 1.61e-02 | 3.77e-03 | 0.1055 |
| 92935 | MARS2 | P28T-E | Human | Esophagus | ESCC | 8.48e-09 | 8.65e-02 | 0.1149 |
| 92935 | MARS2 | P30T-E | Human | Esophagus | ESCC | 8.27e-10 | 3.65e-01 | 0.137 |
| 92935 | MARS2 | P42T-E | Human | Esophagus | ESCC | 2.06e-02 | 9.64e-03 | 0.1175 |
| 92935 | MARS2 | P48T-E | Human | Esophagus | ESCC | 3.89e-03 | -2.25e-02 | 0.0959 |
| 92935 | MARS2 | P49T-E | Human | Esophagus | ESCC | 5.11e-03 | 3.03e-01 | 0.1768 |
| 92935 | MARS2 | P52T-E | Human | Esophagus | ESCC | 2.08e-15 | 1.31e-01 | 0.1555 |
| Page: 1 2 |
| Tissue | Expression Dynamics | Abbreviation |
| Esophagus | 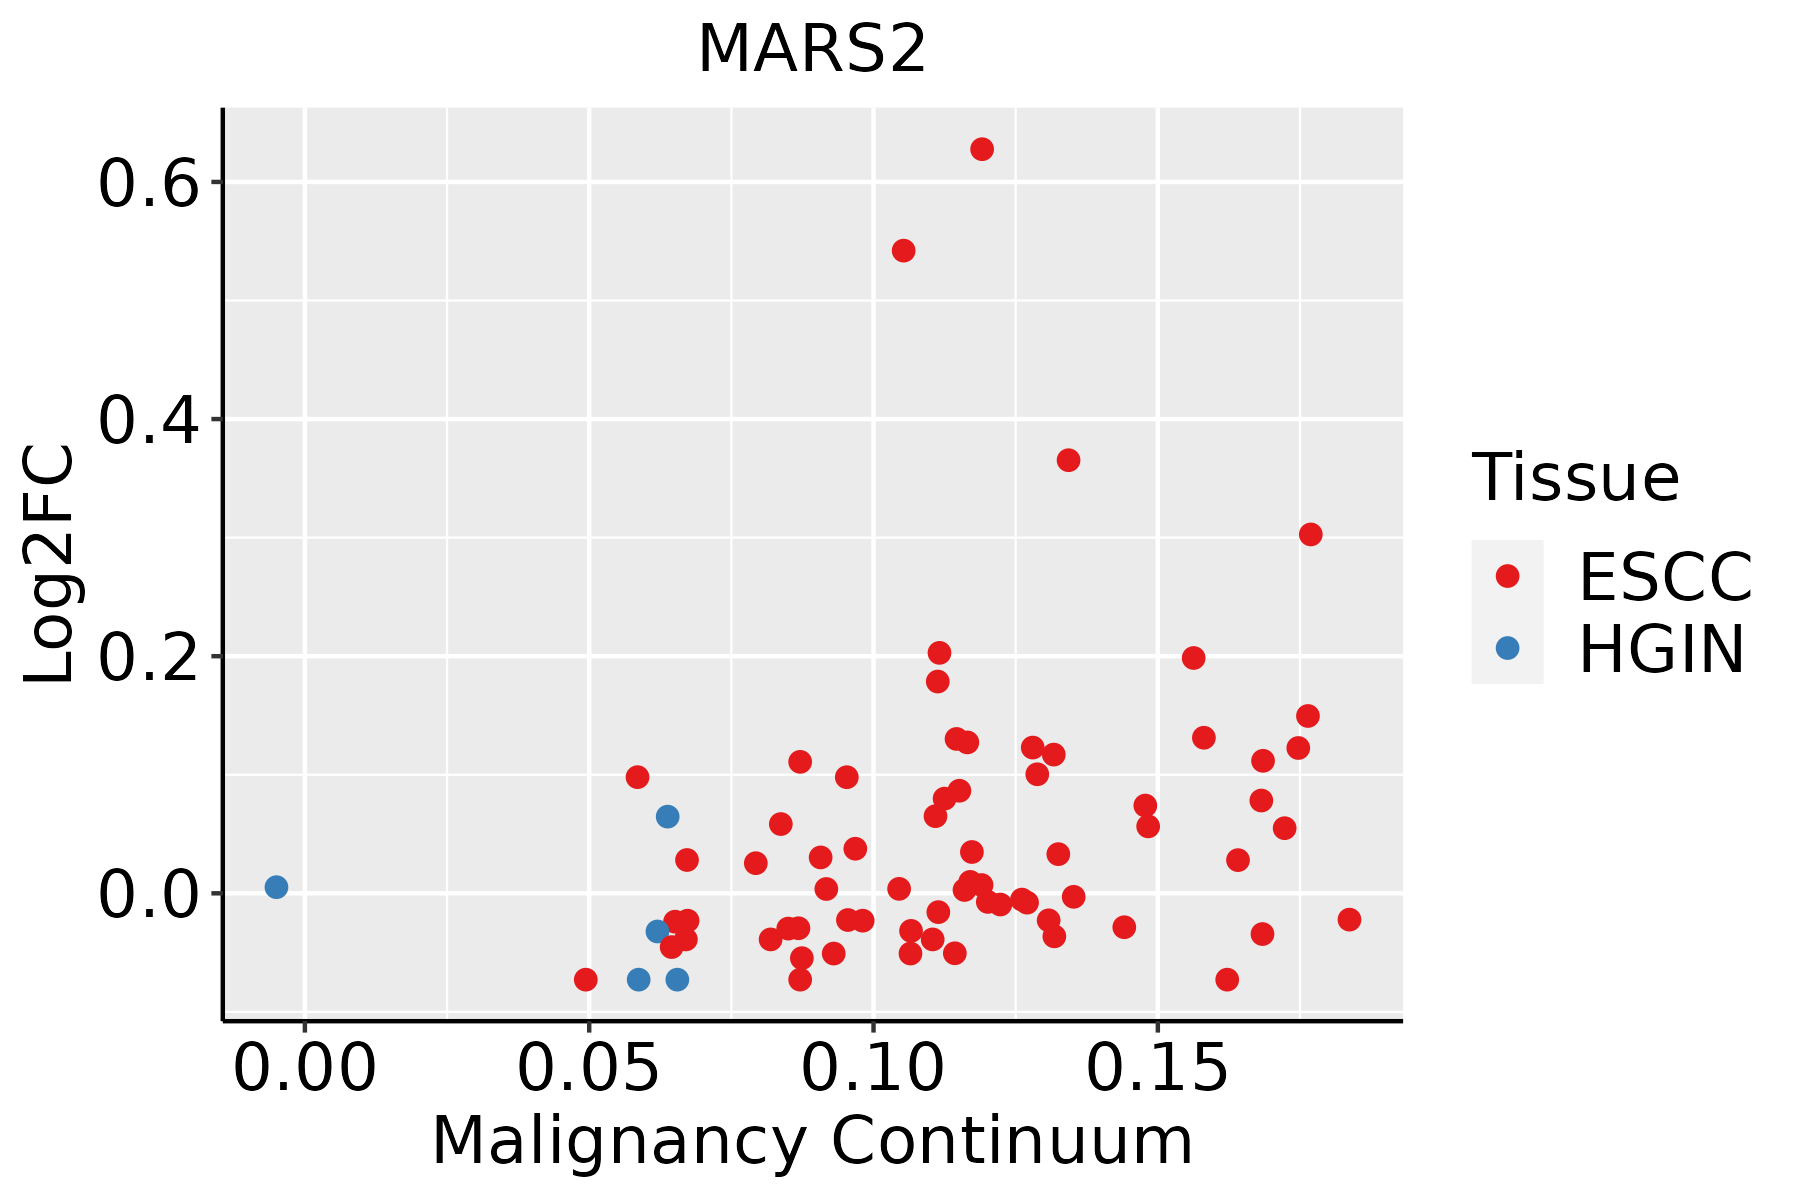 | ESCC: Esophageal squamous cell carcinoma |
| HGIN: High-grade intraepithelial neoplasias | ||
| LGIN: Low-grade intraepithelial neoplasias |
| ∗log2FC in expression of this searched gene in stem-like cells from each diseased tissue sample relative to stem-like cells in normal samples in each tissue plotted against the malignancy continuum. Samples are colored based on if they are from different disease stage. |
Top |
Malignant transformation related pathway analysis |
| Find out the enriched GO biological processes and KEGG pathways involved in transition from healthy to precancer to cancer |
| Tissue | Disease Stage | Enriched GO biological Processes |
| Colorectum | AD |  |
| Colorectum | SER |  |
| Colorectum | MSS |  |
| Colorectum | MSI-H |  |
| Colorectum | FAP |  |
| ∗Top 15 enriched GO BP terms are showed in the bar plot of each disease state in each tissue. Each row represents a significant GO biological process which is colored according to the -log10(p.adjust). |
| Page: 1 2 3 4 5 6 7 8 9 |
| GO ID | Tissue | Disease Stage | Description | Gene Ratio | Bg Ratio | pvalue | p.adjust | Count |
| GO:003466012 | Esophagus | ESCC | ncRNA metabolic process | 346/8552 | 485/18723 | 4.35e-31 | 2.51e-28 | 346 |
| GO:00063992 | Esophagus | ESCC | tRNA metabolic process | 122/8552 | 179/18723 | 9.03e-10 | 2.19e-08 | 122 |
| Page: 1 |
| Pathway ID | Tissue | Disease Stage | Description | Gene Ratio | Bg Ratio | pvalue | p.adjust | qvalue | Count |
| Page: 1 |
Top |
Cell-cell communication analysis |
| Identification of potential cell-cell interactions between two cell types and their ligand-receptor pairs for different disease states |
| Ligand | Receptor | LRpair | Pathway | Tissue | Disease Stage |
| Page: 1 |
Top |
Single-cell gene regulatory network inference analysis |
| Find out the significant the regulons (TFs) and the target genes of each regulon across cell types for different disease states |
| TF | Cell Type | Tissue | Disease Stage | Target Gene | RSS | Regulon Activity |
| ∗The dot plots of a searched regulon are shown for all cell subpopulations in each disease state of each tissue based on the regulon specific score inferred using pySCENIC and by calculating the average expression. |
| Page: 1 |
Top |
Somatic mutation of malignant transformation related genes |
| Annotation of somatic variants for genes involved in malignant transformation |
| Hugo Symbol | Variant Class | Variant Classification | dbSNP RS | HGVSc | HGVSp | HGVSp Short | SWISSPROT | BIOTYPE | SIFT | PolyPhen | Tumor Sample Barcode | Tissue | Histology | Sex | Age | Stage | Therapy Types | Drugs | Outcome |
| MARS2 | SNV | Missense_Mutation | novel | c.1148A>G | p.Asp383Gly | p.D383G | Q96GW9 | protein_coding | deleterious(0) | probably_damaging(1) | TCGA-D8-A1JB-01 | Breast | breast invasive carcinoma | Female | <65 | I/II | Chemotherapy | adriamycin | SD |
| MARS2 | insertion | Nonsense_Mutation | novel | c.1090_1091insATTTCATCACGTAGTTCTTCAGTG | p.Arg364delinsHisPheIleThrTerPhePheSerGly | p.R364delinsHFIT*FFSG | Q96GW9 | protein_coding | TCGA-B6-A0IK-01 | Breast | breast invasive carcinoma | Female | <65 | III/IV | Unknown | Unknown | PD | ||
| MARS2 | insertion | Frame_Shift_Ins | novel | c.489_490insTGGAGAGATCATAGAGA | p.Val164TrpfsTer84 | p.V164Wfs*84 | Q96GW9 | protein_coding | TCGA-BH-A0DS-01 | Breast | breast invasive carcinoma | Female | >=65 | III/IV | Chemotherapy | cyclophosphamide | SD | ||
| MARS2 | SNV | Missense_Mutation | novel | c.925G>T | p.Gly309Cys | p.G309C | Q96GW9 | protein_coding | deleterious(0.01) | probably_damaging(1) | TCGA-2W-A8YY-01 | Cervix | cervical & endocervical cancer | Female | <65 | I/II | Chemotherapy | cisplatin | CR |
| MARS2 | SNV | Missense_Mutation | novel | c.1403G>A | p.Arg468Gln | p.R468Q | Q96GW9 | protein_coding | tolerated(1) | benign(0) | TCGA-2W-A8YY-01 | Cervix | cervical & endocervical cancer | Female | <65 | I/II | Chemotherapy | cisplatin | CR |
| MARS2 | SNV | Missense_Mutation | c.1226N>A | p.Arg409Gln | p.R409Q | Q96GW9 | protein_coding | deleterious(0) | probably_damaging(1) | TCGA-DS-A1OD-01 | Cervix | cervical & endocervical cancer | Female | <65 | I/II | Chemotherapy | cisplatin | SD | |
| MARS2 | SNV | Missense_Mutation | novel | c.1283G>A | p.Cys428Tyr | p.C428Y | Q96GW9 | protein_coding | tolerated(0.55) | benign(0.037) | TCGA-DS-A7WI-01 | Cervix | cervical & endocervical cancer | Female | <65 | I/II | Chemotherapy | cisplatin | PD |
| MARS2 | SNV | Missense_Mutation | c.1631C>T | p.Ser544Leu | p.S544L | Q96GW9 | protein_coding | tolerated(0.19) | benign(0.042) | TCGA-EK-A2PG-01 | Cervix | cervical & endocervical cancer | Female | >=65 | I/II | Unknown | Unknown | SD | |
| MARS2 | SNV | Missense_Mutation | novel | c.818C>T | p.Ser273Leu | p.S273L | Q96GW9 | protein_coding | deleterious(0) | possibly_damaging(0.794) | TCGA-IR-A3LA-01 | Cervix | cervical & endocervical cancer | Female | <65 | I/II | Chemotherapy | cisplatin | CR |
| MARS2 | SNV | Missense_Mutation | c.632N>G | p.Tyr211Cys | p.Y211C | Q96GW9 | protein_coding | deleterious(0) | probably_damaging(1) | TCGA-A6-5665-01 | Colorectum | colon adenocarcinoma | Female | >=65 | I/II | Unknown | Unknown | PD |
| Page: 1 2 3 4 5 6 7 |
Top |
Related drugs of malignant transformation related genes |
| Identification of chemicals and drugs interact with genes involved in malignant transfromation |
| (DGIdb 4.0) |
| Entrez ID | Symbol | Category | Interaction Types | Drug Claim Name | Drug Name | PMIDs |
| Page: 1 |

Copyright 2023-Present -The University of Texas Health Science Center at Houston |