
|
|||||
|
 | |
| |
| |
| |
| |
| |
|
Gene: MARS |
Gene summary for MARS |
| Gene information | Species | Human | Gene symbol | MARS | Gene ID | 84174 |
| Gene name | Src like adaptor 2 | |
| Gene Alias | C20orf156 | |
| Cytomap | 20q11.23 | |
| Gene Type | protein-coding | GO ID | GO:0000122 | UniProtAcc | Q9H6Q3 |
Top |
Malignant transformation analysis |
| Identification of the aberrant gene expression in precancerous and cancerous lesions by comparing the gene expression of stem-like cells in diseased tissues with normal stem cells |
| Entrez ID | Symbol | Replicates | Species | Organ | Tissue | Adj P-value | Log2FC | Malignancy |
| 84174 | MARS | LZE4T | Human | Esophagus | ESCC | 2.66e-06 | 2.09e-01 | 0.0811 |
| 84174 | MARS | LZE7T | Human | Esophagus | ESCC | 1.73e-13 | 6.35e-01 | 0.0667 |
| 84174 | MARS | LZE8T | Human | Esophagus | ESCC | 6.35e-03 | 1.11e-01 | 0.067 |
| 84174 | MARS | LZE20T | Human | Esophagus | ESCC | 5.56e-07 | 2.62e-01 | 0.0662 |
| 84174 | MARS | LZE22T | Human | Esophagus | ESCC | 4.66e-08 | 3.76e-01 | 0.068 |
| 84174 | MARS | LZE24T | Human | Esophagus | ESCC | 3.21e-14 | 4.98e-01 | 0.0596 |
| 84174 | MARS | LZE21T | Human | Esophagus | ESCC | 1.70e-05 | 3.39e-01 | 0.0655 |
| 84174 | MARS | P1T-E | Human | Esophagus | ESCC | 1.08e-05 | 5.67e-01 | 0.0875 |
| 84174 | MARS | P2T-E | Human | Esophagus | ESCC | 1.55e-41 | 9.38e-01 | 0.1177 |
| 84174 | MARS | P4T-E | Human | Esophagus | ESCC | 6.67e-19 | 5.69e-01 | 0.1323 |
| 84174 | MARS | P5T-E | Human | Esophagus | ESCC | 2.37e-20 | 4.43e-01 | 0.1327 |
| 84174 | MARS | P8T-E | Human | Esophagus | ESCC | 5.66e-20 | 4.03e-01 | 0.0889 |
| 84174 | MARS | P9T-E | Human | Esophagus | ESCC | 1.61e-09 | 2.01e-01 | 0.1131 |
| 84174 | MARS | P10T-E | Human | Esophagus | ESCC | 3.40e-23 | 5.15e-01 | 0.116 |
| 84174 | MARS | P11T-E | Human | Esophagus | ESCC | 2.36e-16 | 7.47e-01 | 0.1426 |
| 84174 | MARS | P12T-E | Human | Esophagus | ESCC | 7.37e-35 | 7.64e-01 | 0.1122 |
| 84174 | MARS | P15T-E | Human | Esophagus | ESCC | 1.31e-19 | 4.85e-01 | 0.1149 |
| 84174 | MARS | P16T-E | Human | Esophagus | ESCC | 5.93e-28 | 5.77e-01 | 0.1153 |
| 84174 | MARS | P17T-E | Human | Esophagus | ESCC | 1.62e-10 | 4.71e-01 | 0.1278 |
| 84174 | MARS | P19T-E | Human | Esophagus | ESCC | 2.42e-07 | 7.45e-01 | 0.1662 |
| Page: 1 2 3 4 5 6 |
| Tissue | Expression Dynamics | Abbreviation |
| Esophagus |  | ESCC: Esophageal squamous cell carcinoma |
| HGIN: High-grade intraepithelial neoplasias | ||
| LGIN: Low-grade intraepithelial neoplasias | ||
| Liver |  | HCC: Hepatocellular carcinoma |
| NAFLD: Non-alcoholic fatty liver disease | ||
| Oral Cavity | 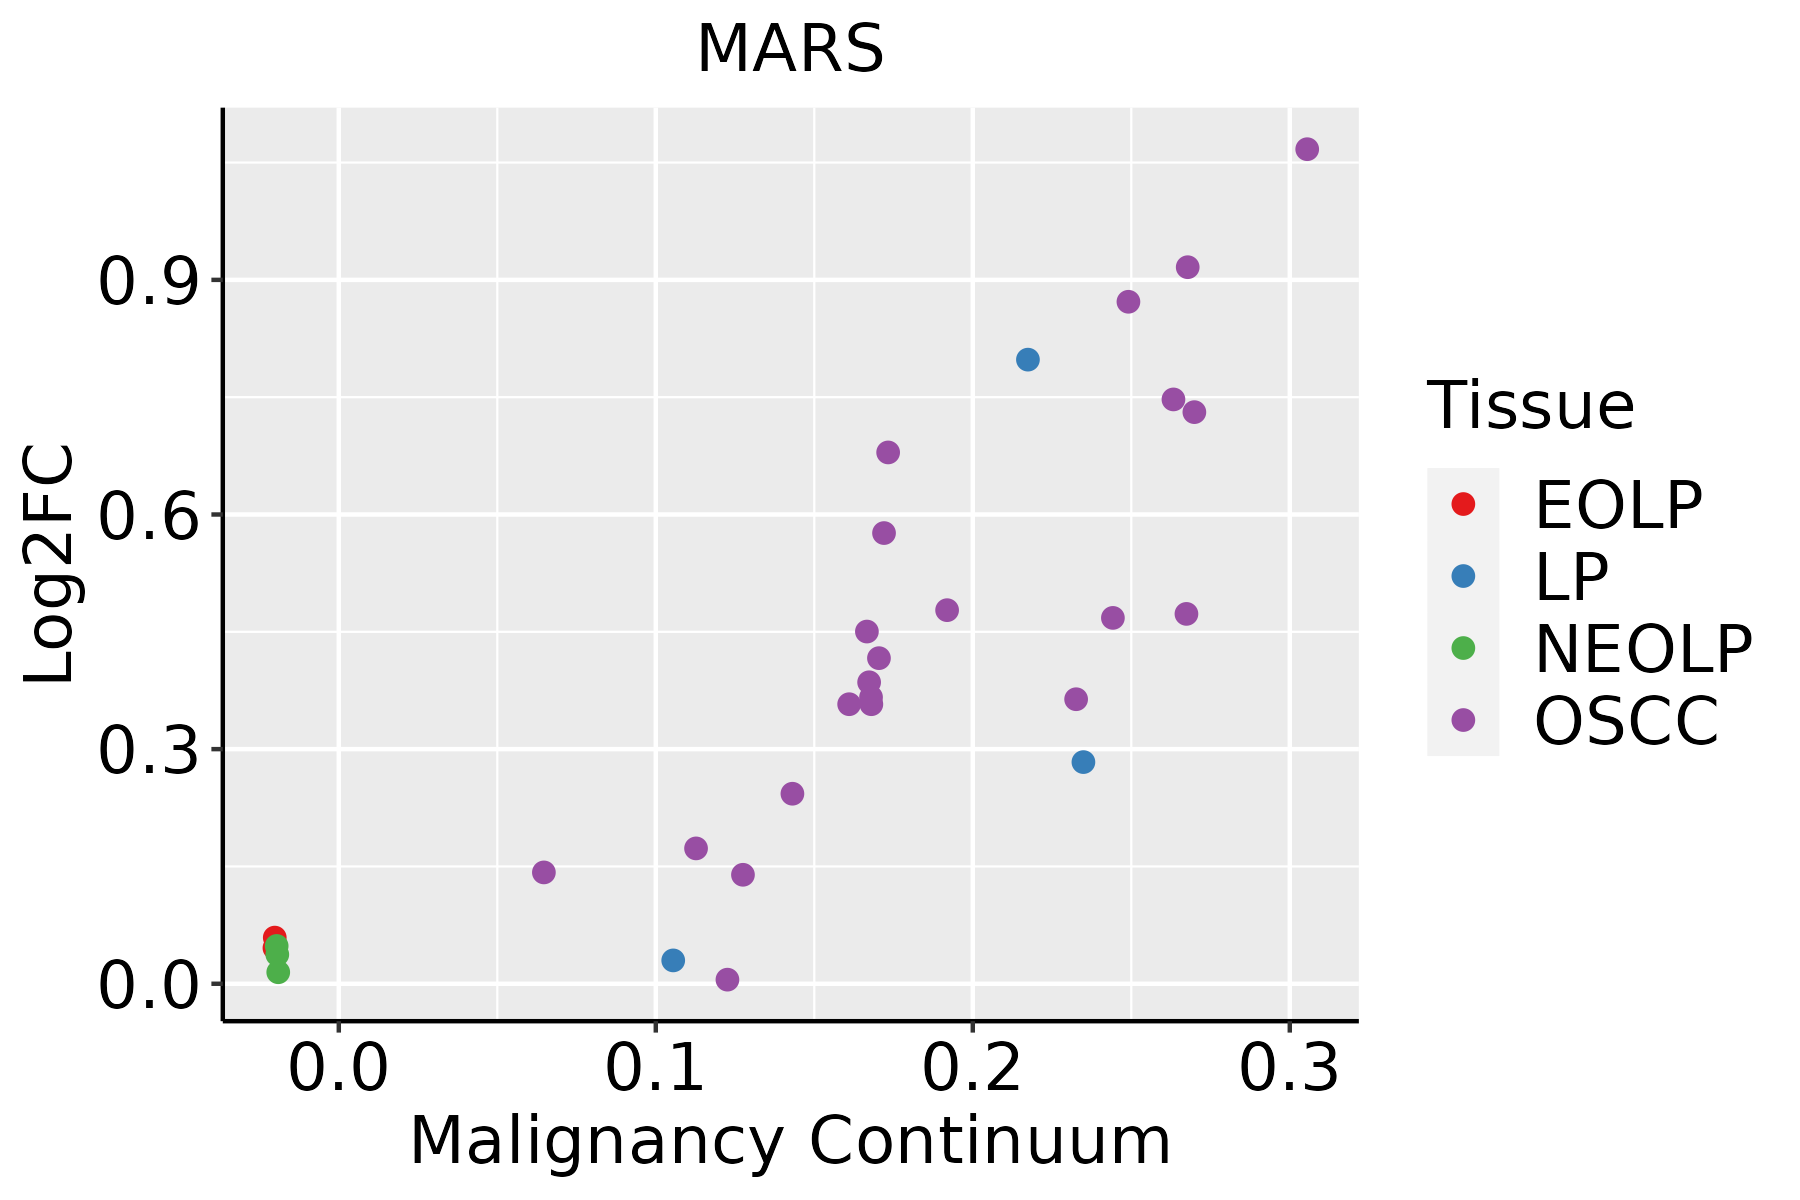 | EOLP: Erosive Oral lichen planus |
| LP: leukoplakia | ||
| NEOLP: Non-erosive oral lichen planus | ||
| OSCC: Oral squamous cell carcinoma | ||
| Skin | 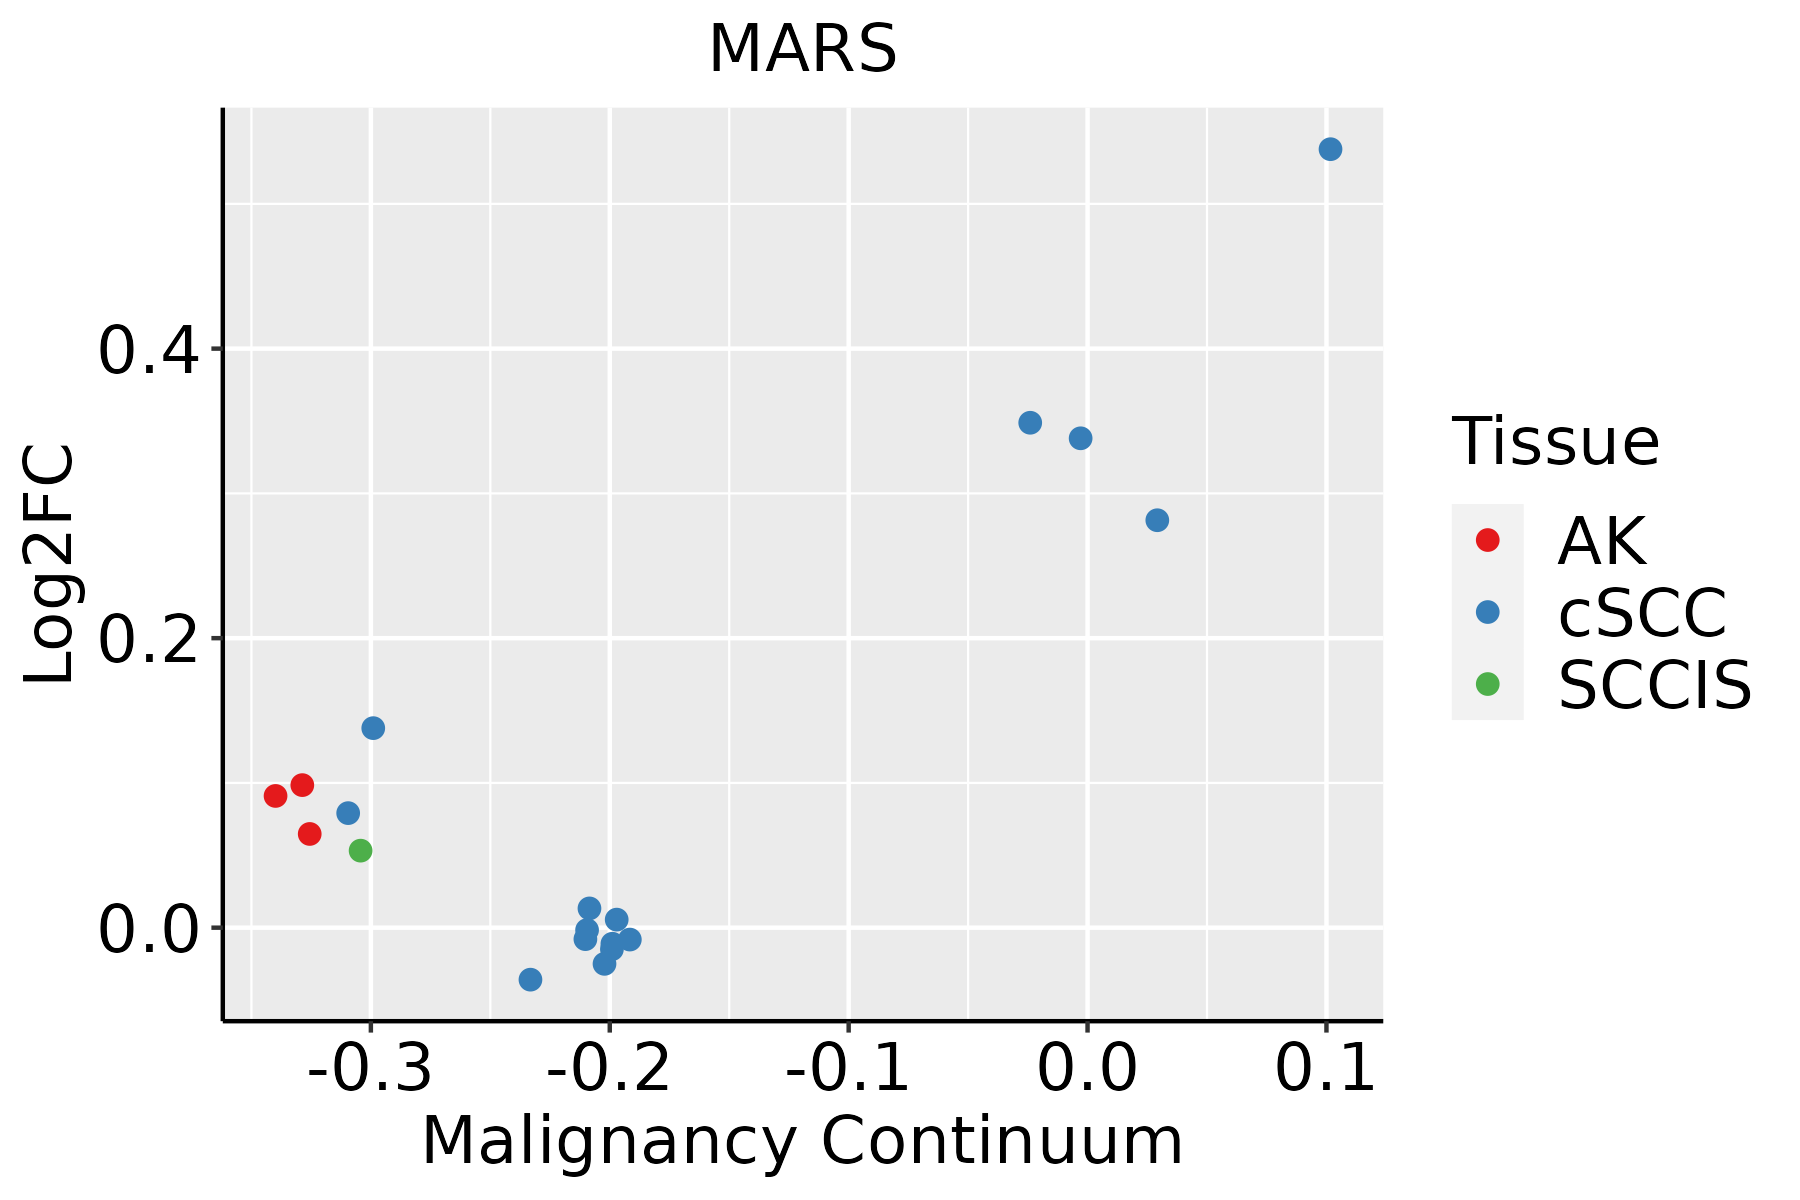 | AK: Actinic keratosis |
| cSCC: Cutaneous squamous cell carcinoma | ||
| SCCIS:squamous cell carcinoma in situ | ||
| Thyroid |  | ATC: Anaplastic thyroid cancer |
| HT: Hashimoto's thyroiditis | ||
| PTC: Papillary thyroid cancer |
| ∗log2FC in expression of this searched gene in stem-like cells from each diseased tissue sample relative to stem-like cells in normal samples in each tissue plotted against the malignancy continuum. Samples are colored based on if they are from different disease stage. |
Top |
Malignant transformation related pathway analysis |
| Find out the enriched GO biological processes and KEGG pathways involved in transition from healthy to precancer to cancer |
| Tissue | Disease Stage | Enriched GO biological Processes |
| Colorectum | AD |  |
| Colorectum | SER |  |
| Colorectum | MSS |  |
| Colorectum | MSI-H |  |
| Colorectum | FAP |  |
| ∗Top 15 enriched GO BP terms are showed in the bar plot of each disease state in each tissue. Each row represents a significant GO biological process which is colored according to the -log10(p.adjust). |
| Page: 1 2 3 4 5 6 7 8 9 |
| GO ID | Tissue | Disease Stage | Description | Gene Ratio | Bg Ratio | pvalue | p.adjust | Count |
| GO:003466012 | Esophagus | ESCC | ncRNA metabolic process | 346/8552 | 485/18723 | 4.35e-31 | 2.51e-28 | 346 |
| GO:00063992 | Esophagus | ESCC | tRNA metabolic process | 122/8552 | 179/18723 | 9.03e-10 | 2.19e-08 | 122 |
| Page: 1 |
| Pathway ID | Tissue | Disease Stage | Description | Gene Ratio | Bg Ratio | pvalue | p.adjust | qvalue | Count |
| Page: 1 |
Top |
Cell-cell communication analysis |
| Identification of potential cell-cell interactions between two cell types and their ligand-receptor pairs for different disease states |
| Ligand | Receptor | LRpair | Pathway | Tissue | Disease Stage |
| Page: 1 |
Top |
Single-cell gene regulatory network inference analysis |
| Find out the significant the regulons (TFs) and the target genes of each regulon across cell types for different disease states |
| TF | Cell Type | Tissue | Disease Stage | Target Gene | RSS | Regulon Activity |
| ∗The dot plots of a searched regulon are shown for all cell subpopulations in each disease state of each tissue based on the regulon specific score inferred using pySCENIC and by calculating the average expression. |
| Page: 1 |
Top |
Somatic mutation of malignant transformation related genes |
| Annotation of somatic variants for genes involved in malignant transformation |
| Hugo Symbol | Variant Class | Variant Classification | dbSNP RS | HGVSc | HGVSp | HGVSp Short | SWISSPROT | BIOTYPE | SIFT | PolyPhen | Tumor Sample Barcode | Tissue | Histology | Sex | Age | Stage | Therapy Types | Drugs | Outcome |
| MARS | SNV | Missense_Mutation | c.2422N>C | p.Asp808His | p.D808H | P56192 | protein_coding | tolerated(0.1) | benign(0.092) | TCGA-A2-A0D2-01 | Breast | breast invasive carcinoma | Female | <65 | I/II | Chemotherapy | adriamycin | SD | |
| MARS | SNV | Missense_Mutation | c.106N>C | p.Glu36Gln | p.E36Q | P56192 | protein_coding | tolerated(0.11) | possibly_damaging(0.563) | TCGA-AC-A23H-01 | Breast | breast invasive carcinoma | Female | >=65 | I/II | Unknown | Unknown | PD | |
| MARS | SNV | Missense_Mutation | c.2079N>G | p.His693Gln | p.H693Q | P56192 | protein_coding | tolerated(0.06) | benign(0) | TCGA-AC-A23H-01 | Breast | breast invasive carcinoma | Female | >=65 | I/II | Unknown | Unknown | PD | |
| MARS | SNV | Missense_Mutation | c.634N>A | p.Glu212Lys | p.E212K | P56192 | protein_coding | tolerated(0.78) | benign(0.005) | TCGA-AC-A2B8-01 | Breast | breast invasive carcinoma | Female | >=65 | I/II | Chemotherapy | chemo | PD | |
| MARS | SNV | Missense_Mutation | c.383T>C | p.Leu128Ser | p.L128S | P56192 | protein_coding | deleterious(0.01) | probably_damaging(0.974) | TCGA-AO-A128-01 | Breast | breast invasive carcinoma | Female | <65 | I/II | Chemotherapy | doxorubicin | SD | |
| MARS | SNV | Missense_Mutation | c.2189N>A | p.Gly730Asp | p.G730D | P56192 | protein_coding | deleterious(0) | probably_damaging(0.951) | TCGA-D8-A1XT-01 | Breast | breast invasive carcinoma | Female | <65 | I/II | Chemotherapy | adriamycin+cyclophosphamide | SD | |
| MARS | SNV | Missense_Mutation | novel | c.2635N>G | p.Leu879Val | p.L879V | P56192 | protein_coding | deleterious(0) | probably_damaging(0.989) | TCGA-HN-A2NL-01 | Breast | breast invasive carcinoma | Female | <65 | I/II | Chemotherapy | cyclophosphamide | SD |
| MARS | insertion | Frame_Shift_Ins | novel | c.1265_1266insCTACTTTTTTAGTAGAGACGGGGTTTTACCATGTTGGC | p.Lys423TyrfsTer86 | p.K423Yfs*86 | P56192 | protein_coding | TCGA-BH-A0AY-01 | Breast | breast invasive carcinoma | Female | <65 | I/II | Chemotherapy | SD | |||
| MARS | SNV | Missense_Mutation | novel | c.1213N>C | p.Cys405Arg | p.C405R | P56192 | protein_coding | deleterious(0) | probably_damaging(1) | TCGA-2W-A8YY-01 | Cervix | cervical & endocervical cancer | Female | <65 | I/II | Chemotherapy | cisplatin | CR |
| MARS | SNV | Missense_Mutation | novel | c.2501N>G | p.Val834Gly | p.V834G | P56192 | protein_coding | tolerated(0.27) | benign(0) | TCGA-2W-A8YY-01 | Cervix | cervical & endocervical cancer | Female | <65 | I/II | Chemotherapy | cisplatin | CR |
| Page: 1 2 3 4 5 6 7 8 9 |
Top |
Related drugs of malignant transformation related genes |
| Identification of chemicals and drugs interact with genes involved in malignant transfromation |
| (DGIdb 4.0) |
| Entrez ID | Symbol | Category | Interaction Types | Drug Claim Name | Drug Name | PMIDs |
| Page: 1 |

Copyright 2023-Present -The University of Texas Health Science Center at Houston |