
|
|||||
|
 | |
| |
| |
| |
| |
| |
|
Gene: MARK4 |
Gene summary for MARK4 |
| Gene information | Species | Human | Gene symbol | MARK4 | Gene ID | 57787 |
| Gene name | microtubule affinity regulating kinase 4 | |
| Gene Alias | MARK4L | |
| Cytomap | 19q13.32 | |
| Gene Type | protein-coding | GO ID | GO:0000226 | UniProtAcc | Q96L34 |
Top |
Malignant transformation analysis |
| Identification of the aberrant gene expression in precancerous and cancerous lesions by comparing the gene expression of stem-like cells in diseased tissues with normal stem cells |
| Entrez ID | Symbol | Replicates | Species | Organ | Tissue | Adj P-value | Log2FC | Malignancy |
| 57787 | MARK4 | NAFLD1 | Human | Liver | NAFLD | 5.29e-05 | 5.62e-01 | -0.04 |
| 57787 | MARK4 | HCC1_Meng | Human | Liver | HCC | 1.09e-24 | -1.22e-02 | 0.0246 |
| 57787 | MARK4 | HCC2_Meng | Human | Liver | HCC | 4.24e-07 | 1.90e-02 | 0.0107 |
| 57787 | MARK4 | S014 | Human | Liver | HCC | 1.59e-02 | 2.48e-01 | 0.2254 |
| 57787 | MARK4 | S015 | Human | Liver | HCC | 6.53e-07 | 4.73e-01 | 0.2375 |
| 57787 | MARK4 | S027 | Human | Liver | HCC | 1.01e-03 | 5.47e-01 | 0.2446 |
| 57787 | MARK4 | S028 | Human | Liver | HCC | 5.49e-09 | 4.24e-01 | 0.2503 |
| 57787 | MARK4 | S029 | Human | Liver | HCC | 1.26e-05 | 3.94e-01 | 0.2581 |
| 57787 | MARK4 | C04 | Human | Oral cavity | OSCC | 3.60e-09 | 4.75e-01 | 0.2633 |
| 57787 | MARK4 | C21 | Human | Oral cavity | OSCC | 1.79e-04 | 2.11e-01 | 0.2678 |
| 57787 | MARK4 | C30 | Human | Oral cavity | OSCC | 4.11e-28 | 9.05e-01 | 0.3055 |
| 57787 | MARK4 | C38 | Human | Oral cavity | OSCC | 6.66e-03 | 5.47e-01 | 0.172 |
| 57787 | MARK4 | C43 | Human | Oral cavity | OSCC | 1.26e-09 | 1.53e-01 | 0.1704 |
| 57787 | MARK4 | C46 | Human | Oral cavity | OSCC | 2.09e-03 | 1.25e-01 | 0.1673 |
| 57787 | MARK4 | C51 | Human | Oral cavity | OSCC | 1.08e-05 | 3.15e-01 | 0.2674 |
| 57787 | MARK4 | C57 | Human | Oral cavity | OSCC | 4.30e-03 | 1.62e-01 | 0.1679 |
| 57787 | MARK4 | C08 | Human | Oral cavity | OSCC | 1.92e-10 | 1.83e-01 | 0.1919 |
| 57787 | MARK4 | SYSMH1 | Human | Oral cavity | OSCC | 5.96e-06 | 1.86e-01 | 0.1127 |
| 57787 | MARK4 | SYSMH2 | Human | Oral cavity | OSCC | 3.36e-14 | 2.16e-01 | 0.2326 |
| 57787 | MARK4 | SYSMH3 | Human | Oral cavity | OSCC | 1.41e-11 | 3.12e-01 | 0.2442 |
| Page: 1 2 |
| Tissue | Expression Dynamics | Abbreviation |
| Liver | 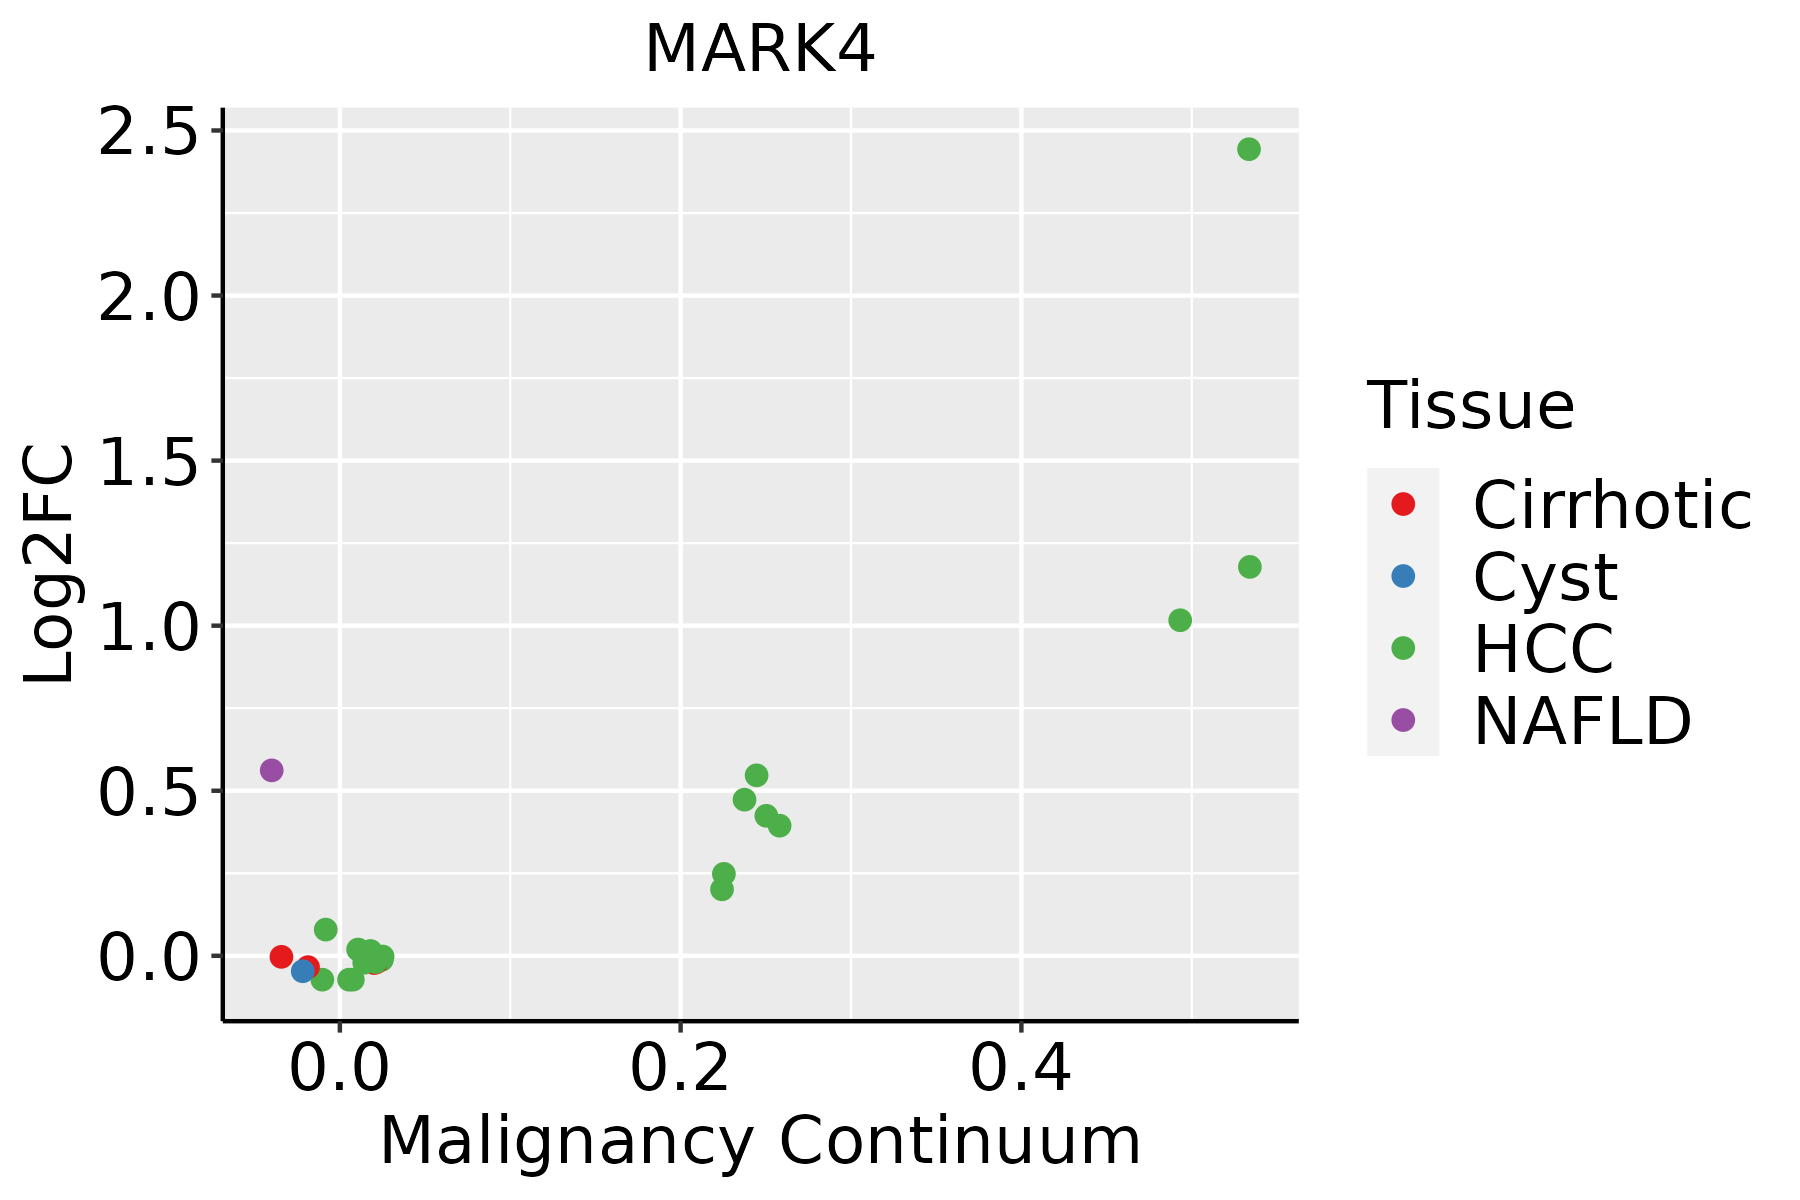 | HCC: Hepatocellular carcinoma |
| NAFLD: Non-alcoholic fatty liver disease | ||
| Oral Cavity | 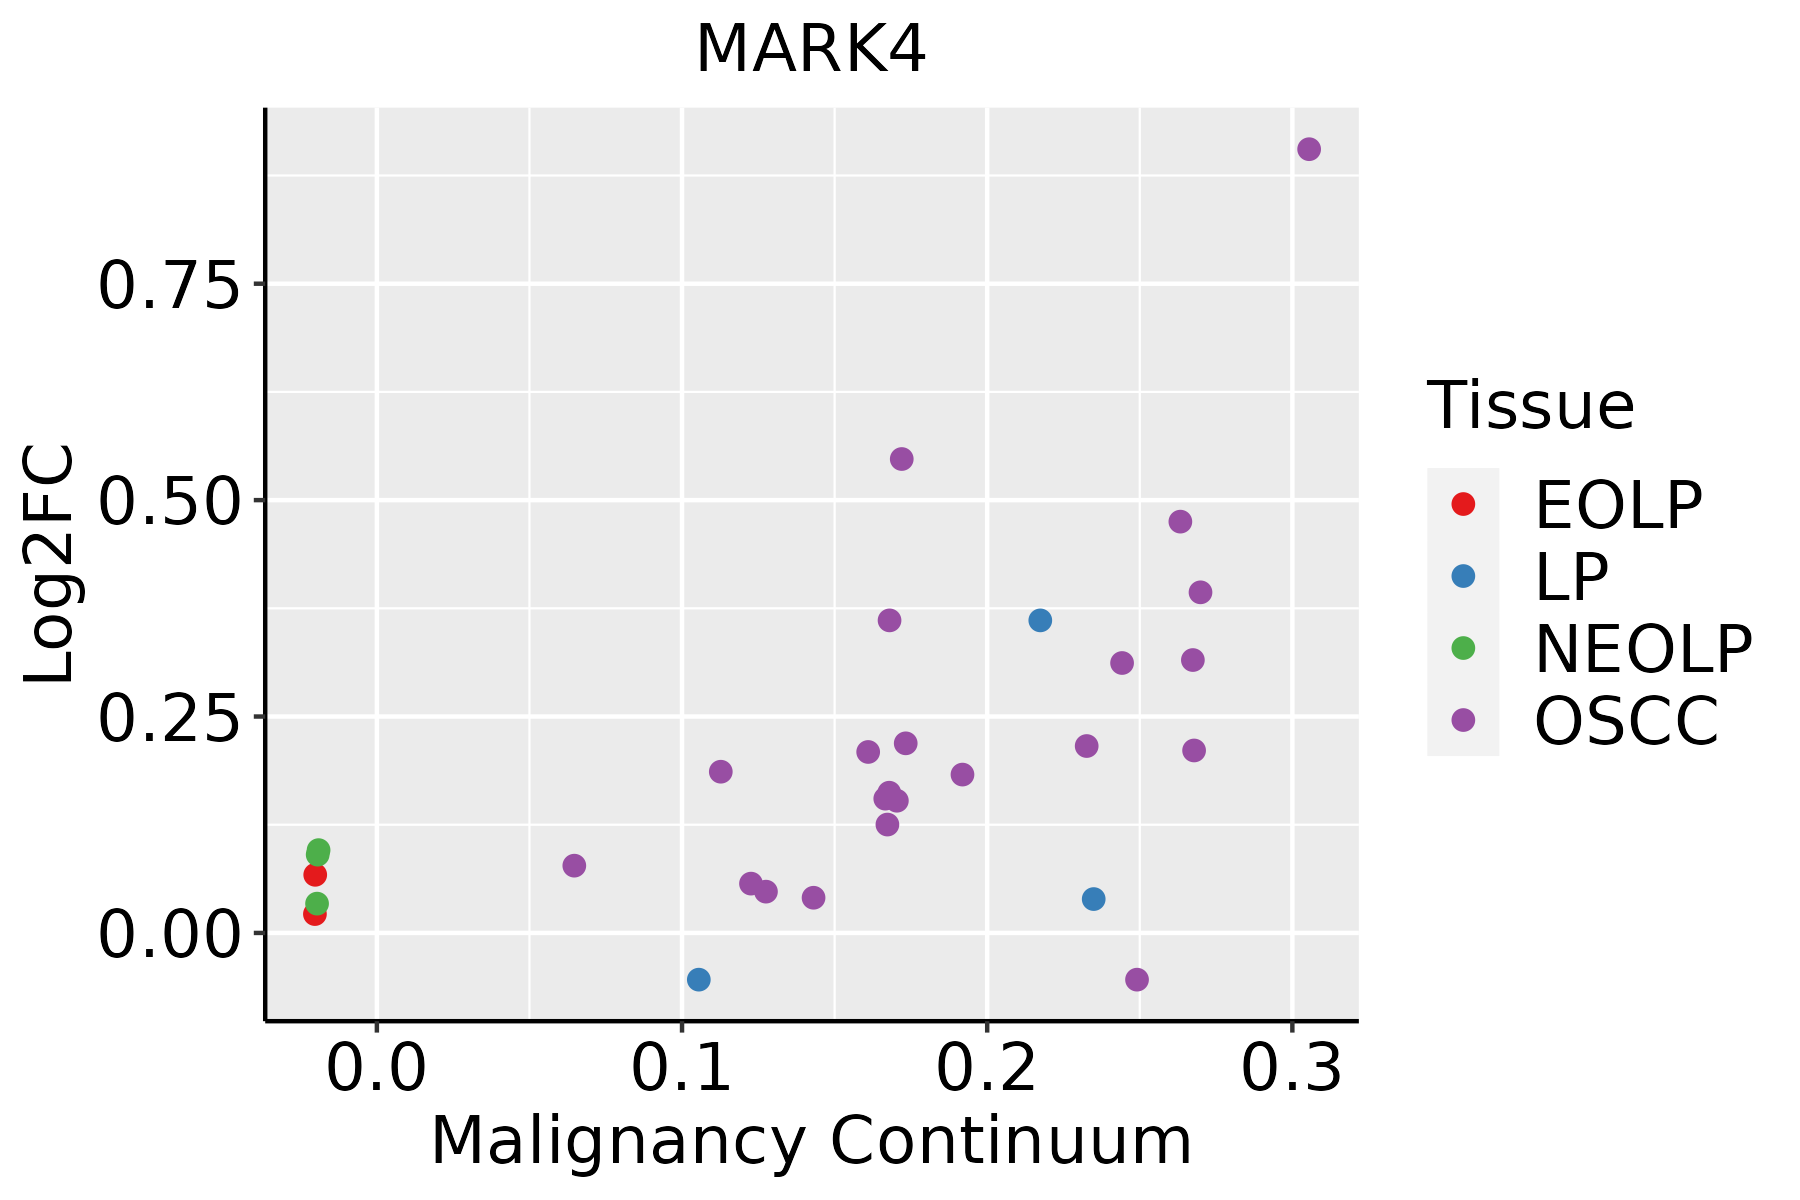 | EOLP: Erosive Oral lichen planus |
| LP: leukoplakia | ||
| NEOLP: Non-erosive oral lichen planus | ||
| OSCC: Oral squamous cell carcinoma |
| ∗log2FC in expression of this searched gene in stem-like cells from each diseased tissue sample relative to stem-like cells in normal samples in each tissue plotted against the malignancy continuum. Samples are colored based on if they are from different disease stage. |
Top |
Malignant transformation related pathway analysis |
| Find out the enriched GO biological processes and KEGG pathways involved in transition from healthy to precancer to cancer |
| Tissue | Disease Stage | Enriched GO biological Processes |
| Colorectum | AD |  |
| Colorectum | SER |  |
| Colorectum | MSS |  |
| Colorectum | MSI-H |  |
| Colorectum | FAP |  |
| ∗Top 15 enriched GO BP terms are showed in the bar plot of each disease state in each tissue. Each row represents a significant GO biological process which is colored according to the -log10(p.adjust). |
| Page: 1 2 3 4 5 6 7 8 9 |
| GO ID | Tissue | Disease Stage | Description | Gene Ratio | Bg Ratio | pvalue | p.adjust | Count |
| GO:00313465 | Liver | NAFLD | positive regulation of cell projection organization | 57/1882 | 353/18723 | 2.19e-04 | 3.73e-03 | 57 |
| GO:00715394 | Liver | NAFLD | protein localization to centrosome | 10/1882 | 33/18723 | 1.09e-03 | 1.27e-02 | 10 |
| GO:19055084 | Liver | NAFLD | protein localization to microtubule organizing center | 10/1882 | 35/18723 | 1.79e-03 | 1.85e-02 | 10 |
| GO:00726983 | Liver | NAFLD | protein localization to microtubule cytoskeleton | 12/1882 | 54/18723 | 6.44e-03 | 4.69e-02 | 12 |
| GO:19038297 | Liver | NAFLD | positive regulation of cellular protein localization | 41/1882 | 276/18723 | 7.11e-03 | 4.95e-02 | 41 |
| GO:190382922 | Liver | HCC | positive regulation of cellular protein localization | 199/7958 | 276/18723 | 1.15e-23 | 2.62e-21 | 199 |
| GO:003134611 | Liver | HCC | positive regulation of cell projection organization | 193/7958 | 353/18723 | 2.28e-06 | 3.08e-05 | 193 |
| GO:19021151 | Liver | HCC | regulation of organelle assembly | 110/7958 | 186/18723 | 3.30e-06 | 4.34e-05 | 110 |
| GO:0031023 | Liver | HCC | microtubule organizing center organization | 82/7958 | 143/18723 | 2.38e-04 | 1.79e-03 | 82 |
| GO:0007098 | Liver | HCC | centrosome cycle | 75/7958 | 130/18723 | 3.33e-04 | 2.34e-03 | 75 |
| GO:00443802 | Liver | HCC | protein localization to cytoskeleton | 38/7958 | 58/18723 | 3.37e-04 | 2.36e-03 | 38 |
| GO:007269811 | Liver | HCC | protein localization to microtubule cytoskeleton | 35/7958 | 54/18723 | 7.73e-04 | 4.65e-03 | 35 |
| GO:006049112 | Liver | HCC | regulation of cell projection assembly | 101/7958 | 188/18723 | 1.20e-03 | 6.69e-03 | 101 |
| GO:012003212 | Liver | HCC | regulation of plasma membrane bounded cell projection assembly | 100/7958 | 186/18723 | 1.23e-03 | 6.81e-03 | 100 |
| GO:1902117 | Liver | HCC | positive regulation of organelle assembly | 41/7958 | 67/18723 | 1.55e-03 | 8.20e-03 | 41 |
| GO:0032886 | Liver | HCC | regulation of microtubule-based process | 123/7958 | 240/18723 | 3.69e-03 | 1.64e-02 | 123 |
| GO:190550811 | Liver | HCC | protein localization to microtubule organizing center | 23/7958 | 35/18723 | 4.72e-03 | 2.02e-02 | 23 |
| GO:01200344 | Liver | HCC | positive regulation of plasma membrane bounded cell projection assembly | 58/7958 | 105/18723 | 5.66e-03 | 2.36e-02 | 58 |
| GO:00466052 | Liver | HCC | regulation of centrosome cycle | 30/7958 | 49/18723 | 6.31e-03 | 2.57e-02 | 30 |
| GO:007153911 | Liver | HCC | protein localization to centrosome | 21/7958 | 33/18723 | 1.16e-02 | 4.28e-02 | 21 |
| Page: 1 2 |
| Pathway ID | Tissue | Disease Stage | Description | Gene Ratio | Bg Ratio | pvalue | p.adjust | qvalue | Count |
| Page: 1 |
Top |
Cell-cell communication analysis |
| Identification of potential cell-cell interactions between two cell types and their ligand-receptor pairs for different disease states |
| Ligand | Receptor | LRpair | Pathway | Tissue | Disease Stage |
| Page: 1 |
Top |
Single-cell gene regulatory network inference analysis |
| Find out the significant the regulons (TFs) and the target genes of each regulon across cell types for different disease states |
| TF | Cell Type | Tissue | Disease Stage | Target Gene | RSS | Regulon Activity |
| ∗The dot plots of a searched regulon are shown for all cell subpopulations in each disease state of each tissue based on the regulon specific score inferred using pySCENIC and by calculating the average expression. |
| Page: 1 |
Top |
Somatic mutation of malignant transformation related genes |
| Annotation of somatic variants for genes involved in malignant transformation |
| Hugo Symbol | Variant Class | Variant Classification | dbSNP RS | HGVSc | HGVSp | HGVSp Short | SWISSPROT | BIOTYPE | SIFT | PolyPhen | Tumor Sample Barcode | Tissue | Histology | Sex | Age | Stage | Therapy Types | Drugs | Outcome |
| MARK4 | SNV | Missense_Mutation | novel | c.465N>C | p.Glu155Asp | p.E155D | Q96L34 | protein_coding | deleterious(0.01) | benign(0.125) | TCGA-5L-AAT1-01 | Breast | breast invasive carcinoma | Female | <65 | III/IV | Hormone Therapy | letrozol | SD |
| MARK4 | SNV | Missense_Mutation | rs754507921 | c.151N>A | p.Glu51Lys | p.E51K | Q96L34 | protein_coding | deleterious(0) | benign(0.015) | TCGA-BH-A0B6-01 | Breast | breast invasive carcinoma | Female | <65 | I/II | Unknown | Unknown | SD |
| MARK4 | SNV | Missense_Mutation | novel | c.1148N>A | p.Ala383Asp | p.A383D | Q96L34 | protein_coding | tolerated(0.23) | benign(0.165) | TCGA-BH-A204-01 | Breast | breast invasive carcinoma | Female | >=65 | I/II | Unknown | Unknown | SD |
| MARK4 | insertion | Nonsense_Mutation | novel | c.1001_1002insGGCAGAAGCTGTATGATTTCTGGTTCCTTCTGAC | p.Ile335AlafsTer5 | p.I335Afs*5 | Q96L34 | protein_coding | TCGA-A8-A09D-01 | Breast | breast invasive carcinoma | Female | <65 | I/II | Chemotherapy | doxorubicin | CR | ||
| MARK4 | SNV | Missense_Mutation | novel | c.844N>A | p.Asp282Asn | p.D282N | Q96L34 | protein_coding | deleterious(0) | probably_damaging(0.989) | TCGA-IR-A3LK-01 | Cervix | cervical & endocervical cancer | Female | >=65 | I/II | Chemotherapy | cisplatin | PD |
| MARK4 | SNV | Missense_Mutation | c.1697G>A | p.Arg566His | p.R566H | Q96L34 | protein_coding | deleterious(0) | probably_damaging(0.987) | TCGA-5M-AAT6-01 | Colorectum | colon adenocarcinoma | Female | <65 | III/IV | Unknown | Unknown | PD | |
| MARK4 | SNV | Missense_Mutation | c.22N>T | p.Ala8Ser | p.A8S | Q96L34 | protein_coding | deleterious_low_confidence(0.02) | benign(0) | TCGA-A6-3809-01 | Colorectum | colon adenocarcinoma | Female | >=65 | I/II | Unknown | Unknown | SD | |
| MARK4 | SNV | Missense_Mutation | rs755396651 | c.1253N>A | p.Arg418His | p.R418H | Q96L34 | protein_coding | deleterious(0) | probably_damaging(0.991) | TCGA-AA-3850-01 | Colorectum | colon adenocarcinoma | Male | >=65 | I/II | Unknown | Unknown | PD |
| MARK4 | SNV | Missense_Mutation | c.1563G>T | p.Glu521Asp | p.E521D | Q96L34 | protein_coding | tolerated(1) | benign(0.001) | TCGA-AA-3947-01 | Colorectum | colon adenocarcinoma | Female | <65 | I/II | Unknown | Unknown | SD | |
| MARK4 | SNV | Missense_Mutation | rs745321890 | c.2000C>T | p.Ser667Leu | p.S667L | Q96L34 | protein_coding | deleterious(0.01) | benign(0.028) | TCGA-AA-A00N-01 | Colorectum | colon adenocarcinoma | Male | >=65 | I/II | Unknown | Unknown | PD |
| Page: 1 2 3 4 5 6 7 8 |
Top |
Related drugs of malignant transformation related genes |
| Identification of chemicals and drugs interact with genes involved in malignant transfromation |
| (DGIdb 4.0) |
| Entrez ID | Symbol | Category | Interaction Types | Drug Claim Name | Drug Name | PMIDs |
| 57787 | MARK4 | KINASE, SERINE THREONINE KINASE, DRUGGABLE GENOME, ENZYME | JNJ-7706621 | JNJ-7706621 | ||
| 57787 | MARK4 | KINASE, SERINE THREONINE KINASE, DRUGGABLE GENOME, ENZYME | DOVITINIB | DOVITINIB | ||
| 57787 | MARK4 | KINASE, SERINE THREONINE KINASE, DRUGGABLE GENOME, ENZYME | TAMATINIB | R-406 | ||
| 57787 | MARK4 | KINASE, SERINE THREONINE KINASE, DRUGGABLE GENOME, ENZYME | TOZASERTIB | TOZASERTIB | ||
| 57787 | MARK4 | KINASE, SERINE THREONINE KINASE, DRUGGABLE GENOME, ENZYME | PF-562271 | PF-00562271 | ||
| 57787 | MARK4 | KINASE, SERINE THREONINE KINASE, DRUGGABLE GENOME, ENZYME | inhibitor | HESPERADIN | HESPERADIN | 19035792 |
| Page: 1 |

Copyright 2023-Present -The University of Texas Health Science Center at Houston |