| Tissue | Expression Dynamics | Abbreviation |
| Cervix | 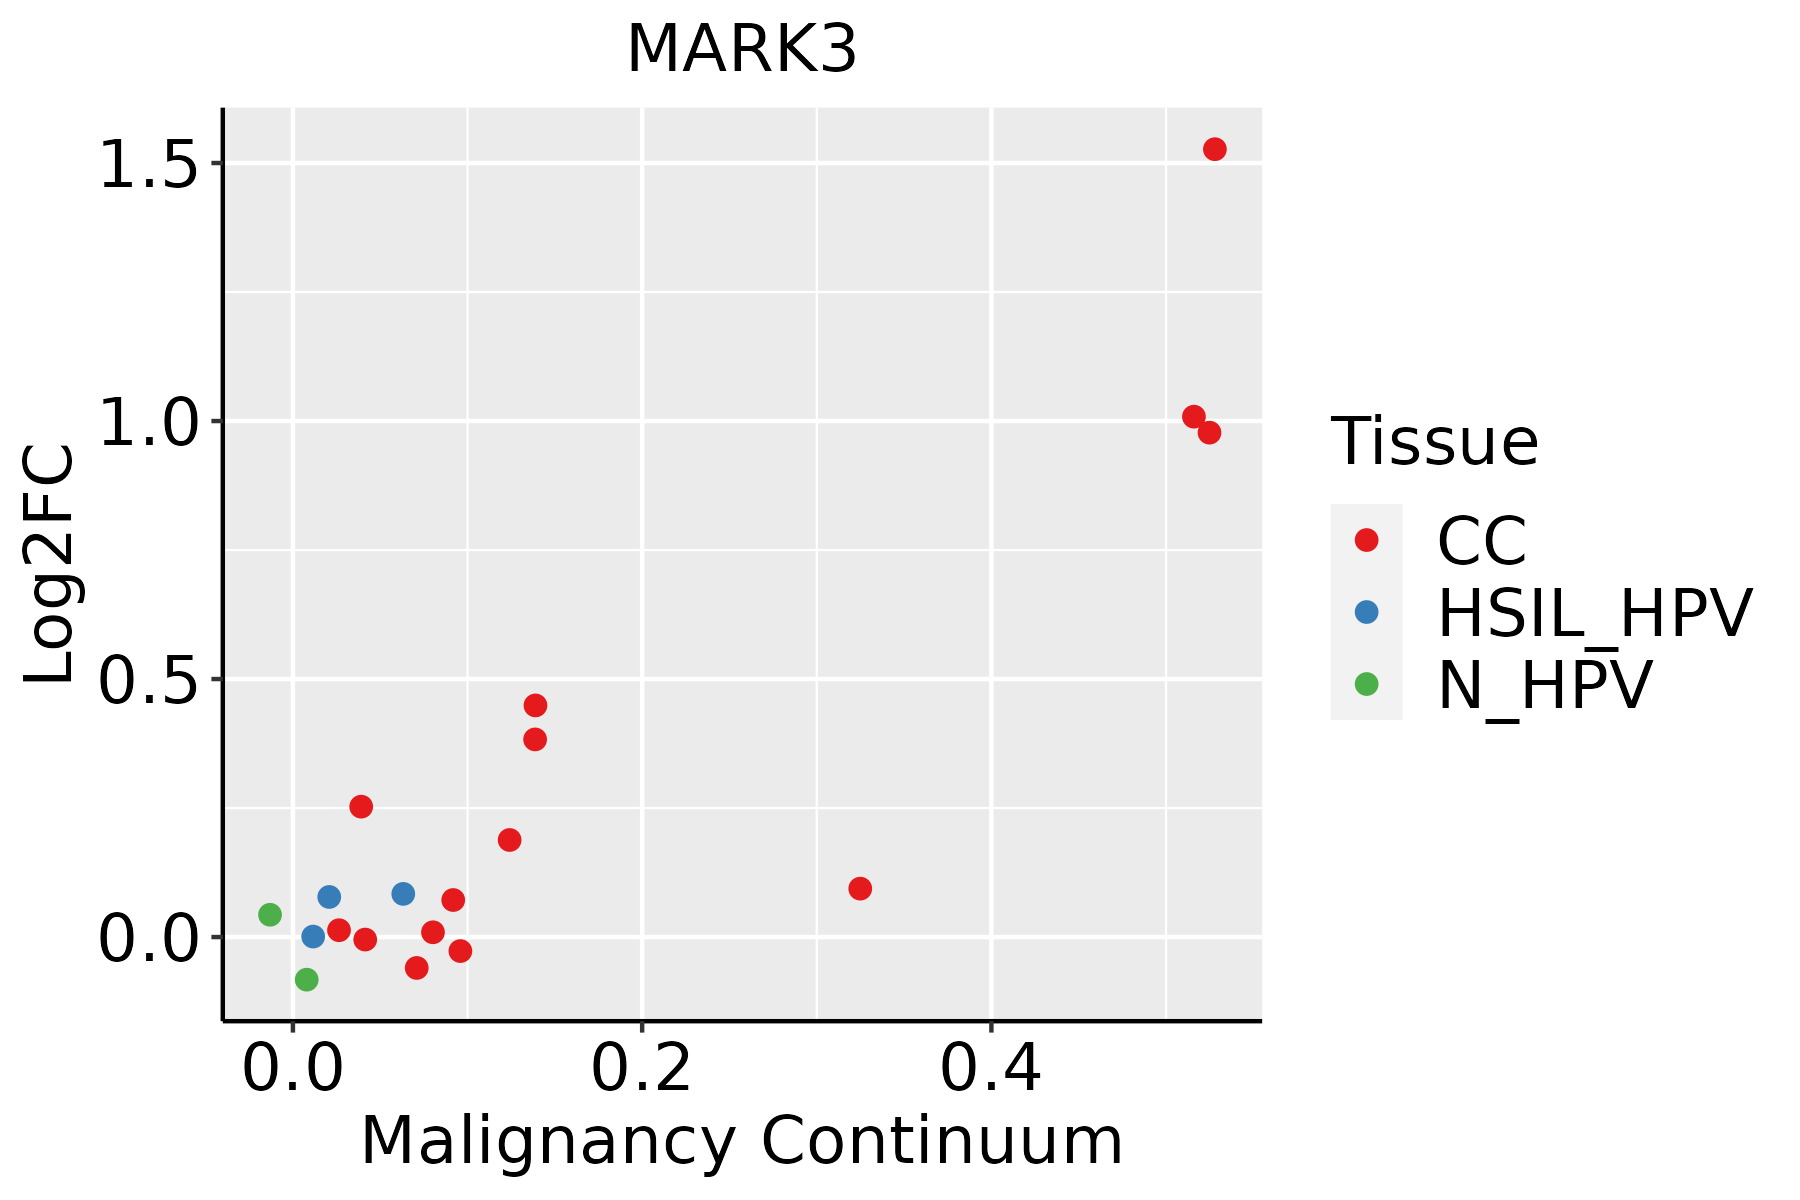 | CC: Cervix cancer |
| HSIL_HPV: HPV-infected high-grade squamous intraepithelial lesions |
| N_HPV: HPV-infected normal cervix |
| Colorectum (GSE201348) |  | FAP: Familial adenomatous polyposis |
| CRC: Colorectal cancer |
| Colorectum (HTA11) |  | AD: Adenomas |
| SER: Sessile serrated lesions |
| MSI-H: Microsatellite-high colorectal cancer |
| MSS: Microsatellite stable colorectal cancer |
| Esophagus | 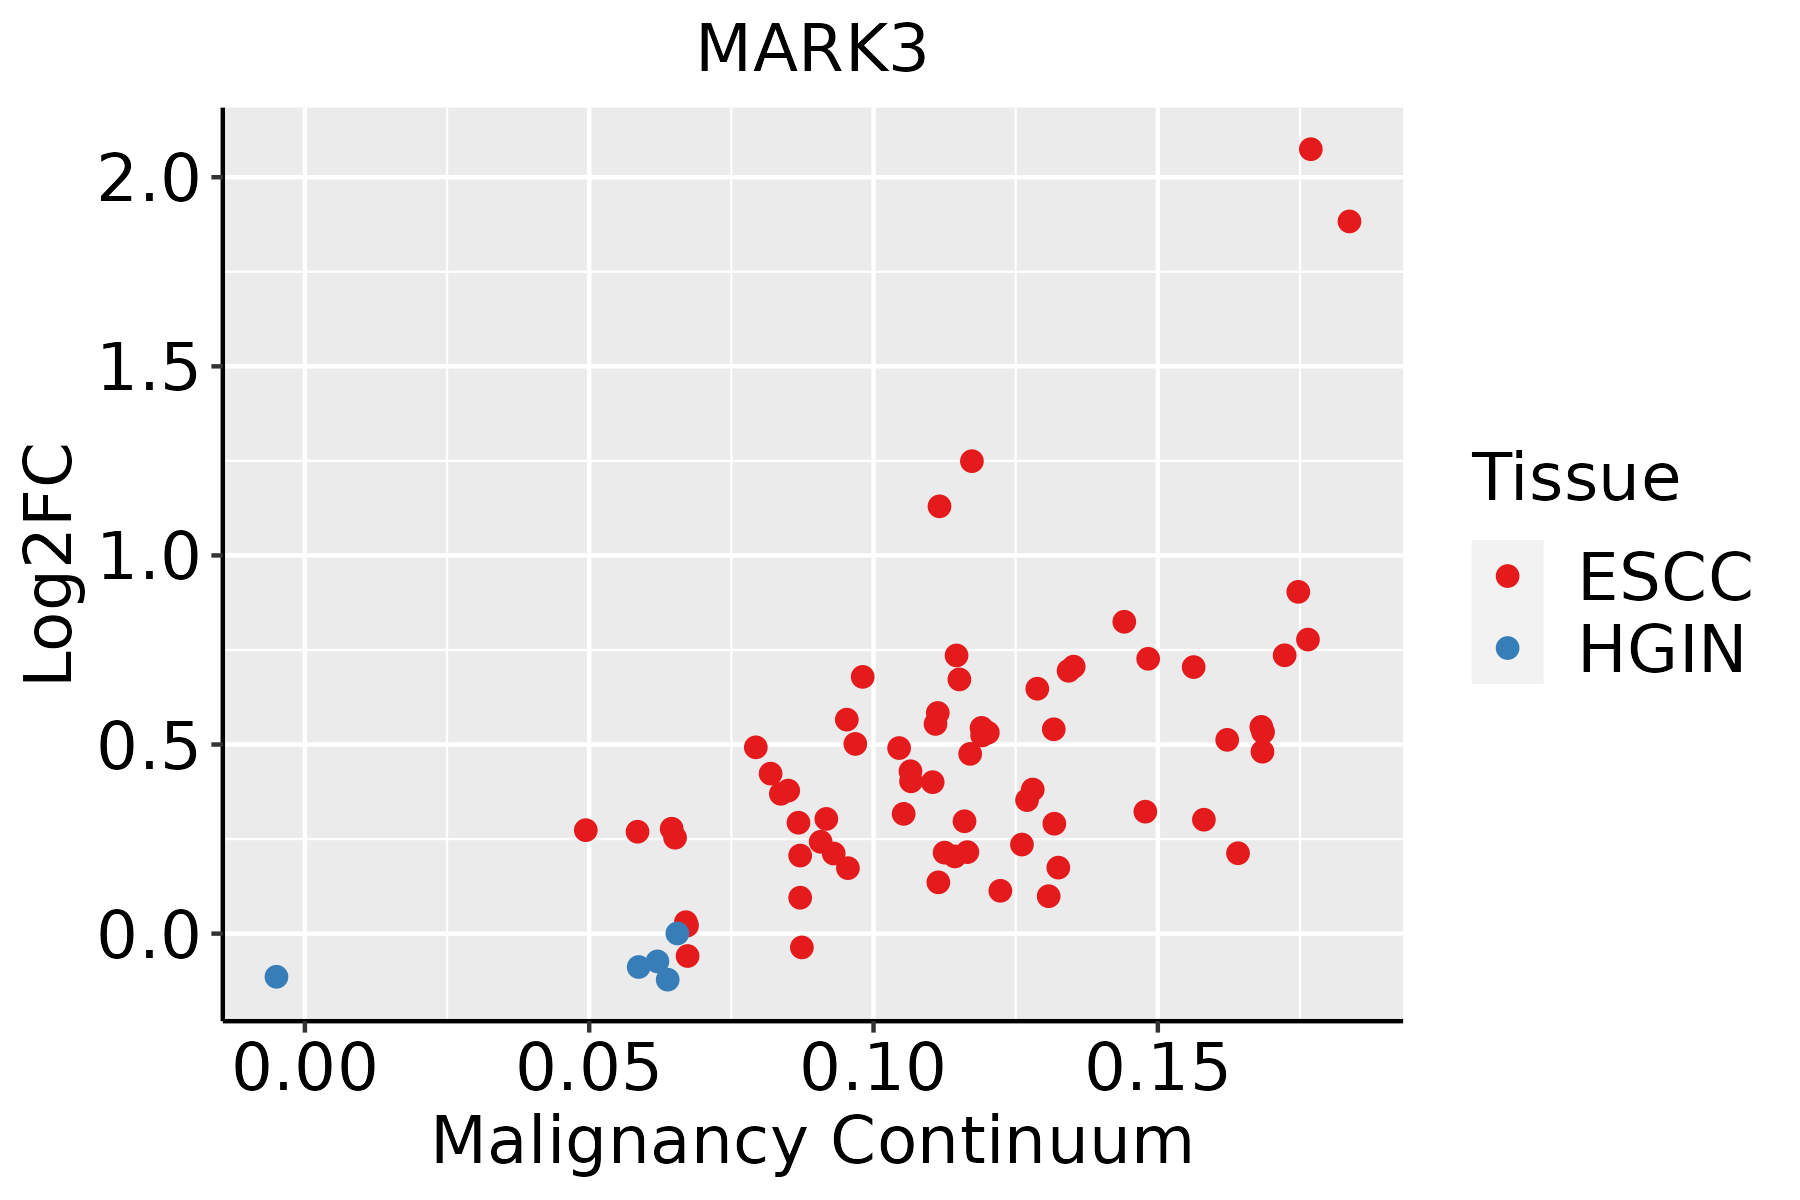 | ESCC: Esophageal squamous cell carcinoma |
| HGIN: High-grade intraepithelial neoplasias |
| LGIN: Low-grade intraepithelial neoplasias |
| Liver | 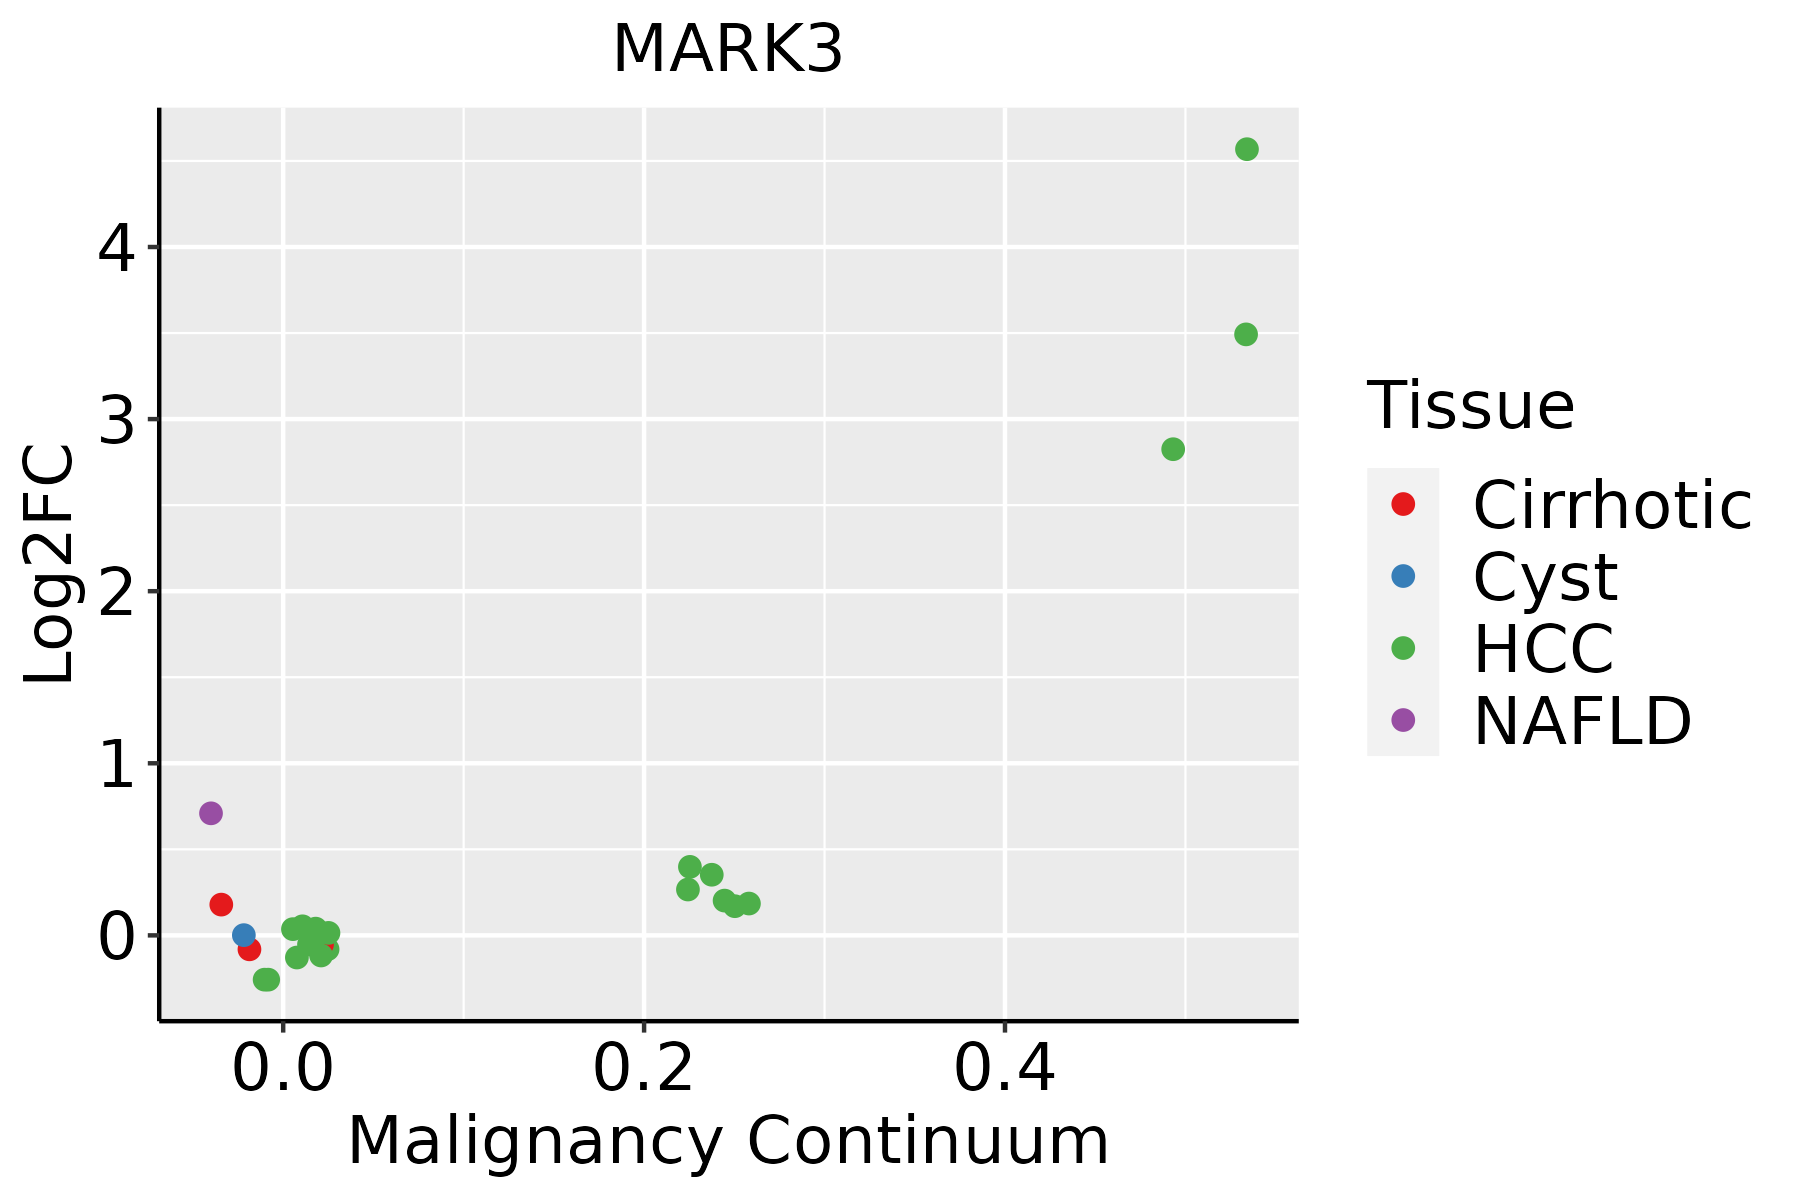 | HCC: Hepatocellular carcinoma |
| NAFLD: Non-alcoholic fatty liver disease |
| Lung | 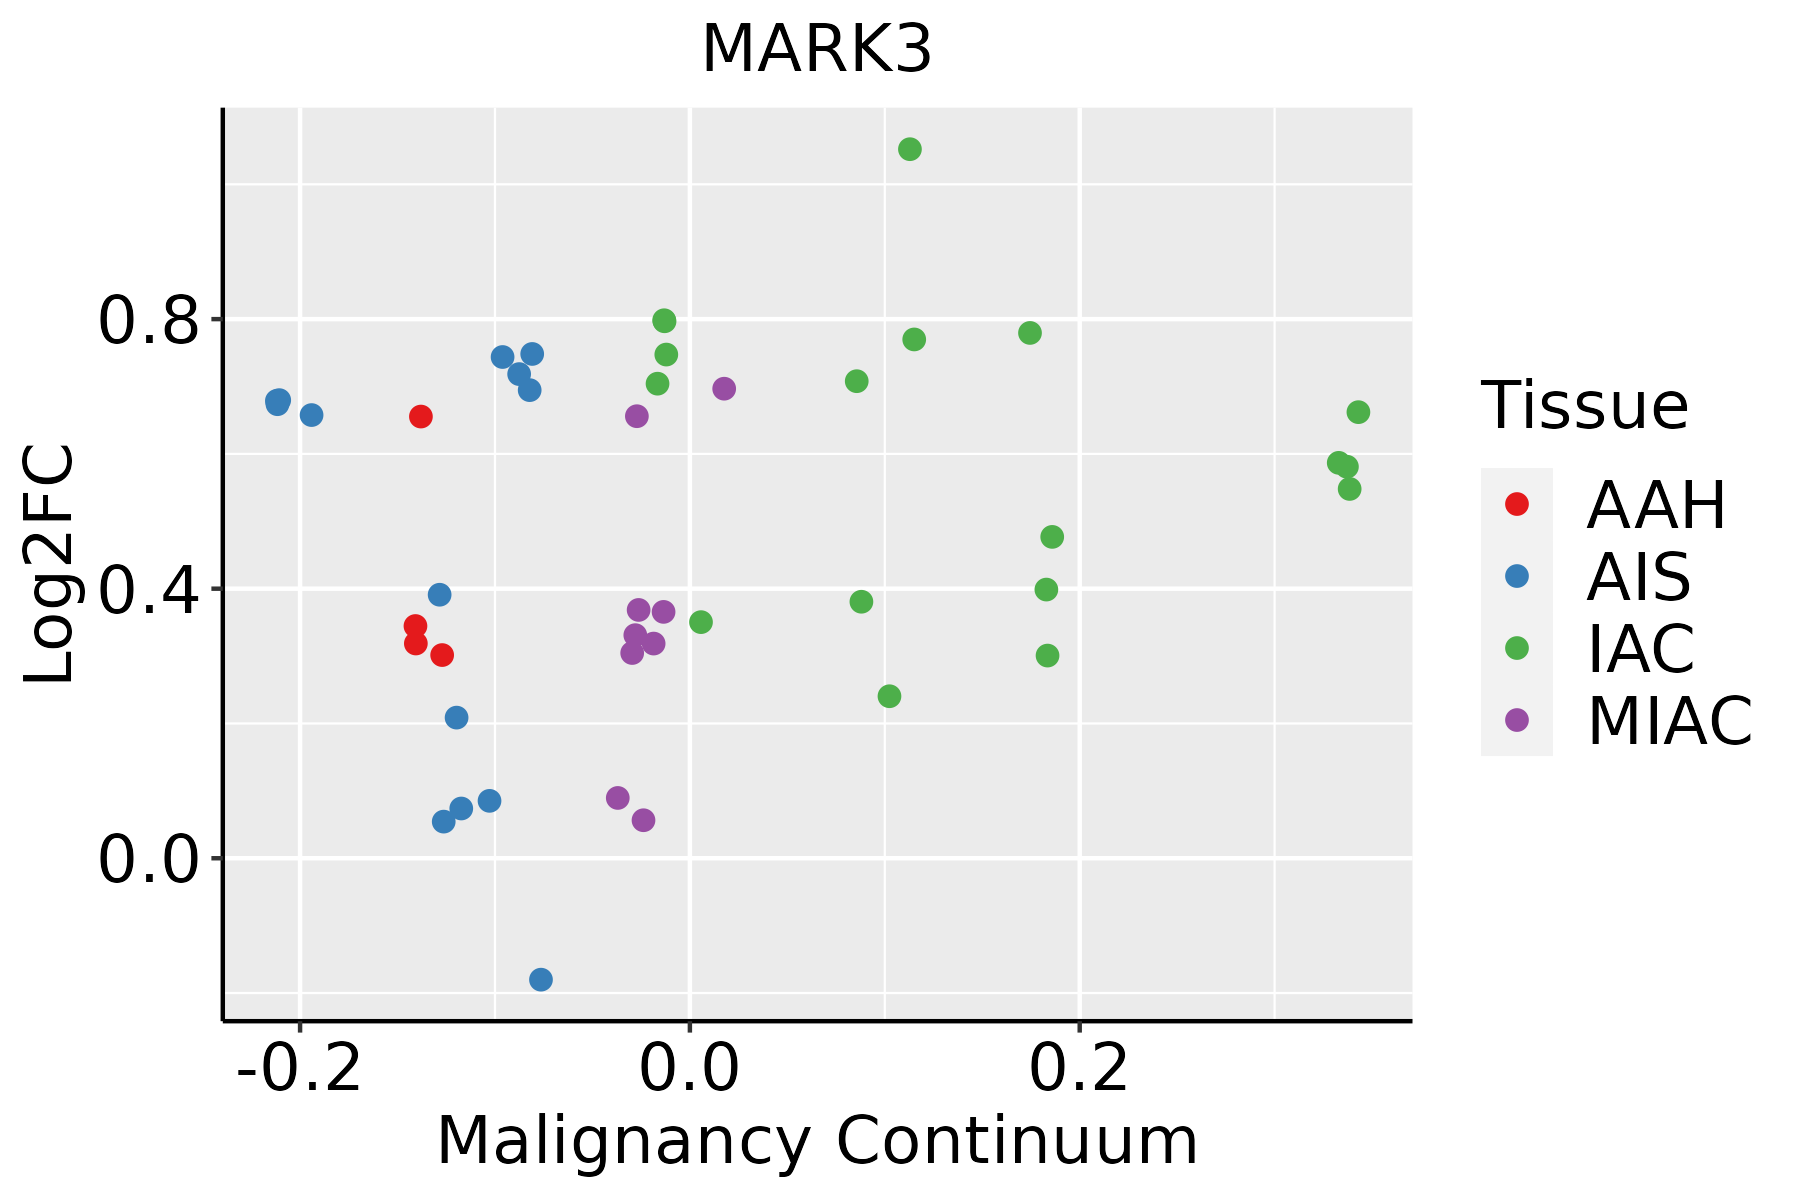 | AAH: Atypical adenomatous hyperplasia |
| AIS: Adenocarcinoma in situ |
| IAC: Invasive lung adenocarcinoma |
| MIA: Minimally invasive adenocarcinoma |
| Oral Cavity | 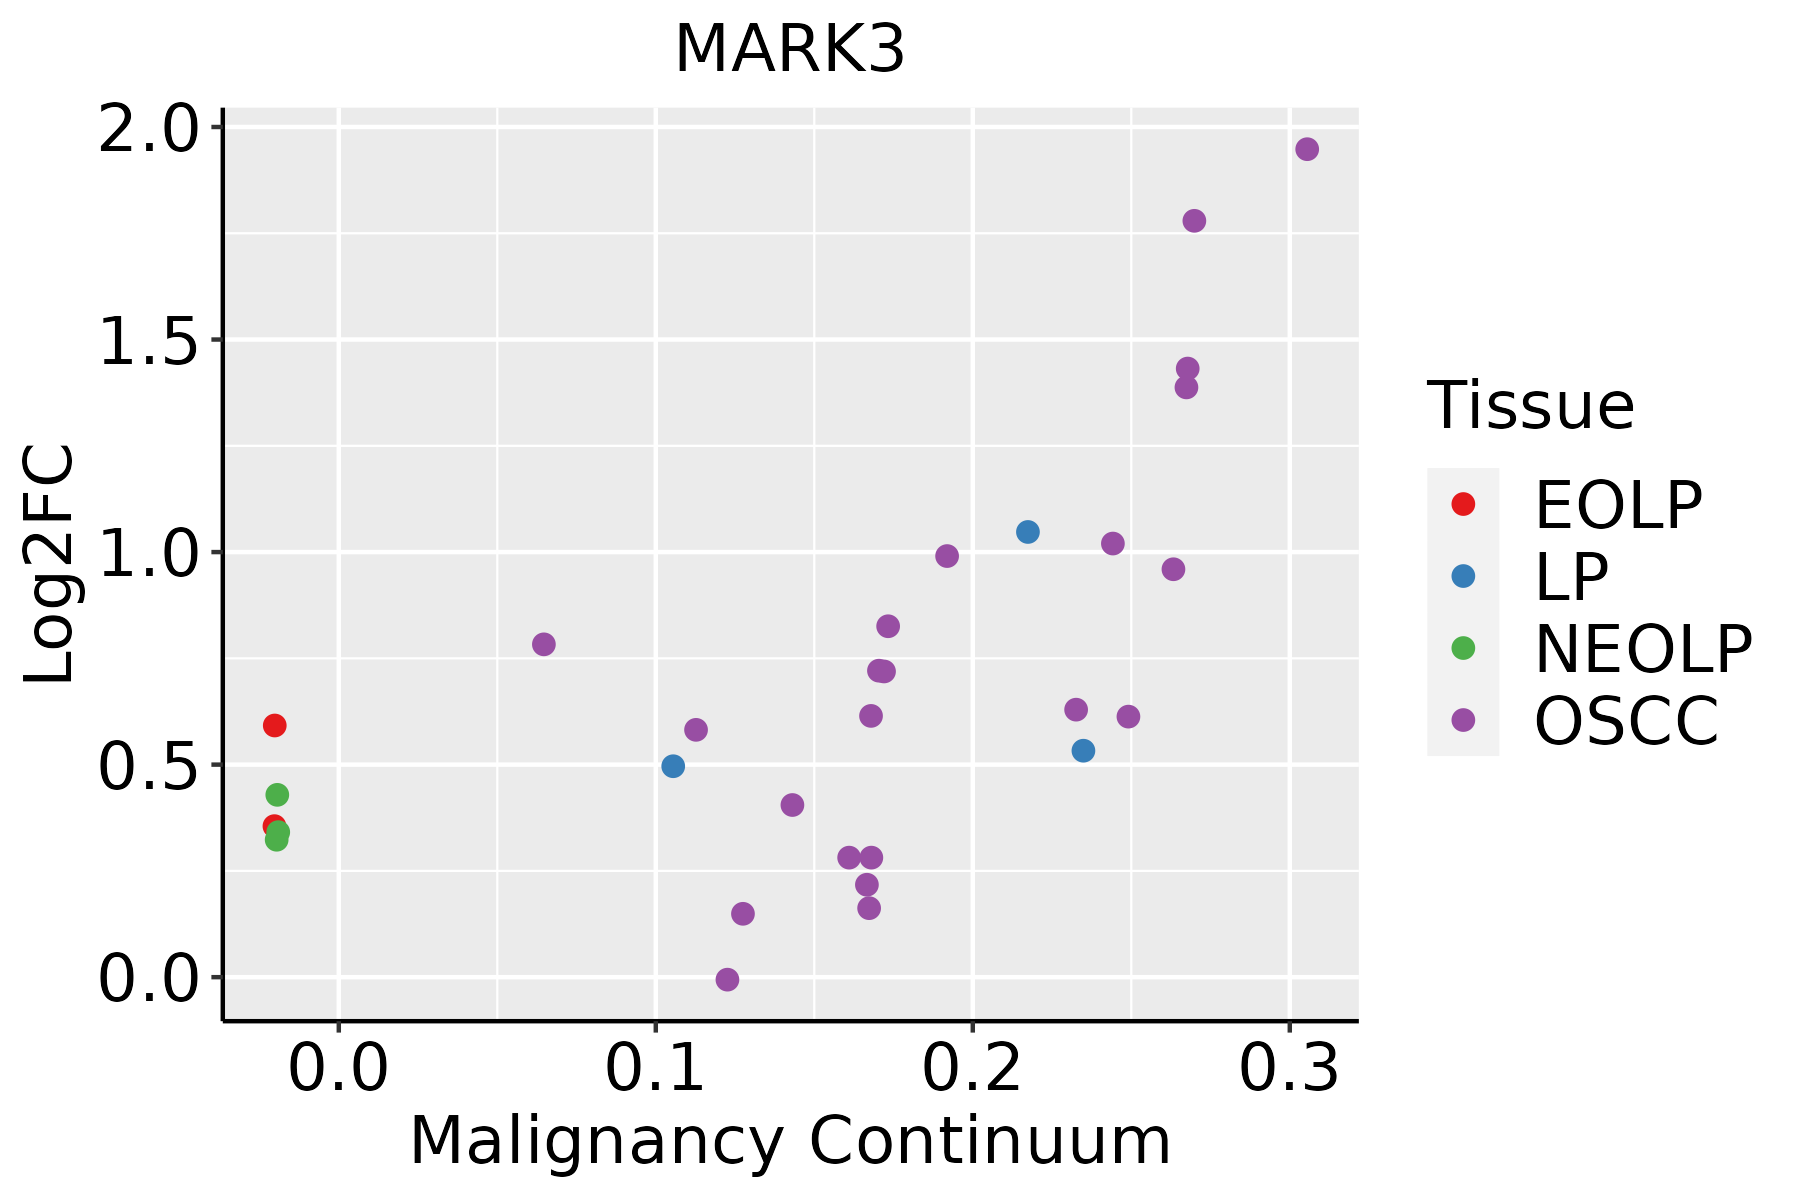 | EOLP: Erosive Oral lichen planus |
| LP: leukoplakia |
| NEOLP: Non-erosive oral lichen planus |
| OSCC: Oral squamous cell carcinoma |
| Prostate | 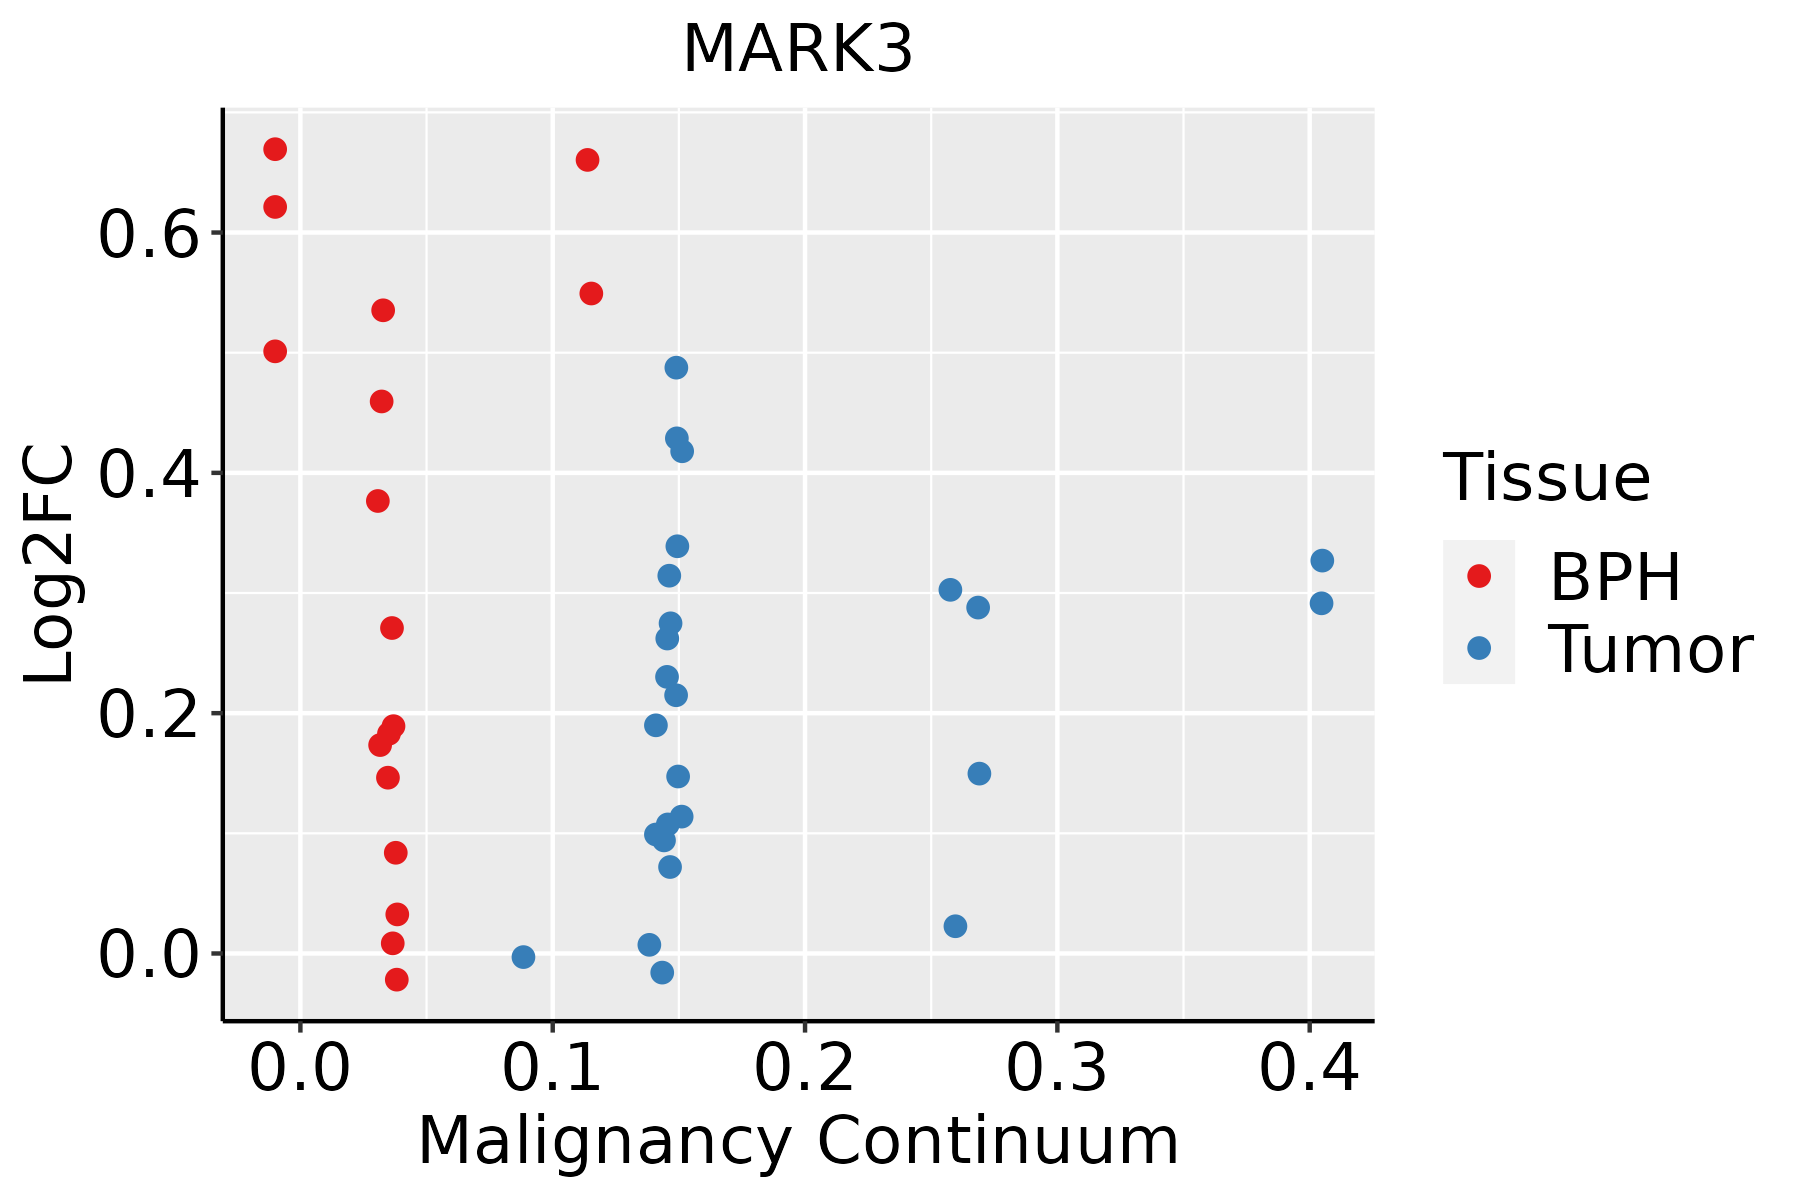 | BPH: Benign Prostatic Hyperplasia |
| Skin | 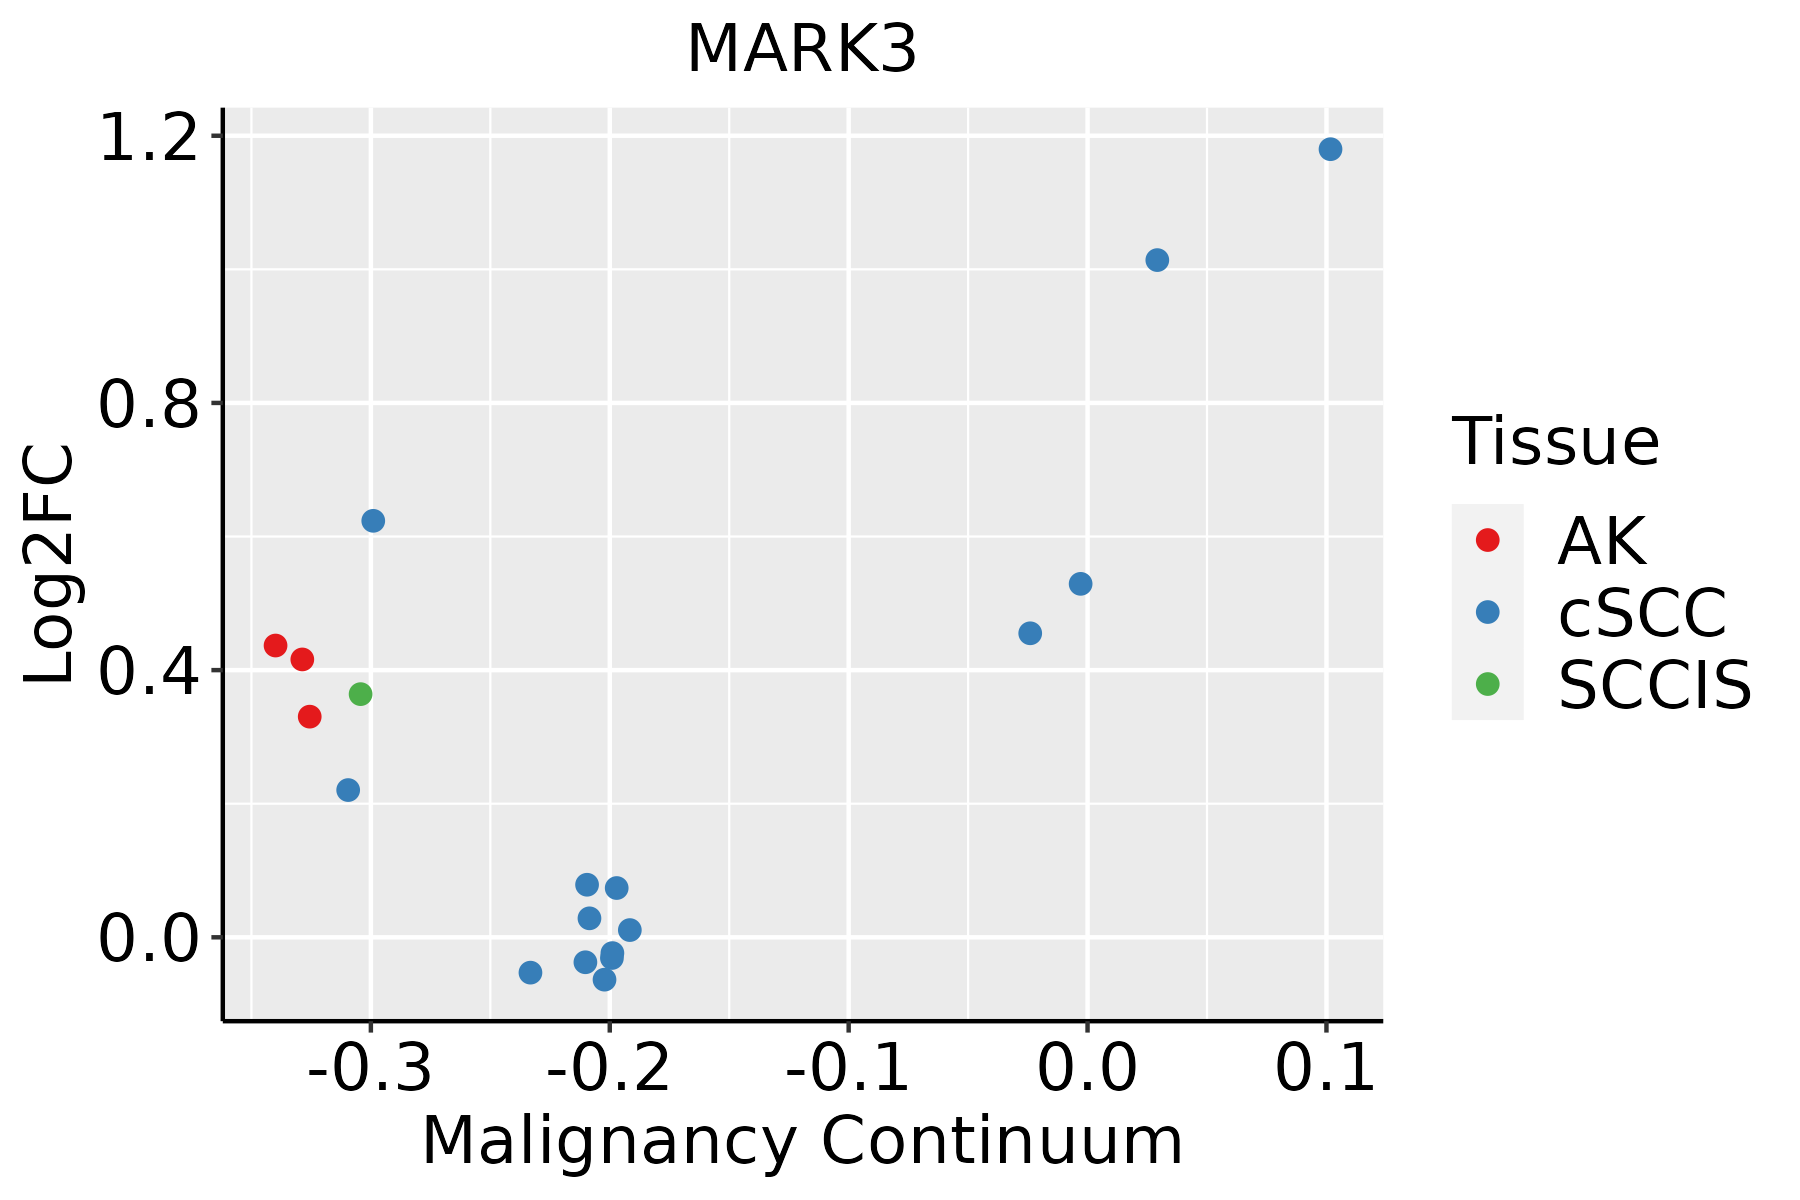 | AK: Actinic keratosis |
| cSCC: Cutaneous squamous cell carcinoma |
| SCCIS:squamous cell carcinoma in situ |
| Thyroid | 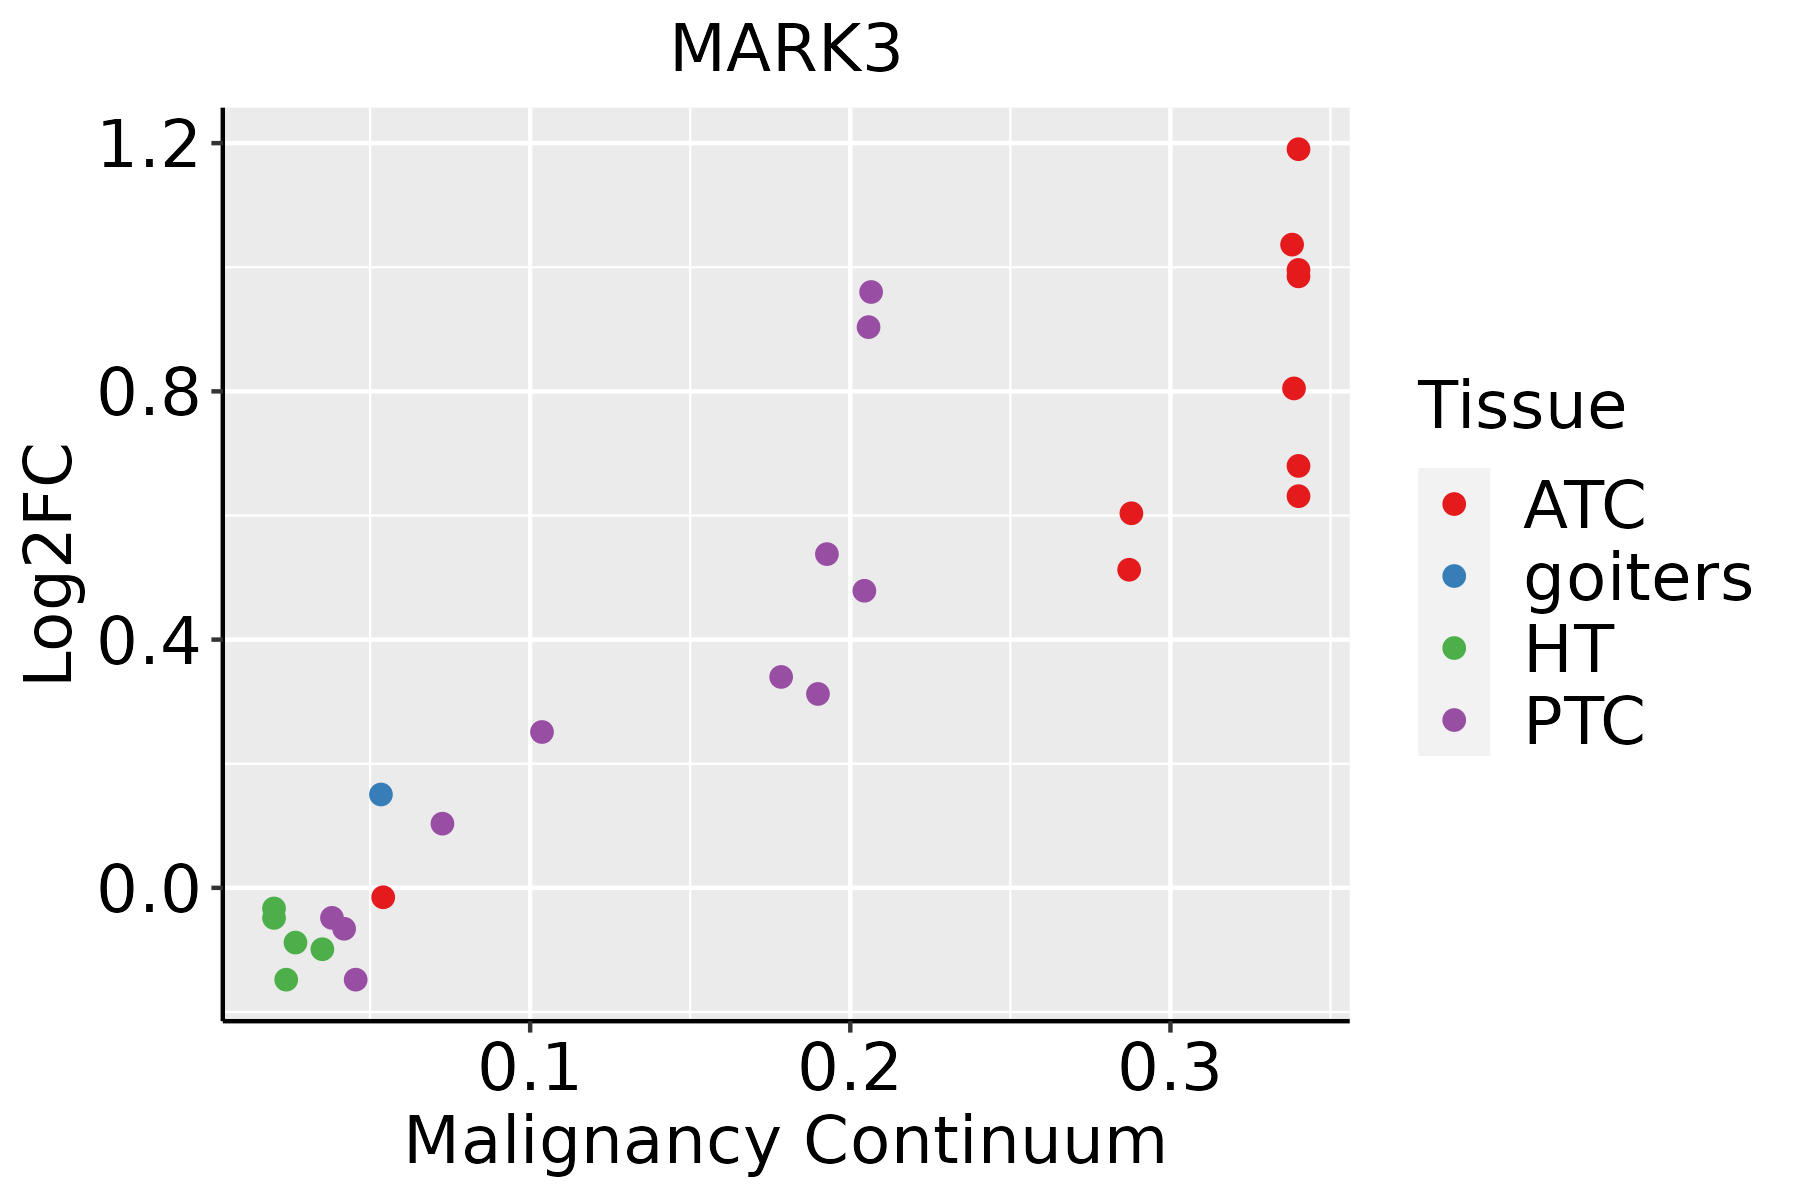 | ATC: Anaplastic thyroid cancer |
| HT: Hashimoto's thyroiditis |
| PTC: Papillary thyroid cancer |
| GO ID | Tissue | Disease Stage | Description | Gene Ratio | Bg Ratio | pvalue | p.adjust | Count |
| GO:005109810 | Cervix | CC | regulation of binding | 80/2311 | 363/18723 | 1.32e-07 | 6.42e-06 | 80 |
| GO:005109910 | Cervix | CC | positive regulation of binding | 42/2311 | 173/18723 | 1.07e-05 | 2.33e-04 | 42 |
| GO:00181057 | Cervix | CC | peptidyl-serine phosphorylation | 63/2311 | 315/18723 | 6.65e-05 | 9.47e-04 | 63 |
| GO:00182096 | Cervix | CC | peptidyl-serine modification | 66/2311 | 338/18723 | 9.58e-05 | 1.25e-03 | 66 |
| GO:00433939 | Cervix | CC | regulation of protein binding | 42/2311 | 196/18723 | 2.27e-04 | 2.55e-03 | 42 |
| GO:00320927 | Cervix | CC | positive regulation of protein binding | 21/2311 | 85/18723 | 1.27e-03 | 1.01e-02 | 21 |
| GO:00353294 | Cervix | CC | hippo signaling | 12/2311 | 40/18723 | 2.44e-03 | 1.71e-02 | 12 |
| GO:00353301 | Cervix | CC | regulation of hippo signaling | 7/2311 | 21/18723 | 1.04e-02 | 4.97e-02 | 7 |
| GO:0051098 | Colorectum | AD | regulation of binding | 126/3918 | 363/18723 | 6.01e-10 | 4.88e-08 | 126 |
| GO:0051099 | Colorectum | AD | positive regulation of binding | 66/3918 | 173/18723 | 1.47e-07 | 6.64e-06 | 66 |
| GO:0043393 | Colorectum | AD | regulation of protein binding | 68/3918 | 196/18723 | 5.17e-06 | 1.34e-04 | 68 |
| GO:0046777 | Colorectum | AD | protein autophosphorylation | 74/3918 | 227/18723 | 2.48e-05 | 4.76e-04 | 74 |
| GO:0032092 | Colorectum | AD | positive regulation of protein binding | 33/3918 | 85/18723 | 1.22e-04 | 1.78e-03 | 33 |
| GO:0018105 | Colorectum | AD | peptidyl-serine phosphorylation | 88/3918 | 315/18723 | 1.73e-03 | 1.43e-02 | 88 |
| GO:0018209 | Colorectum | AD | peptidyl-serine modification | 92/3918 | 338/18723 | 3.19e-03 | 2.36e-02 | 92 |
| GO:00510981 | Colorectum | SER | regulation of binding | 97/2897 | 363/18723 | 1.98e-08 | 1.43e-06 | 97 |
| GO:00433931 | Colorectum | SER | regulation of protein binding | 54/2897 | 196/18723 | 1.00e-05 | 3.31e-04 | 54 |
| GO:00467771 | Colorectum | SER | protein autophosphorylation | 60/2897 | 227/18723 | 1.36e-05 | 4.25e-04 | 60 |
| GO:00510991 | Colorectum | SER | positive regulation of binding | 46/2897 | 173/18723 | 1.12e-04 | 2.34e-03 | 46 |
| GO:00181051 | Colorectum | SER | peptidyl-serine phosphorylation | 66/2897 | 315/18723 | 5.47e-03 | 4.06e-02 | 66 |
| Hugo Symbol | Variant Class | Variant Classification | dbSNP RS | HGVSc | HGVSp | HGVSp Short | SWISSPROT | BIOTYPE | SIFT | PolyPhen | Tumor Sample Barcode | Tissue | Histology | Sex | Age | Stage | Therapy Types | Drugs | Outcome |
| MARK3 | SNV | Missense_Mutation | | c.800N>A | p.Arg267Lys | p.R267K | | protein_coding | deleterious(0.01) | probably_damaging(0.981) | TCGA-AC-A23H-01 | Breast | breast invasive carcinoma | Female | >=65 | I/II | Unknown | Unknown | PD |
| MARK3 | SNV | Missense_Mutation | novel | c.718N>C | p.Gly240Arg | p.G240R | | protein_coding | deleterious(0) | probably_damaging(1) | TCGA-AC-A5EH-01 | Breast | breast invasive carcinoma | Female | >=65 | I/II | Unknown | Unknown | SD |
| MARK3 | SNV | Missense_Mutation | novel | c.1066N>A | p.Glu356Lys | p.E356K | | protein_coding | deleterious(0) | probably_damaging(0.995) | TCGA-AN-A0FV-01 | Breast | breast invasive carcinoma | Female | <65 | I/II | Unknown | Unknown | SD |
| MARK3 | SNV | Missense_Mutation | | c.2013N>G | p.Asp671Glu | p.D671E | | protein_coding | tolerated(0.92) | benign(0.045) | TCGA-BH-A0EE-01 | Breast | breast invasive carcinoma | Female | >=65 | I/II | Chemotherapy | docetaxel | SD |
| MARK3 | insertion | Frame_Shift_Ins | novel | c.661_662insTGTA | p.Pro221LeufsTer3 | p.P221Lfs*3 | | protein_coding | | | TCGA-A7-A0CJ-01 | Breast | breast invasive carcinoma | Female | <65 | I/II | Chemotherapy | cytoxan | SD |
| MARK3 | insertion | In_Frame_Ins | novel | c.662_663insCTGGCCCTGCCCCATATTATTCTTGTTTTTTGGTTT | p.Pro221_Glu222insTrpProCysProIleLeuPheLeuPhePheGlyPhe | p.P221_E222insWPCPILFLFFGF | | protein_coding | | | TCGA-A7-A0CJ-01 | Breast | breast invasive carcinoma | Female | <65 | I/II | Chemotherapy | cytoxan | SD |
| MARK3 | insertion | In_Frame_Ins | novel | c.209_210insTCTCTCATTTCCTTATCTTTGTGTATGCTGTATTGC | p.Val70_Lys71insLeuSerPheProTyrLeuCysValCysCysIleAla | p.V70_K71insLSFPYLCVCCIA | | protein_coding | | | TCGA-BH-A0AY-01 | Breast | breast invasive carcinoma | Female | <65 | I/II | Chemotherapy | | SD |
| MARK3 | SNV | Missense_Mutation | novel | c.530N>A | p.Arg177Gln | p.R177Q | | protein_coding | deleterious(0) | probably_damaging(0.992) | TCGA-HM-A4S6-01 | Cervix | cervical & endocervical cancer | Female | <65 | III/IV | Chemotherapy | cisplatin | CR |
| MARK3 | SNV | Missense_Mutation | rs756154872 | c.2110N>A | p.Asp704Asn | p.D704N | | protein_coding | tolerated(0.11) | possibly_damaging(0.836) | TCGA-Q1-A73O-01 | Cervix | cervical & endocervical cancer | Female | <65 | I/II | Chemotherapy | cisplatin | CR |
| MARK3 | SNV | Missense_Mutation | novel | c.479N>C | p.Arg160Thr | p.R160T | | protein_coding | deleterious(0) | probably_damaging(0.999) | TCGA-VS-A9U6-01 | Cervix | cervical & endocervical cancer | Female | <65 | I/II | Chemotherapy | cisplatin | PD |
| Entrez ID | Symbol | Category | Interaction Types | Drug Claim Name | Drug Name | PMIDs |
| 4140 | MARK3 | KINASE, SERINE THREONINE KINASE, ENZYME, DRUGGABLE GENOME | | ALSTERPAULLONE | ALSTERPAULLONE | |
| 4140 | MARK3 | KINASE, SERINE THREONINE KINASE, ENZYME, DRUGGABLE GENOME | | PF-562271 | PF-00562271 | |
| 4140 | MARK3 | KINASE, SERINE THREONINE KINASE, ENZYME, DRUGGABLE GENOME | | LY-2090314 | LY-2090314 | |
| 4140 | MARK3 | KINASE, SERINE THREONINE KINASE, ENZYME, DRUGGABLE GENOME | inhibitor | 249565876 | | |
| 4140 | MARK3 | KINASE, SERINE THREONINE KINASE, ENZYME, DRUGGABLE GENOME | | CBP-501 | CBP-501 | |
| 4140 | MARK3 | KINASE, SERINE THREONINE KINASE, ENZYME, DRUGGABLE GENOME | | OSI-632 | OSI-632 | |
| 4140 | MARK3 | KINASE, SERINE THREONINE KINASE, ENZYME, DRUGGABLE GENOME | | SOTRASTAURIN | SOTRASTAURIN | |
| 4140 | MARK3 | KINASE, SERINE THREONINE KINASE, ENZYME, DRUGGABLE GENOME | | KENPAULLONE | KENPAULLONE | |
| 4140 | MARK3 | KINASE, SERINE THREONINE KINASE, ENZYME, DRUGGABLE GENOME | | GW441756X | GW441756X | |
| 4140 | MARK3 | KINASE, SERINE THREONINE KINASE, ENZYME, DRUGGABLE GENOME | | TOZASERTIB | TOZASERTIB | |


