
|
|||||
|
 | |
| |
| |
| |
| |
| |
|
Gene: MARK1 |
Gene summary for MARK1 |
| Gene information | Species | Human | Gene symbol | MARK1 | Gene ID | 4139 |
| Gene name | microtubule affinity regulating kinase 1 | |
| Gene Alias | MARK | |
| Cytomap | 1q41 | |
| Gene Type | protein-coding | GO ID | GO:0000226 | UniProtAcc | A0A087X0I6 |
Top |
Malignant transformation analysis |
| Identification of the aberrant gene expression in precancerous and cancerous lesions by comparing the gene expression of stem-like cells in diseased tissues with normal stem cells |
| Entrez ID | Symbol | Replicates | Species | Organ | Tissue | Adj P-value | Log2FC | Malignancy |
| 4139 | MARK1 | CCI_1 | Human | Cervix | CC | 2.03e-29 | 1.61e+00 | 0.528 |
| 4139 | MARK1 | CCI_2 | Human | Cervix | CC | 7.70e-14 | 1.01e+00 | 0.5249 |
| 4139 | MARK1 | CCI_3 | Human | Cervix | CC | 1.20e-30 | 1.30e+00 | 0.516 |
| 4139 | MARK1 | CCII_1 | Human | Cervix | CC | 6.80e-03 | 2.14e-01 | 0.3249 |
| 4139 | MARK1 | AEH-subject1 | Human | Endometrium | AEH | 1.23e-12 | 4.48e-01 | -0.3059 |
| 4139 | MARK1 | AEH-subject3 | Human | Endometrium | AEH | 1.11e-08 | 3.63e-01 | -0.2576 |
| 4139 | MARK1 | AEH-subject4 | Human | Endometrium | AEH | 8.21e-10 | 4.70e-01 | -0.2657 |
| 4139 | MARK1 | AEH-subject5 | Human | Endometrium | AEH | 5.75e-35 | 8.85e-01 | -0.2953 |
| 4139 | MARK1 | EEC-subject1 | Human | Endometrium | EEC | 2.97e-19 | 4.88e-01 | -0.2682 |
| 4139 | MARK1 | EEC-subject2 | Human | Endometrium | EEC | 6.57e-07 | 2.53e-01 | -0.2607 |
| 4139 | MARK1 | EEC-subject3 | Human | Endometrium | EEC | 1.03e-04 | 3.52e-01 | -0.2525 |
| 4139 | MARK1 | EEC-subject4 | Human | Endometrium | EEC | 3.42e-03 | 2.36e-01 | -0.2571 |
| 4139 | MARK1 | LZE2T | Human | Esophagus | ESCC | 5.90e-04 | 7.18e-01 | 0.082 |
| 4139 | MARK1 | LZE4T | Human | Esophagus | ESCC | 5.10e-04 | 1.23e-01 | 0.0811 |
| 4139 | MARK1 | LZE7T | Human | Esophagus | ESCC | 3.40e-03 | 1.94e-01 | 0.0667 |
| 4139 | MARK1 | LZE22T | Human | Esophagus | ESCC | 7.61e-04 | 2.89e-01 | 0.068 |
| 4139 | MARK1 | LZE24T | Human | Esophagus | ESCC | 2.96e-12 | 3.30e-01 | 0.0596 |
| 4139 | MARK1 | LZE21T | Human | Esophagus | ESCC | 6.15e-04 | 2.81e-01 | 0.0655 |
| 4139 | MARK1 | P1T-E | Human | Esophagus | ESCC | 6.62e-10 | 4.44e-01 | 0.0875 |
| 4139 | MARK1 | P2T-E | Human | Esophagus | ESCC | 5.10e-33 | 6.68e-01 | 0.1177 |
| Page: 1 2 3 4 5 |
| Tissue | Expression Dynamics | Abbreviation |
| Cervix |  | CC: Cervix cancer |
| HSIL_HPV: HPV-infected high-grade squamous intraepithelial lesions | ||
| N_HPV: HPV-infected normal cervix | ||
| Endometrium | 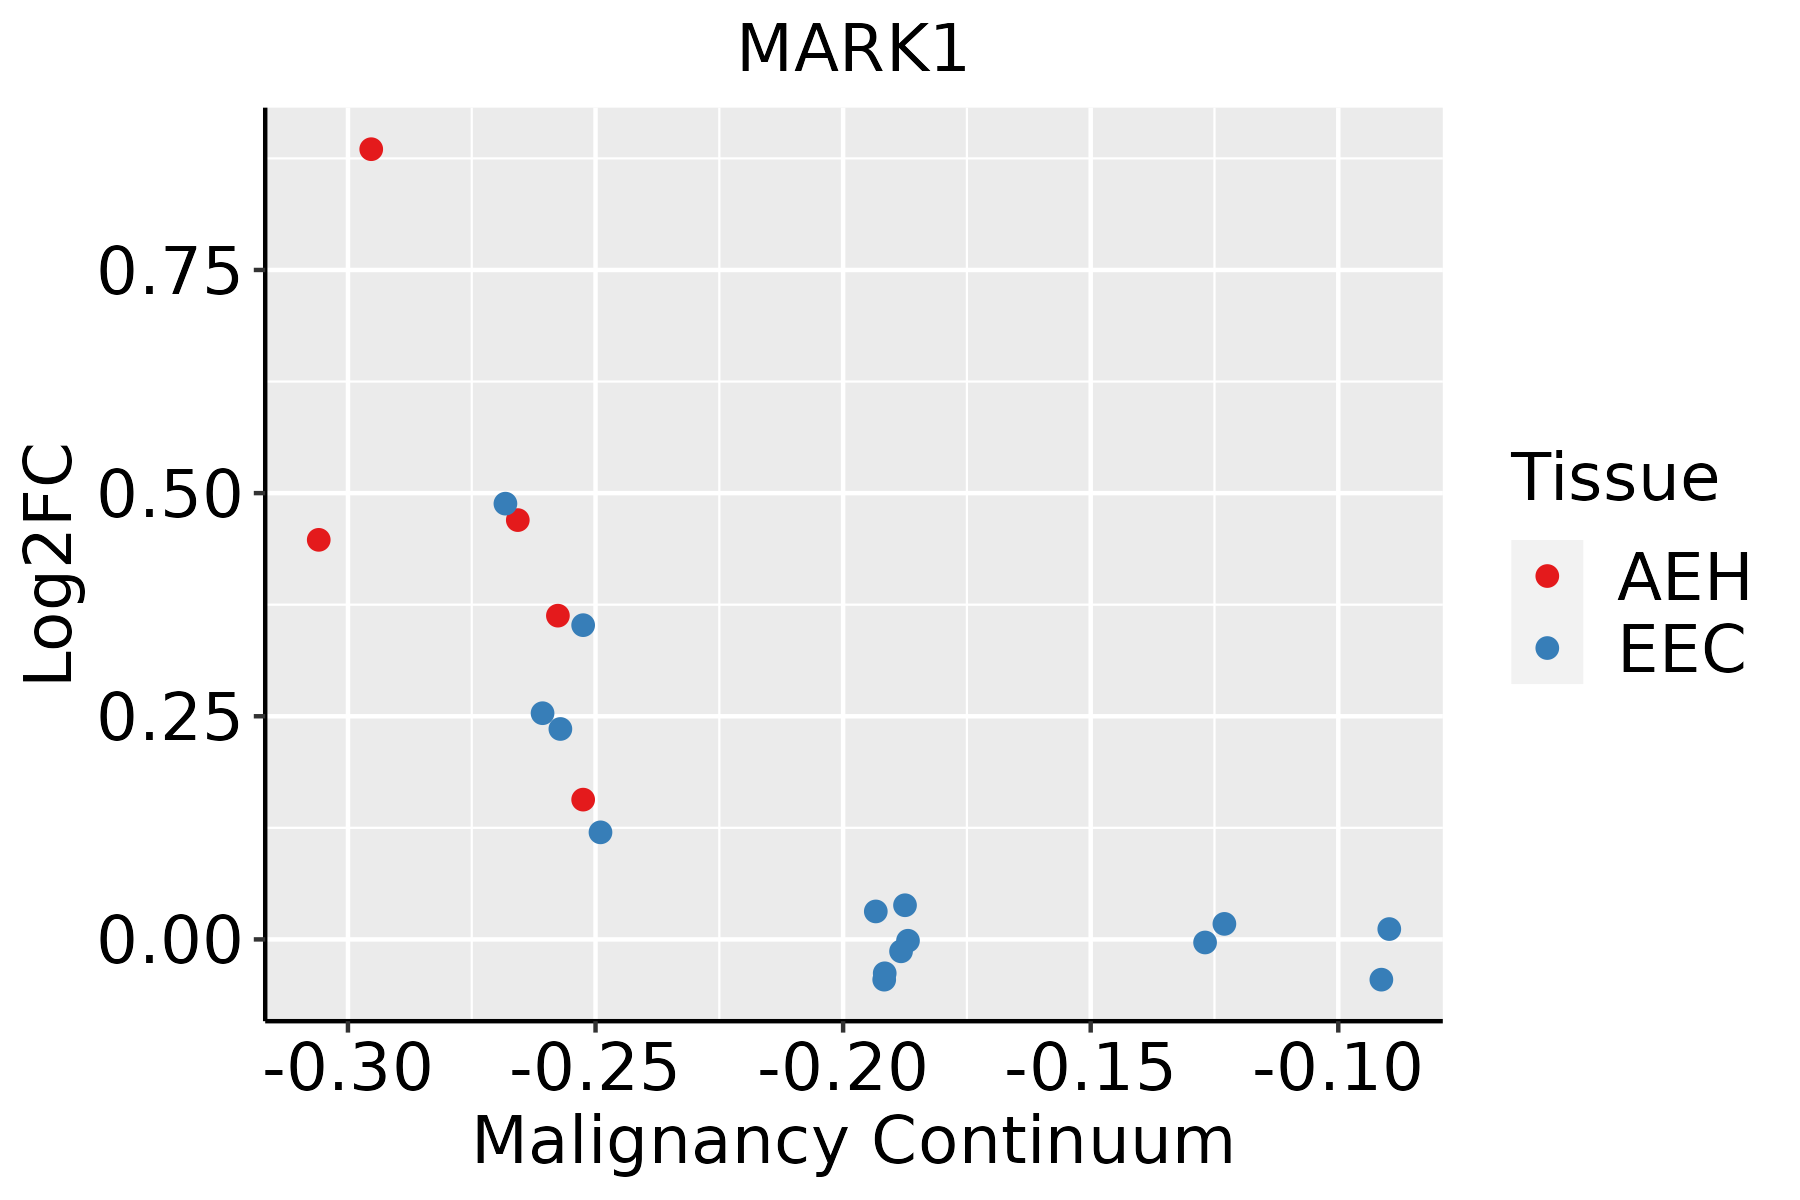 | AEH: Atypical endometrial hyperplasia |
| EEC: Endometrioid Cancer | ||
| Esophagus | 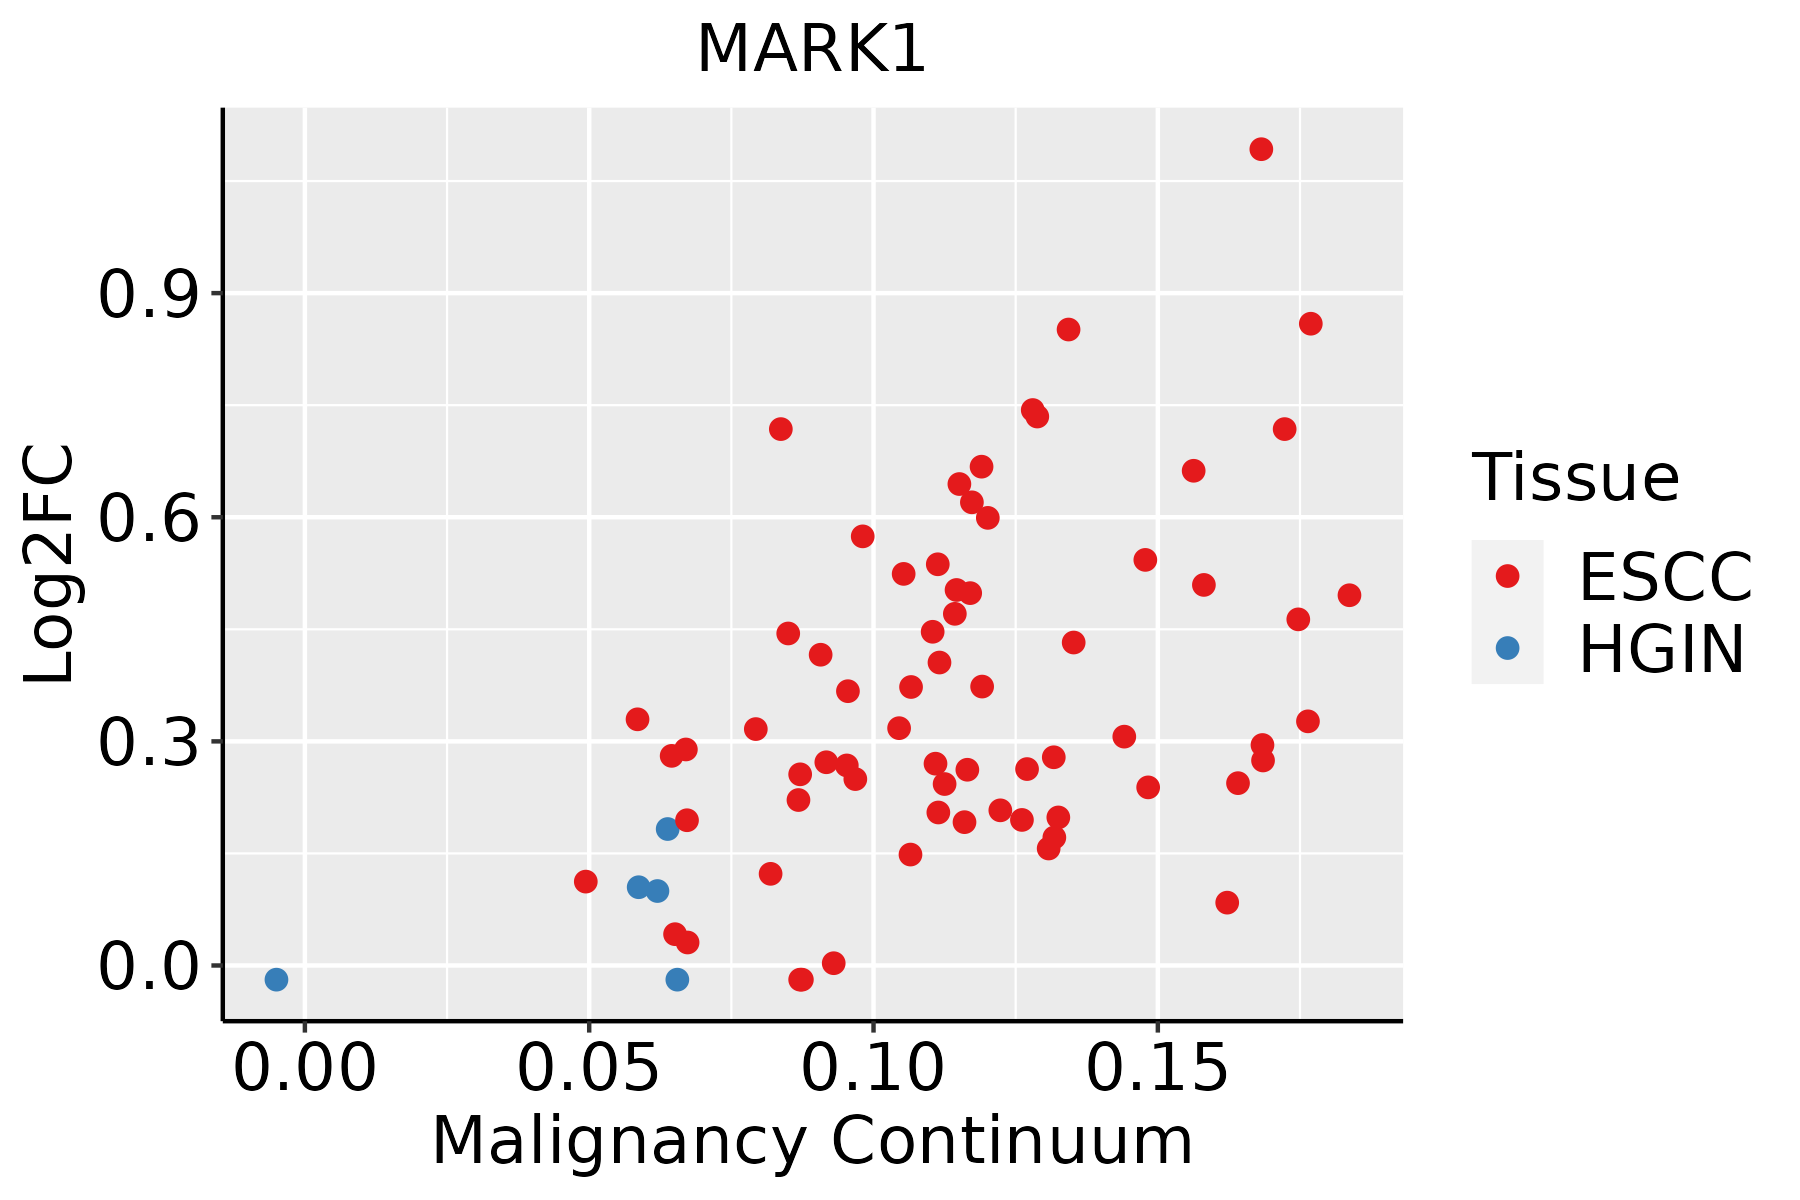 | ESCC: Esophageal squamous cell carcinoma |
| HGIN: High-grade intraepithelial neoplasias | ||
| LGIN: Low-grade intraepithelial neoplasias | ||
| Oral Cavity | 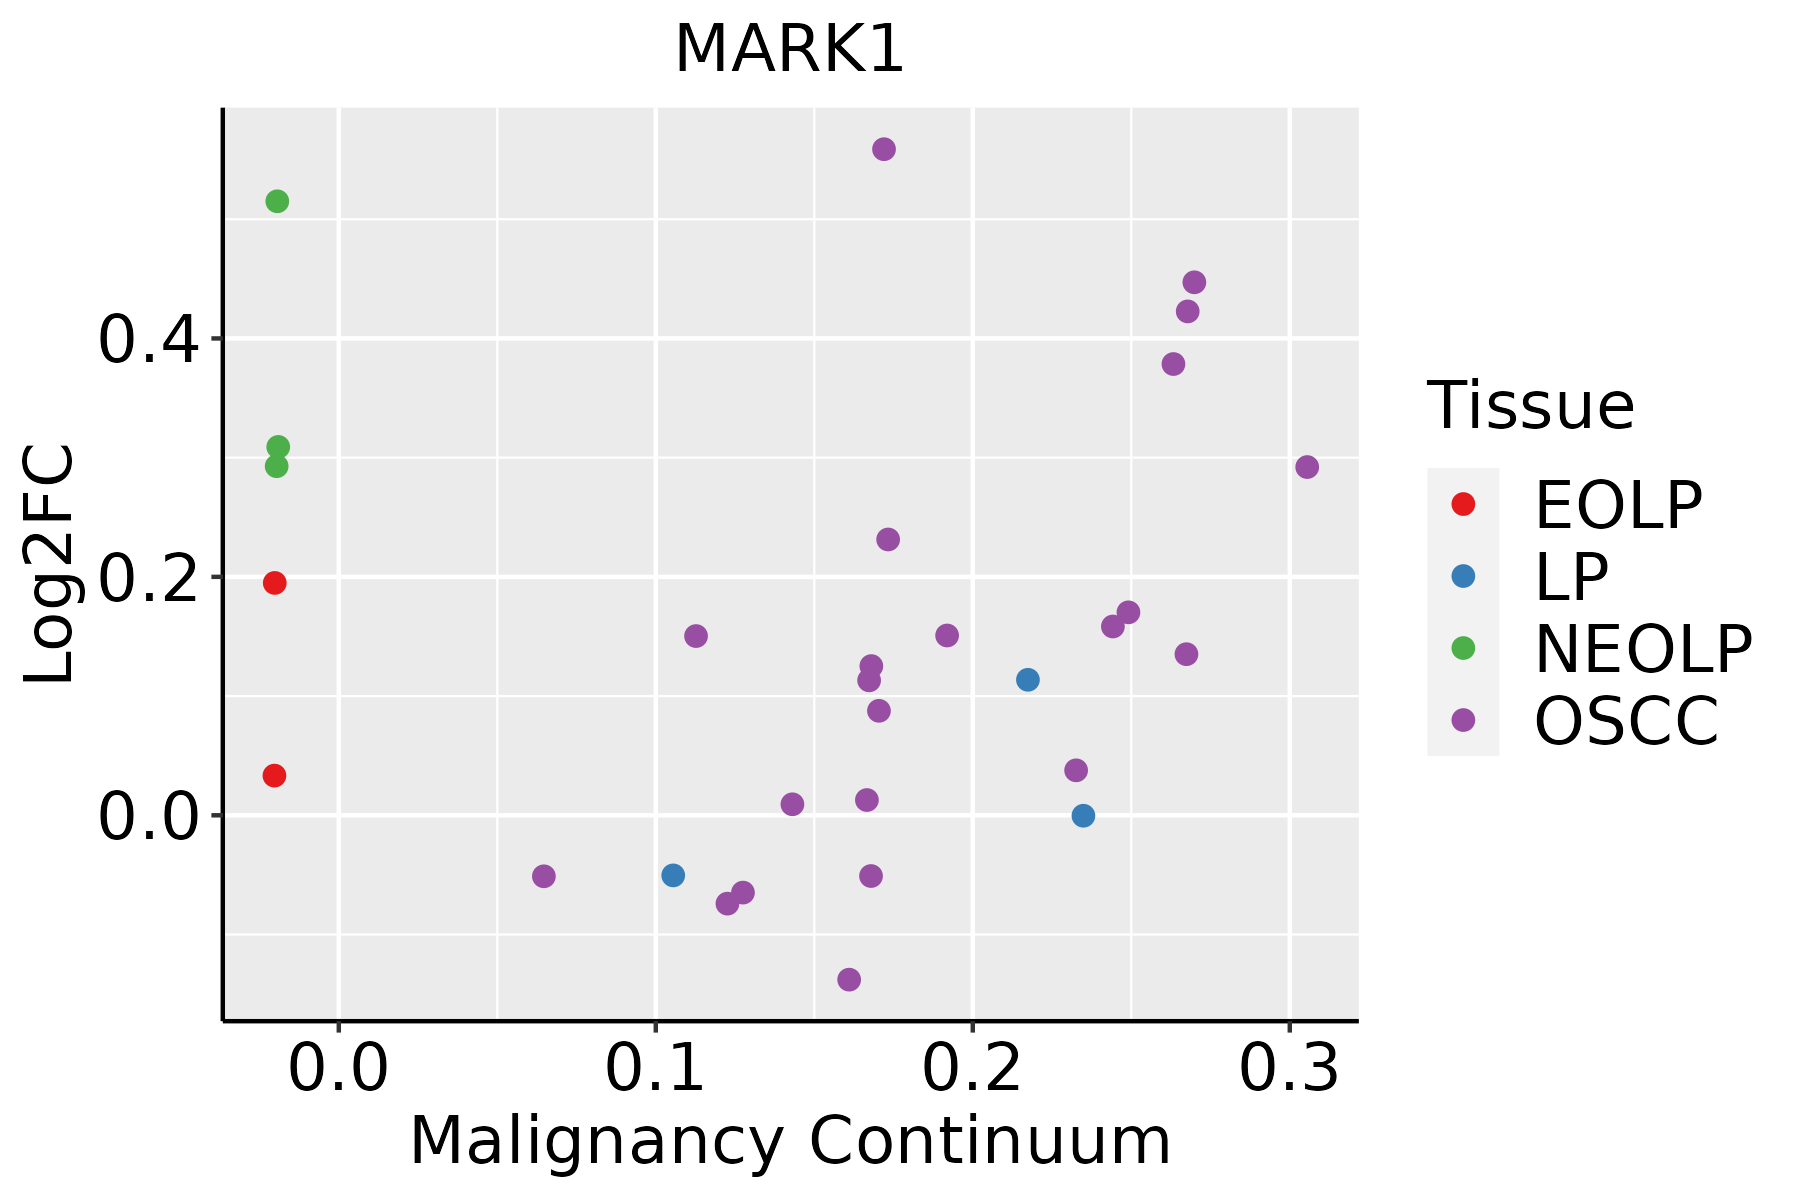 | EOLP: Erosive Oral lichen planus |
| LP: leukoplakia | ||
| NEOLP: Non-erosive oral lichen planus | ||
| OSCC: Oral squamous cell carcinoma | ||
| Skin | 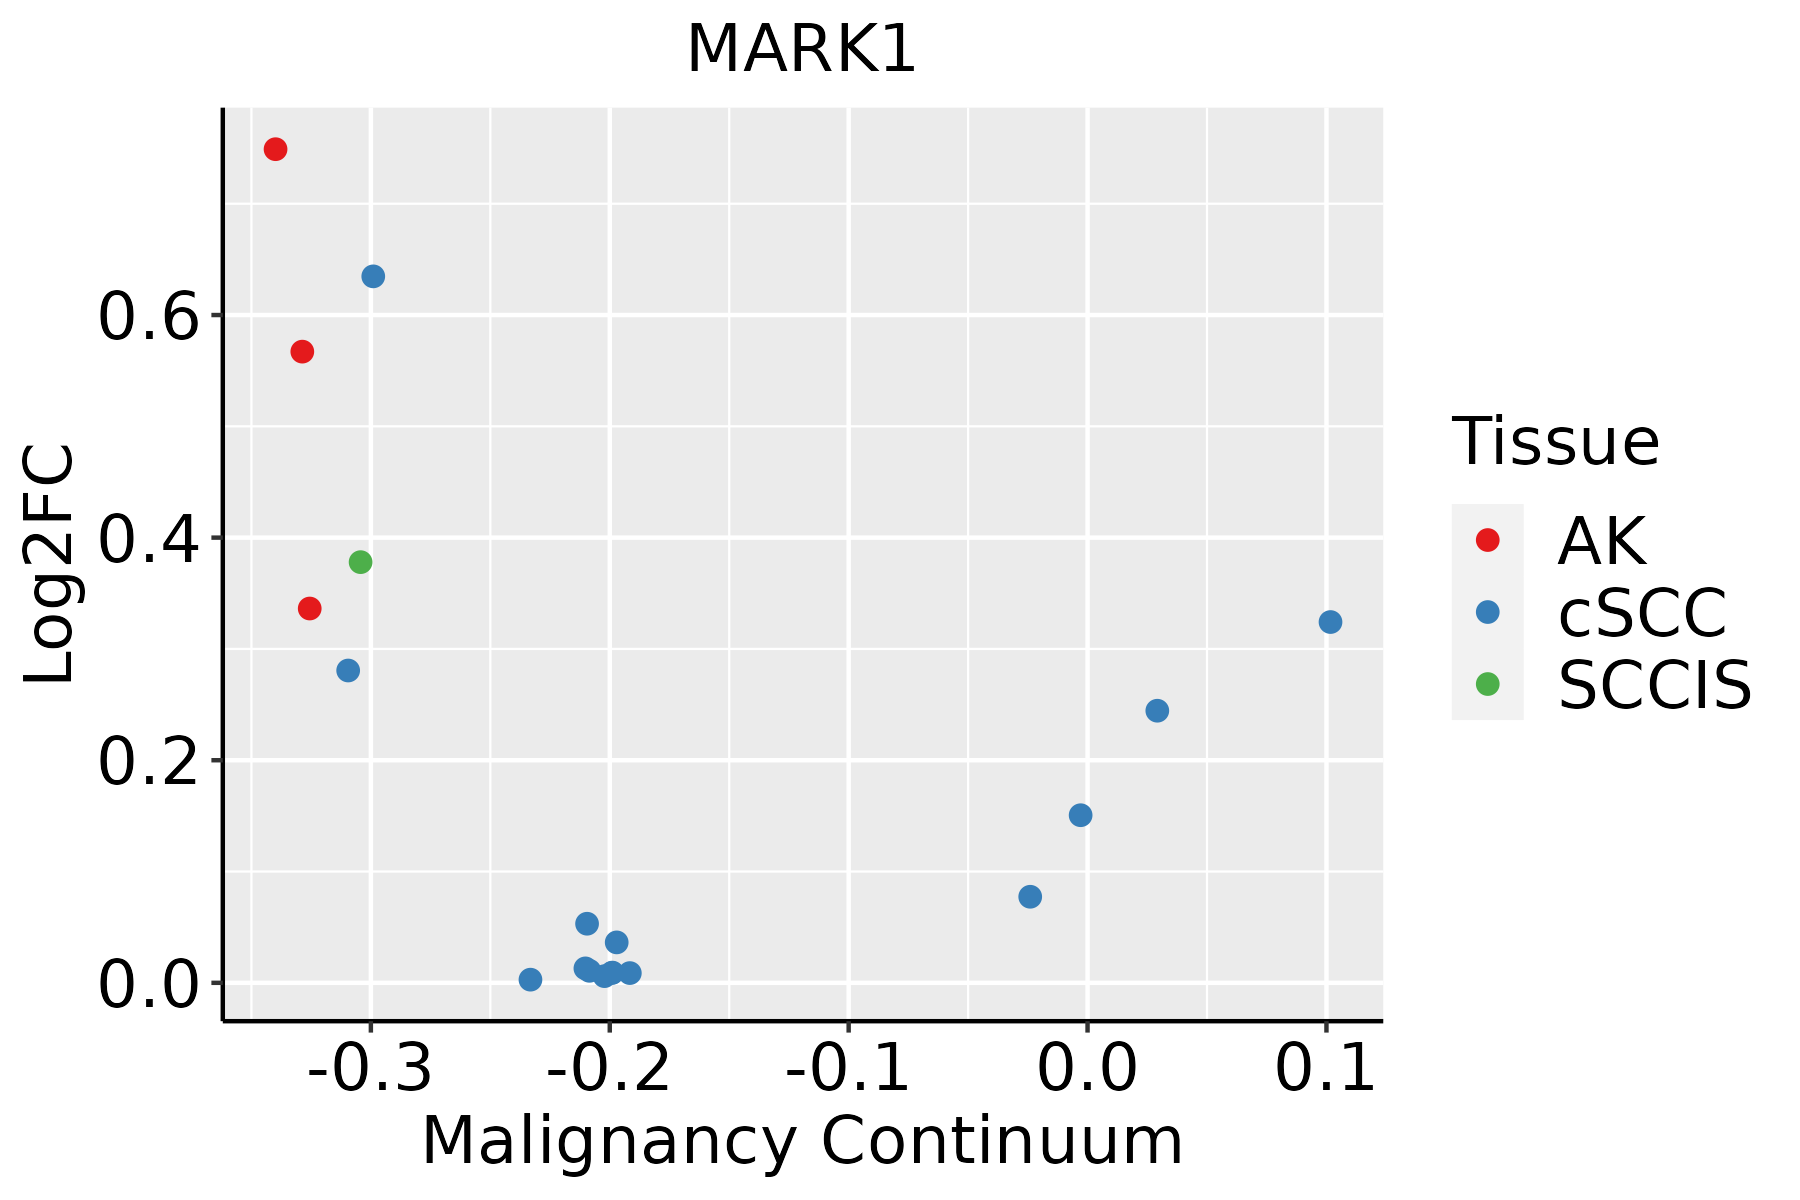 | AK: Actinic keratosis |
| cSCC: Cutaneous squamous cell carcinoma | ||
| SCCIS:squamous cell carcinoma in situ |
| ∗log2FC in expression of this searched gene in stem-like cells from each diseased tissue sample relative to stem-like cells in normal samples in each tissue plotted against the malignancy continuum. Samples are colored based on if they are from different disease stage. |
Top |
Malignant transformation related pathway analysis |
| Find out the enriched GO biological processes and KEGG pathways involved in transition from healthy to precancer to cancer |
| Tissue | Disease Stage | Enriched GO biological Processes |
| Colorectum | AD |  |
| Colorectum | SER |  |
| Colorectum | MSS |  |
| Colorectum | MSI-H |  |
| Colorectum | FAP |  |
| ∗Top 15 enriched GO BP terms are showed in the bar plot of each disease state in each tissue. Each row represents a significant GO biological process which is colored according to the -log10(p.adjust). |
| Page: 1 2 3 4 5 6 7 8 9 |
| GO ID | Tissue | Disease Stage | Description | Gene Ratio | Bg Ratio | pvalue | p.adjust | Count |
| GO:00160557 | Cervix | CC | Wnt signaling pathway | 98/2311 | 444/18723 | 4.82e-09 | 4.65e-07 | 98 |
| GO:01987387 | Cervix | CC | cell-cell signaling by wnt | 98/2311 | 446/18723 | 6.16e-09 | 5.58e-07 | 98 |
| GO:00163587 | Cervix | CC | dendrite development | 58/2311 | 243/18723 | 4.52e-07 | 1.76e-05 | 58 |
| GO:00109757 | Cervix | CC | regulation of neuron projection development | 88/2311 | 445/18723 | 4.26e-06 | 1.09e-04 | 88 |
| GO:00516567 | Cervix | CC | establishment of organelle localization | 76/2311 | 390/18723 | 3.17e-05 | 5.21e-04 | 76 |
| GO:00181057 | Cervix | CC | peptidyl-serine phosphorylation | 63/2311 | 315/18723 | 6.65e-05 | 9.47e-04 | 63 |
| GO:00182096 | Cervix | CC | peptidyl-serine modification | 66/2311 | 338/18723 | 9.58e-05 | 1.25e-03 | 66 |
| GO:00516541 | Cervix | CC | establishment of mitochondrion localization | 10/2311 | 29/18723 | 1.74e-03 | 1.31e-02 | 10 |
| GO:00516461 | Cervix | CC | mitochondrion localization | 13/2311 | 50/18723 | 6.42e-03 | 3.58e-02 | 13 |
| GO:00507733 | Cervix | CC | regulation of dendrite development | 22/2311 | 103/18723 | 6.75e-03 | 3.71e-02 | 22 |
| GO:00516568 | Endometrium | AEH | establishment of organelle localization | 77/2100 | 390/18723 | 4.89e-07 | 1.94e-05 | 77 |
| GO:00160558 | Endometrium | AEH | Wnt signaling pathway | 85/2100 | 444/18723 | 4.99e-07 | 1.97e-05 | 85 |
| GO:01987388 | Endometrium | AEH | cell-cell signaling by wnt | 85/2100 | 446/18723 | 6.07e-07 | 2.29e-05 | 85 |
| GO:00109758 | Endometrium | AEH | regulation of neuron projection development | 75/2100 | 445/18723 | 2.01e-04 | 2.54e-03 | 75 |
| GO:00163588 | Endometrium | AEH | dendrite development | 46/2100 | 243/18723 | 2.56e-04 | 3.03e-03 | 46 |
| GO:00017642 | Endometrium | AEH | neuron migration | 31/2100 | 156/18723 | 1.08e-03 | 9.46e-03 | 31 |
| GO:00181058 | Endometrium | AEH | peptidyl-serine phosphorylation | 50/2100 | 315/18723 | 7.20e-03 | 4.13e-02 | 50 |
| GO:001605513 | Endometrium | EEC | Wnt signaling pathway | 90/2168 | 444/18723 | 6.65e-08 | 3.50e-06 | 90 |
| GO:019873813 | Endometrium | EEC | cell-cell signaling by wnt | 90/2168 | 446/18723 | 8.25e-08 | 4.23e-06 | 90 |
| GO:005165613 | Endometrium | EEC | establishment of organelle localization | 75/2168 | 390/18723 | 6.23e-06 | 1.49e-04 | 75 |
| Page: 1 2 3 4 |
| Pathway ID | Tissue | Disease Stage | Description | Gene Ratio | Bg Ratio | pvalue | p.adjust | qvalue | Count |
| Page: 1 |
Top |
Cell-cell communication analysis |
| Identification of potential cell-cell interactions between two cell types and their ligand-receptor pairs for different disease states |
| Ligand | Receptor | LRpair | Pathway | Tissue | Disease Stage |
| Page: 1 |
Top |
Single-cell gene regulatory network inference analysis |
| Find out the significant the regulons (TFs) and the target genes of each regulon across cell types for different disease states |
| TF | Cell Type | Tissue | Disease Stage | Target Gene | RSS | Regulon Activity |
| ∗The dot plots of a searched regulon are shown for all cell subpopulations in each disease state of each tissue based on the regulon specific score inferred using pySCENIC and by calculating the average expression. |
| Page: 1 |
Top |
Somatic mutation of malignant transformation related genes |
| Annotation of somatic variants for genes involved in malignant transformation |
| Hugo Symbol | Variant Class | Variant Classification | dbSNP RS | HGVSc | HGVSp | HGVSp Short | SWISSPROT | BIOTYPE | SIFT | PolyPhen | Tumor Sample Barcode | Tissue | Histology | Sex | Age | Stage | Therapy Types | Drugs | Outcome |
| MARK1 | SNV | Missense_Mutation | c.2161N>C | p.Glu721Gln | p.E721Q | protein_coding | deleterious(0) | probably_damaging(0.998) | TCGA-A2-A0EY-01 | Breast | breast invasive carcinoma | Female | <65 | I/II | Chemotherapy | adriamycin | SD | ||
| MARK1 | SNV | Missense_Mutation | c.1730G>T | p.Arg577Leu | p.R577L | protein_coding | deleterious(0.03) | benign(0.421) | TCGA-A2-A25A-01 | Breast | breast invasive carcinoma | Female | <65 | I/II | Unspecific | Cytoxan | SD | ||
| MARK1 | SNV | Missense_Mutation | novel | c.422G>T | p.Gly141Val | p.G141V | protein_coding | deleterious(0) | probably_damaging(0.96) | TCGA-A7-A0DB-01 | Breast | breast invasive carcinoma | Female | <65 | I/II | Hormone Therapy | arimidex | SD | |
| MARK1 | SNV | Missense_Mutation | c.618N>T | p.Glu206Asp | p.E206D | protein_coding | deleterious(0) | probably_damaging(0.985) | TCGA-A8-A08Z-01 | Breast | breast invasive carcinoma | Female | >=65 | III/IV | Unknown | Unknown | SD | ||
| MARK1 | SNV | Missense_Mutation | c.1987C>T | p.Arg663Cys | p.R663C | protein_coding | deleterious(0) | probably_damaging(0.91) | TCGA-AN-A046-01 | Breast | breast invasive carcinoma | Female | >=65 | I/II | Unknown | Unknown | SD | ||
| MARK1 | SNV | Missense_Mutation | c.723N>T | p.Trp241Cys | p.W241C | protein_coding | deleterious(0) | probably_damaging(1) | TCGA-AN-A0XN-01 | Breast | breast invasive carcinoma | Female | >=65 | III/IV | Unknown | Unknown | SD | ||
| MARK1 | SNV | Missense_Mutation | c.985N>A | p.Asp329Asn | p.D329N | protein_coding | deleterious(0.01) | probably_damaging(0.996) | TCGA-C8-A12P-01 | Breast | breast invasive carcinoma | Female | <65 | I/II | Unknown | Unknown | SD | ||
| MARK1 | SNV | Missense_Mutation | c.2116N>G | p.Ser706Gly | p.S706G | protein_coding | deleterious(0) | probably_damaging(0.992) | TCGA-C8-A12X-01 | Breast | breast invasive carcinoma | Female | <65 | I/II | Unknown | Unknown | SD | ||
| MARK1 | SNV | Missense_Mutation | c.1164G>C | p.Gln388His | p.Q388H | protein_coding | tolerated(0.28) | possibly_damaging(0.667) | TCGA-C8-A1HM-01 | Breast | breast invasive carcinoma | Female | >=65 | I/II | Chemotherapy | doxorubicin | CR | ||
| MARK1 | SNV | Missense_Mutation | c.668N>T | p.Ala223Val | p.A223V | protein_coding | deleterious(0) | probably_damaging(0.998) | TCGA-D8-A1XZ-01 | Breast | breast invasive carcinoma | Female | >=65 | III/IV | Hormone Therapy | tamoxiphen+anastrozolum | SD |
| Page: 1 2 3 4 5 6 7 8 9 10 11 12 |
Top |
Related drugs of malignant transformation related genes |
| Identification of chemicals and drugs interact with genes involved in malignant transfromation |
| (DGIdb 4.0) |
| Entrez ID | Symbol | Category | Interaction Types | Drug Claim Name | Drug Name | PMIDs |
| 4139 | MARK1 | KINASE, DRUGGABLE GENOME, SERINE THREONINE KINASE, ENZYME | inhibitor | 249565590 | CHEMBL1236539 | |
| 4139 | MARK1 | KINASE, DRUGGABLE GENOME, SERINE THREONINE KINASE, ENZYME | inhibitor | HESPERADIN | HESPERADIN | 19035792 |
| Page: 1 |

Copyright 2023-Present -The University of Texas Health Science Center at Houston |